Back to Journals » International Journal of Nanomedicine » Volume 12
Transient loading of CD34+ hematopoietic progenitor cells with polystyrene nanoparticles
Authors Deville S, Hadiwikarta WW, Smisdom N ![]() , Wathiong B
, Wathiong B ![]() , Ameloot M
, Ameloot M ![]() , Nelissen I
, Nelissen I ![]() , Hooyberghs J
, Hooyberghs J
Received 10 August 2016
Accepted for publication 13 September 2016
Published 12 January 2017 Volume 2017:12 Pages 459—472
DOI https://doi.org/10.2147/IJN.S119407
Checked for plagiarism Yes
Review by Single anonymous peer review
Peer reviewer comments 2
Editor who approved publication: Dr Thomas Webster
Sarah Deville,1,2 Wahyu Wijaya Hadiwikarta,1 Nick Smisdom,1,2 Bart Wathiong,1,3 Marcel Ameloot,2 Inge Nelissen,1 Jef Hooyberghs1,3
1VITO, Flemish Institute for Technological Research, Mol, Belgium; 2Biomedical Research Institute, Hasselt University, Diepenbeek, Belgium; 3Theoretical Physics, Hasselt University, Diepenbeek, Belgium
Abstract: CD34+ hematopoietic progenitor cells (HPCs) offer great opportunities to develop new treatments for numerous malignant and non-malignant diseases. Nanoparticle (NP)-based strategies can further enhance this potential, and therefore a thorough understanding of the loading behavior of HPCs towards NPs is essential for a successful application. The present study focusses on the interaction kinetics of 40 nm sized carboxylated polystyrene (PS) NPs with HPCs. Interestingly, a transient association of the NPs with HPCs is observed, reaching a maximum within 1 hour and declining afterwards. This behavior is not seen in dendritic cells (CD34-DCs) differentiated from HPCs, which display a monotonic increase in NP load. We demonstrate that this transient interaction requires an energy-dependent cellular process, suggesting active loading and release of NPs by HPCs. This novel observation offers a unique approach to transiently equip HPCs. A simple theoretical approach modeling the kinetics of NP loading and release is presented, contributing to a framework of describing this phenomenon.
Keywords: nanoparticles, hematopoietic progenitor cells, dendritic cells, uptake, release
Introduction
Hematopoietic stem cells (HSCs) and hematopoietic progenitor cells (HPCs) offer great opportunities to develop new treatments for numerous malignant and non-malignant diseases. Their ability for self-renewal and to differentiate into all blood lineages is nowadays utilized for stem cell therapies.1 New strategies utilizing viral vectors or, more recently, nanoparticles (NPs) attempt to manipulate these cell types or track or guide them to the place of action.2,3 The use of NPs for HSC- and HPC-based (and concurrent and/or associated gene) therapies has received considerable attention, as it can circumvent efficacy and safety issues of the classical vehicles.4,5
Owing to their small size, NPs possess new chemical and physical properties as compared to the corresponding bulk material. As NPs are of the same order of magnitude as biomolecules and viruses, they are capable of entering the cells and interact with the cellular machinery.6,7 In the medical field, NP-based strategies offering unprecedented applications are therefore increasingly preferred over the traditional diagnostic and therapeutic methods. Indeed, 1) NPs can easily be loaded with imaging agents, bioactive molecules and drugs due to their large surface area and inner volume, 2) NP surfaces can be easily functionalized and as such have the possibility to allow for specific (sub)cellular targeting, 3) NPs display an enhanced circulation time in the blood compared to traditional therapeutics, and 4) NPs can be made multifunctional to exert both diagnostic and therapeutic actions.8 These features enable a more efficient targeting, guidance and actuation towards HSCs and HPCs. As a result, the utilization of NPs holds great promise for improved cell and gene therapies.2
Recent studies have focused on directing NPs towards HSCs; however, the use of NPs in combination with HSCs is not yet fully exploited. HSCs have been labeled with superparamagnetic iron oxide NPs and gadolinium oxide (Gd2O3) NPs for magnetic resonance imaging (MRI) contrast enhancement and cell tracking.9–12 Additionally, the delivery of peptide nucleic acids by poly(lactic-co-glycolic acid) NPs for genome editing in HSCs is currently under investigation.13,14 With the available knowledge, limited attention has been paid to the loading behavior of HSCs and HPCs with NPs, not to mention the kinetics involved. Since this determines the efficacy and safety of nanotechnology-based applications, it is definitely worthwhile to consider these aspects in more detail.
In the present study, we investigated the interaction, which includes the association with the cell membrane and uptake, and kinetics of human cord blood-derived CD34+ HPCs with well-defined, 40 nm sized yellow–green fluorescently labelled carboxylated polystyrene (YG-PS) NPs. PS NPs are of medical interest as these are used as multifunctional carriers for therapy.15,16 These are also commonly used as model NPs to study their interaction with biological systems because of their commercial availability, high quality, and wide range of sizes and surface chemistries.17 A unique transient loading behavior was observed, suggesting active loading and release of the YG-PS NPs by HPCs. This behavior was compared with that during the interaction of YG-PS NPs with myeloid-type dendritic cells (CD34-DCs). DCs are derived by differentiation from CD34+ HPCs and play a key role in initiating, directing and controlling both the innate and adaptive immune responses.18 The CD34-DCs did not exhibit the transient loading behavior.
Materials and methods
Isolation and culture of CD34+ HPCs and CD34-DCs
Isolation and culture procedures for CD34+ HPCs have been described previously.19 Briefly, human cord blood samples were collected from umbilical cord blood vessels of placentas of full-term infants, who were born at the Heilig Hart Hospital in Mol, Belgium and the St Dimpna Hospital in Geel, Belgium. An informed consent was given by the mothers, and the study was approved by the ethical commission of Heilig Hart Hospital in Mol and the St Dimpna Hospital in Geel . Mononuclear cells were separated from the cord blood by density gradient centrifugation (Ficoll-Paque™ Plus, GE Healthcare, Uppsala, Sweden). Subsequently, CD34+ HPCs were extracted using a positive immunomagnetic selection method (EasySep® Human CD34 Positive Selection Kit, Stem cell Technologies, Grenoble, France) according to the manufacturer’s guidelines. Purified HPCs (95%±3% [n=3]) were positive for CD34. HPCs were cultured for 12 days in Iscove’s Modified Dulbecco’s Medium (IMDM; Gibco, Paisley, UK) supplemented with 10% fetal bovine serum (FBS; PAA Laboratories, Pasching, Austria), 2% penicillin/streptomycin (P/S; 5,000 U/mL–5,000 μg/mL; Gibco) and 1% bovine serum albumin (BSA; Sigma-Aldrich Co., Steinheim, Germany) in the presence of tumor necrosis factor-alpha (250 U/mL; Roche Applied Science, Upper Bavaria, Germany), granulocyte-macrophage colony-stimulating factor (GM-CSF, 5,000 U/mL; Gentaur, Brussels, Belgium), stem cell factor (5 U/mL; Biosource, Nivelles, Belgium) and interleukins-4 (IL-4, 1,000 U/mL; Biosource) to induce proliferation and differentiation towards immature CD34-DCs.
The Ethical Committee of Antwerp University Hospital and the University of Antwerp have approved the overall study (B300201422021).
Characterization of NPs
Yellow–green (λex 505 nm, λem 515 nm) 40 nm sized carboxylated polystyrene (YG-PS) NPs were purchased from Molecular Probes (Invitrogen, Merelbeke, Belgium). NP dispersions were prepared by diluting the concentrated stock solutions in complete cell culture medium (CCM) – which is IMDM supplemented with 10% FBS, 2% P/S and 1% BSA – immediately before addition to the cells. YG-PS NPs were characterized in both water and CCM by means of nanoparticle tracking analysis (NTA) using a NanoSight NS500 instrument (NanoSight Ltd, Wiltshire, UK) and zeta potential determination using ZetaPALS (Brookhaven Instruments Corporation, Holtsville, NY, USA).
Dialysis of NPs
YG-PS NP stock solutions were dialyzed using Slide-A-Lyzer® Mini dialysis units and Slide-A-Lyzer® Gamma irradiated dialysis cassettes (10,000 MWCO Plus; Thermo Scientific, Rockford, IL, USA) against citric acid – phosphate buffers with different acidity (pH 5–7). The fluorescence intensity of the dialysate was monitored using a fluorescence spectrophotometer (LS55; Perkin Elmer, Waltham, MA, USA). BODIPY® FL (4,4-difluoro-5,7-dimethyl-4-bora-3a,4a-diaza-s-indacene-3-propionic acid) (Life Technologies) was used for free dye as a control in the dialysis experiments. In order to obtain pre-dialyzed PS NPs or free dye for the cell exposure experiments, YG-PS NPs were dialyzed against citric acid – phosphate buffer with pH 7 for 48 hours at 37°C. For the cell exposure experiments, the dialysate containing only the dye was further diluted and used to expose the cells. This dilution, taking into account the additional dilution due to dialysis, was performed to obtain an amount of dye equal to that of free dye present in the YG-PS NP solution used in the cell experiments.
Flow cytometry
NP loading of the cells was evaluated by using flow cytometry (FACS Calibur™, Becton Dickinson, San Jose, CA, USA). HPCs and CD34-DCs were seeded at a density of 5×10⁴ cells/well in 96-well plates and were immediately exposed to YG-PS NPs at 37°C and 5% CO2 until analysis. For the experiments performed at 4°C, cells were cooled down in the refrigerator (either 1 hour before exposure or 1 hour after exposure) and handled on ice. After the desired exposure time, the cells were transferred to PS tubes (Becton Dickinson) and washed three times with phosphate buffer saline (PBS, without Ca2+ and Mg2+, Gibco) to remove loosely adherent NPs and collected by centrifugation. Flow cytometric analyses were performed on fresh cell suspensions directly after the final collection. HPCs and CD34-DCs were identified by light scattering using gates to exclude dead cells and cell debris. For each sample, 10,000 events in the gated region were acquired. Light scattering profiles and fluorescence histograms were evaluated using CellQuest™ (Becton Dickinson) and home-written MATLAB routines (The Mathworks, Eindhoven, the Netherlands). NP loading was evaluated by the geometric mean of the fluorescence intensity (GMFI) distributions. The same photomultiplier voltages and compensation settings were applied for HPCs and CD34-DCs for comparison.
Confocal microscopy
HPCs and CD34-DCs were exposed to 50 μg mL−1 of YG-PS NPs for 1, 2, 3, 4, 6 or 24 hours at 37°C and 5% CO2. After exposure, cells were washed three times with PBS, and cell membranes were labeled with 5 μg mL−1 Alexa Fluor® 555 conjugated wheat germ agglutinin (WGA; Invitrogen) at 4°C for 30 minutes. After washing, cells were fixed with 4% formalin solution (Sigma-Aldrich Co.) and transferred to a microscope slide by means of cytocentrifugation (Tharmac Cellspin II, Tharmac, Waldsolms, Germany). Cells were mounted with Vectashield® mounting medium containing 4′,6-diamidino-2-phenylindole (DAPI; Vector Laboratories, Peterborough, UK). Images were acquired using an epifluorescence Axiovert 200M equipped with a Zeiss LSM 510 Meta confocal laser scanning microscope (Zeiss, Jena, Germany) and a LD C-Apochromat 40x/1.1 W Korr UV-VIS-IR water immersion objective (Zeiss). YG-PS NPs were excited with a 488 nm line of 30-mW air-cooled argon-ion laser (tube current set at 5.9 A) under the control of an acousto-optic modulator. WGA was excited using a 543 nm helium neon laser and DAPI was excited using 150 fs pulsed laser light of a Ti: Sapphire laser (MaiTai, Spectra-Physics, Utrecht, the Netherlands) tuned at an output wavelength of 730 nm. The excitation light was directed toward the sample through a dichroic beam splitter (HFT UV/488/543/633). For the detection and separation of the different emitted fluorescence signals, a secondary dichroic beam splitter NFT 490 or NFT 545 and three band-pass filters, BP 390-465 (DAPI), BP500-530 (YG-PS NPs) or BP565-615 (WGA), were used. Signals were directed towards an internal analog photomultiplier tube (PMT) (Zeiss).
Cell viability and proliferation
Cytotoxicity of the YG-PS NPs was assessed after 24 hours of cell exposure using Annexin V staining (Life Technologies) according to the manufacturer’s protocol. Percentage of positive cells was determined by flow cytometry. Staurosporine (0.1 μM, Sigma-Aldrich Co.) was used as a positive control for programmed cell death. Cell proliferation was determined by counting the live cells at different time points using NucleoCassette™ and NucleoCounter® (ChemoMetec, Allenød, Denmark) for HPCs, and trypan blue exclusion (Invitrogen) using a Bürker counting chamber for CD34-DCs.
Results
NP characterization
Fluorescently labeled, carboxylated YG-PS NPs with a nominal diameter of 40 nm were used in the present study. Before interaction with cells, proteins and electrolytes present within the cell culture medium may influence the intrinsic physicochemical parameters of the NPs used. Therefore, YG-PS NPs dispersions in both water and CCM after different incubation periods were characterized by means of NTA (Figure 1). NP hydrodynamic diameter increased immediately from 50±1 to 65±5 nm when diluted in CCM due to adhering biomolecules. The resulting YG-PS NPs dispersions remained stable over the duration of the experiment. No signs of agglomeration or an increase of the biomolecular corona over time were found up to 96 hours. The zeta potential of YG-PS NPs reached a value close to neutrality when dispersed in CCM (from −40±1 mV in water to 2±3 mV in CCM).
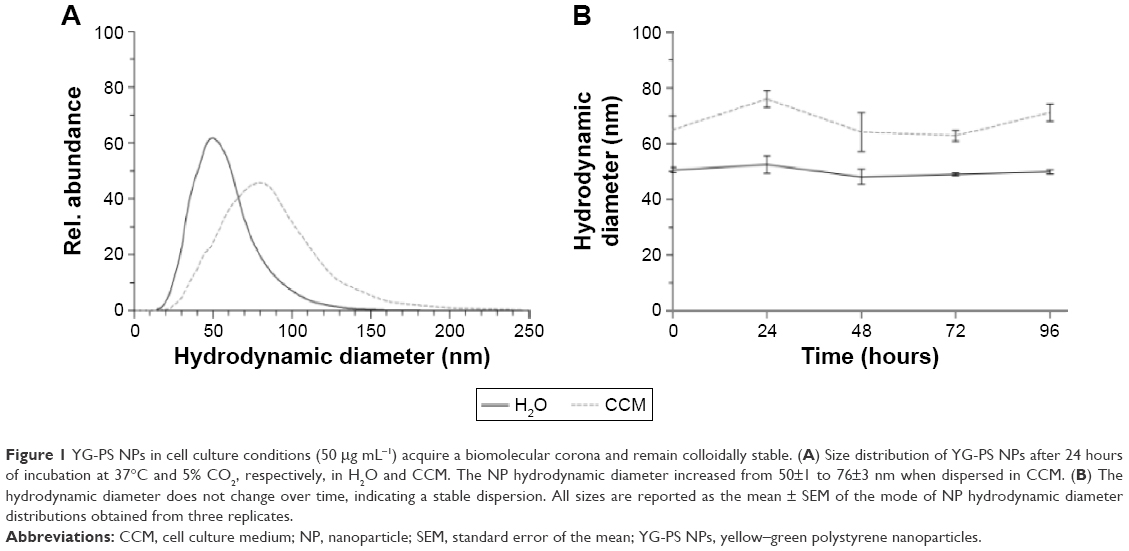 | Figure 1 YG-PS NPs in cell culture conditions (50 μg mL−1) acquire a biomolecular corona and remain colloidally stable. (A) Size distribution of YG-PS NPs after 24 hours of incubation at 37°C and 5% CO2, respectively, in H2O and CCM. The NP hydrodynamic diameter increased from 50±1 to 76±3 nm when dispersed in CCM. (B) The hydrodynamic diameter does not change over time, indicating a stable dispersion. All sizes are reported as the mean ± SEM of the mode of NP hydrodynamic diameter distributions obtained from three replicates. |
Transient NP loading in HPCs
The interaction of HPCs with NPs was evaluated by exposing the cells to fluorescently labeled YG-PS NPs with the concentration range of 5–90 μg mL−1. After 24 hours of continuous exposure, the cellular NP load was evaluated by measuring GMFI using flow cytometry (Figure 2A). HPCs displayed an almost linear loading profile with increasing NP concentration similar to CD34-DCs. However, compared to the differentiated CD34-DCs (Figure 2B), HPCs had a smaller NP loading capacity. As HPCs are non-phagocytic cells and have a lower cytoplasmic-to-nuclear ratio, they are expected to be less efficient in engulfing large amounts of extracellular material, such as NPs, than DCs with a prominent phagocytic activity.20 In order to confirm if the processing of NPs is different by both cell types, the interaction of HPCs and CD34-DCs with NPs was studied as a function of time. The NP load was measured after 1, 2, 3, 4, 5, 6 and 24 hours of exposure to 50 μg mL−1 of YG-PS NPs (Figure 2C and D).
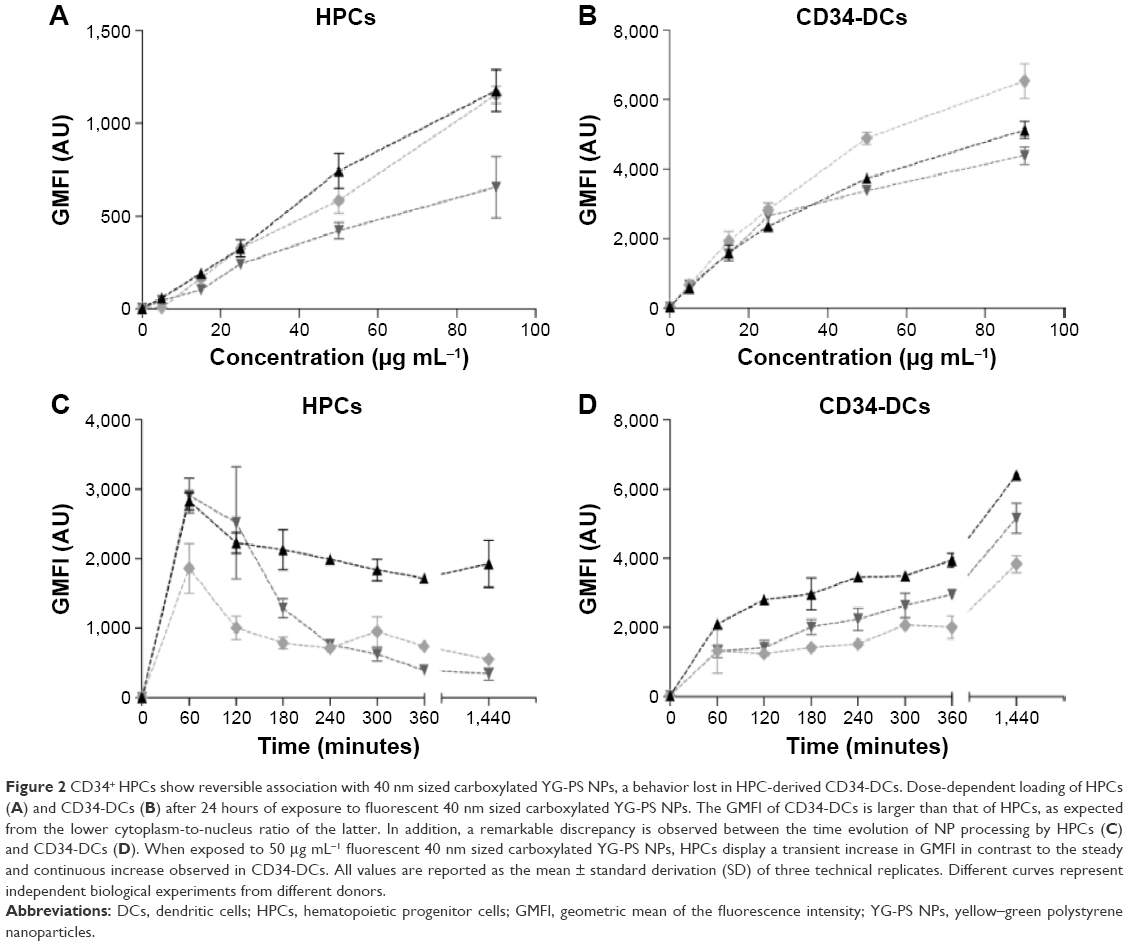 | Figure 2 CD34+ HPCs show reversible association with 40 nm sized carboxylated YG-PS NPs, a behavior lost in HPC-derived CD34-DCs. Dose-dependent loading of HPCs (A) and CD34-DCs (B) after 24 hours of exposure to fluorescent 40 nm sized carboxylated YG-PS NPs. The GMFI of CD34-DCs is larger than that of HPCs, as expected from the lower cytoplasm-to-nucleus ratio of the latter. In addition, a remarkable discrepancy is observed between the time evolution of NP processing by HPCs (C) and CD34-DCs (D). When exposed to 50 μg mL−1 fluorescent 40 nm sized carboxylated YG-PS NPs, HPCs display a transient increase in GMFI in contrast to the steady and continuous increase observed in CD34-DCs. All values are reported as the mean ± standard derivation (SD) of three technical replicates. Different curves represent independent biological experiments from different donors. |
This above-mentioned concentration was chosen because it is still in the (almost) linear range of the concentration–response profile of HPCs while resulting in a strong signal. Surprisingly, within the first hour after exposure, both HPCs and CD34-DCs promptly accumulated NPs at a comparable rate. In CD34-DCs, the NP load continued to increase up to 24 hours post-exposure in a linear behavior/fashion, similar to what has been published previously for cancer cell lines.7,21 HPCs, however, reached their maximum NP load within 1 hour of exposure, declining to a stationary state afterwards. Similar observations of decreasing cell-associated YG-PS NPs fluorescence were made using confocal microscopy analyses (Figure 3). Although HPCs obtained from different donors show variation in the absolute maximum fluorescence intensity, all samples demonstrated this transient loading behavior.
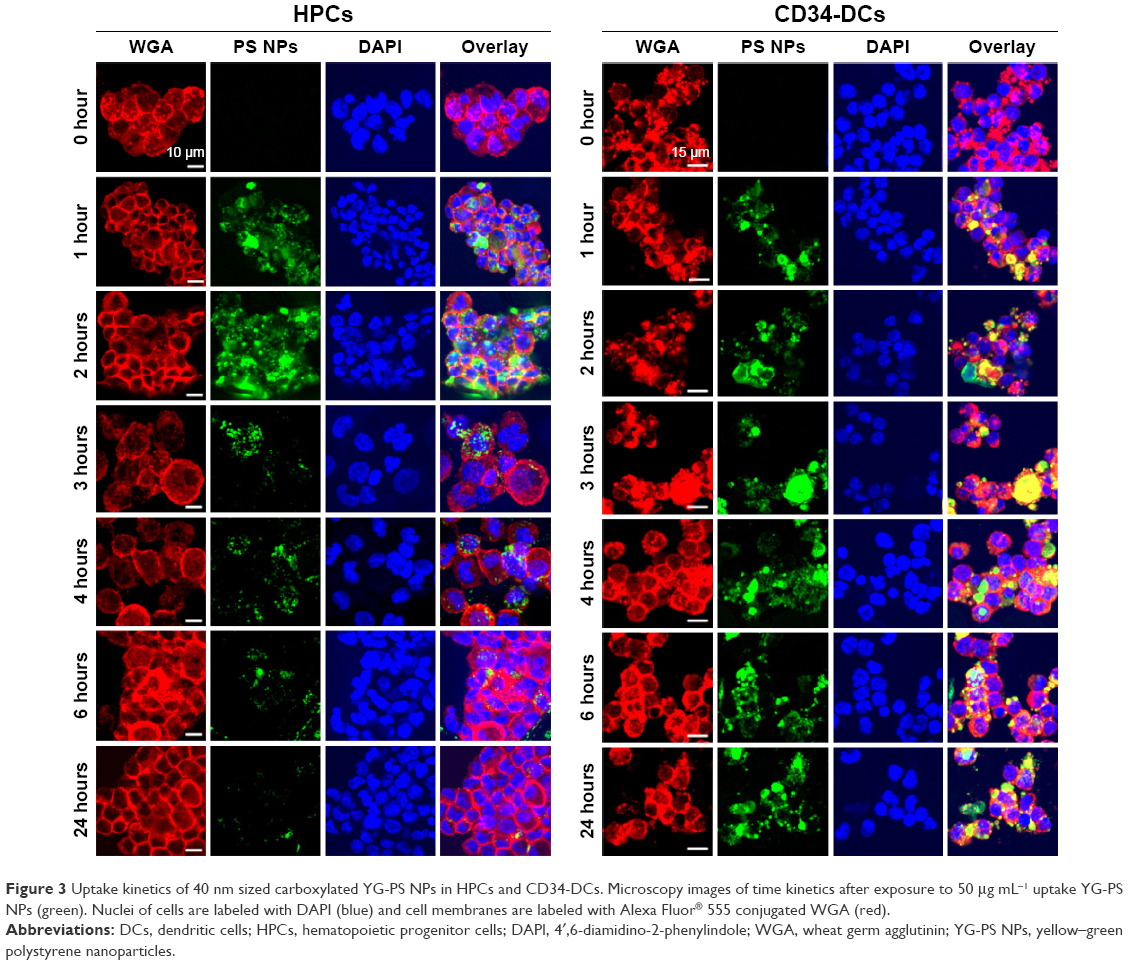 | Figure 3 Uptake kinetics of 40 nm sized carboxylated YG-PS NPs in HPCs and CD34-DCs. Microscopy images of time kinetics after exposure to 50 μg mL−1 uptake YG-PS NPs (green). Nuclei of cells are labeled with DAPI (blue) and cell membranes are labeled with Alexa Fluor® 555 conjugated WGA (red). |
Energy-dependent loading of HPCs and CD34-DCs with NPs
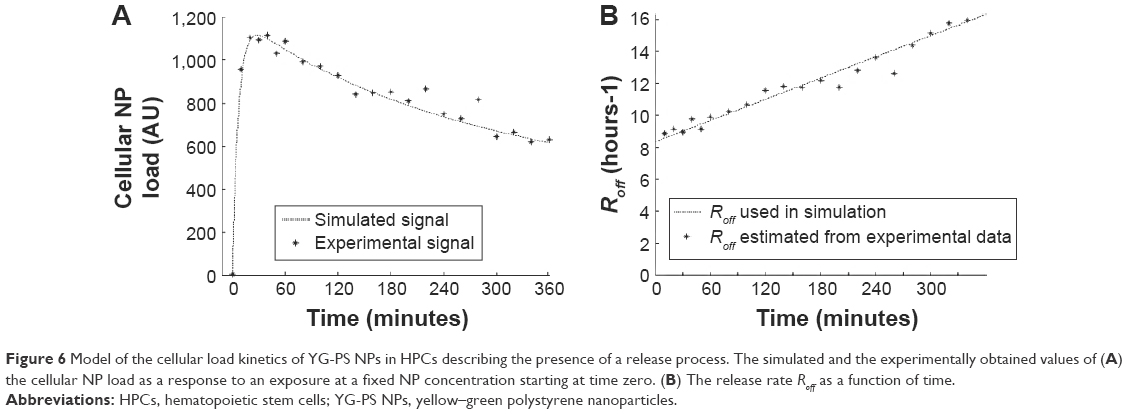
The NP load of the cells could accumulate in several ways. Discrimination between passive and active processes can be made by performing the NP exposure of the cells at 4°C. This is a common way to assess the involved mechanisms as cooling down the cells inhibits all energy-dependent cellular processes.22 Pre-incubation at 4°C for 1 hour and exposure of HPCs and CD34-DCs to 50 μg mL−1 of YG-PS NPs also at 4°C strongly abolished the loading with YG-PS NPs. This was even more obvious when comparing the acquired load with that accumulated by their cellular counterparts obtained from the same donors but exposed at 37°C (Figure 4A and B, Figure S1A and S1B). This unambiguously demonstrates that loading is an active process.
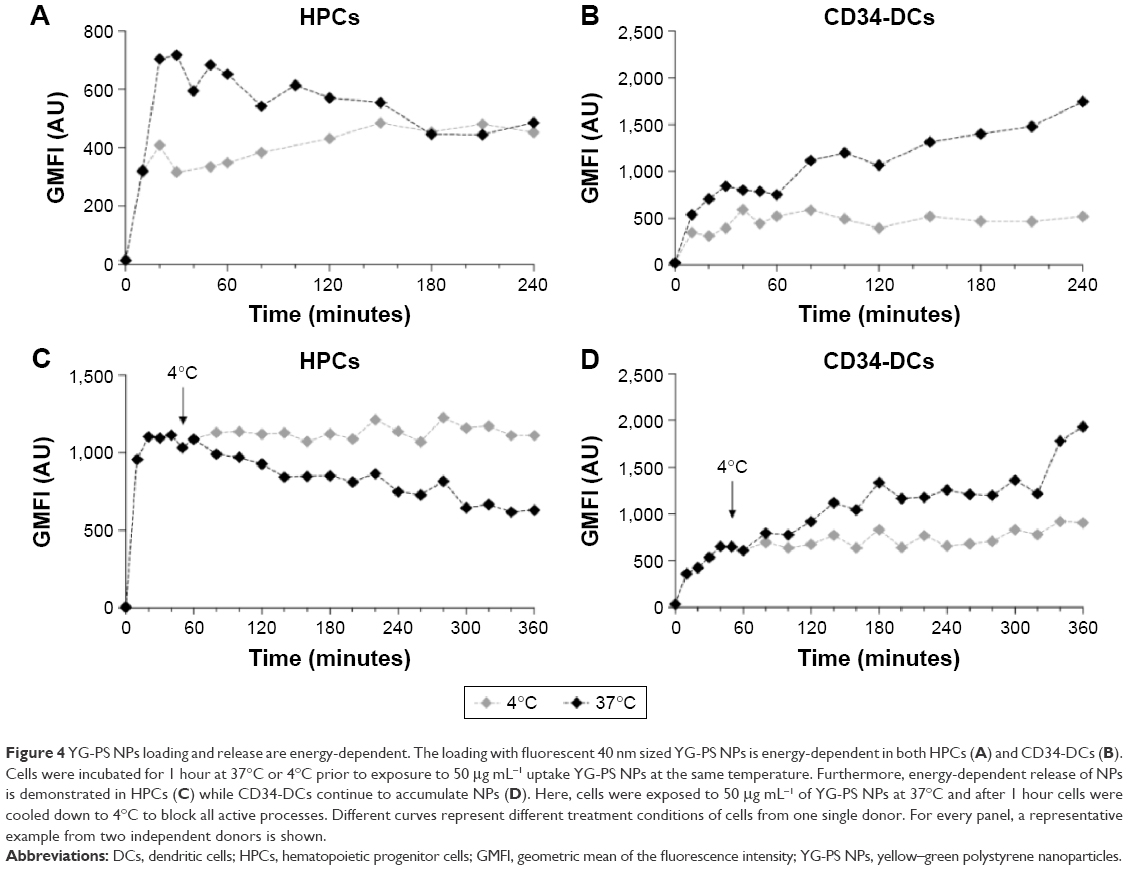 | Figure 4 YG-PS NPs loading and release are energy-dependent. The loading with fluorescent 40 nm sized YG-PS NPs is energy-dependent in both HPCs (A) and CD34-DCs (B). Cells were incubated for 1 hour at 37°C or 4°C prior to exposure to 50 μg mL−1 uptake YG-PS NPs at the same temperature. Furthermore, energy-dependent release of NPs is demonstrated in HPCs (C) while CD34-DCs continue to accumulate NPs (D). Here, cells were exposed to 50 μg mL−1 of YG-PS NPs at 37°C and after 1 hour cells were cooled down to 4°C to block all active processes. Different curves represent different treatment conditions of cells from one single donor. For every panel, a representative example from two independent donors is shown. |
In addition, cells were exposed to 50 μg mL−1 of YG-PS NPs for 1 hour at 37°C and cooled down to 4°C in the presence of YG-PS NPs in order to reveal whether the apparent YG-PS NP release process in HPCs is energy-dependent (Figure 4C and D, Figure S1C and S1D). Although HPCs at 37°C showed a strong decline in GMFI, cooling down to 4°C completely blocked this process resulting in a constant load. These results clearly demonstrate that both the loading and release processes in HPCs are energy-dependent. Moreover, these observations suggest that an arrest of NP loading occurs over time, or that the release rate of NPs changes over time, or that the signal from the YG-PS NPs declines during the course of the measurement, or a combination of these processes.
The observed transient loading cannot be ascribed to the fluorescent staining of the NPs
In order to support the hypothesis of NP release by HPCs, additional experiments were performed to exclude technical artifacts in the experimental design. A widespread problem with the use of fluorescently labeled NPs is the presence of residual free dye or labile dye which represents dye leaching out of the NPs.7,23 This could confound the obtained results in HPCs but seems, however, not to agree with the those observed in CD34-DCs.
In order to characterize the interference by dye leaching, dialysis experiments were performed to determine the extent of free dye under the experimental conditions.
NPs are recognized to enter mammalian cells through the endocytosis mechanism.24,25 NPs’ journey through the endocytic compartment corresponds to an acidification of the NPs’ environment. The endosomal acidification was mimicked here by dispersing the YG-PS NPs in citric acid – phosphate buffer having a pH of 5, 6 or 7, which corresponds to the pH within the endolysosomal compartment.26 Thereafter, YG-PS NPs dispersions were dialyzed against citric acid – phosphate buffers with different acidity. YG-PS NPs stock dispersions were used as purchased (stock YG-PS NPs) or pre-dialyzed for 48 hours to remove all labile dye already present in the NPs dispersions (pre-dialyzed YG-PS NPs). The time kinetics of the dialyses was measured by fluorescence spectroscopy (Figure S2).
Approximately 10% of free or labile dye was present in the YG-PS NP stock solutions. Pre-dialysis of the YG-PS NP stock solutions, however, was not effective in reducing the further release of labile or free dye in the dialysate. No significant effect of acidification on leaching was found. To assess the potential impact of free dye on the observed interaction kinetics of the NPs in HPCs, cells were exposed to the free dye present in the dialysate after 48 hours of dialysis at 37°C and 5% CO2 or to the corresponding amount of YG-PS NPs (Figure S3). The free dye only comprised a small portion of the total fluorescence intensity compared to the YG-PS NPs, which remained rather stable as function of the time. These data suggest a minor impact of the free dye on the observed time kinetics of YG-PS NPs in HPCs.
To investigate the possible pH-dependent changes in the fluorescence properties of the dyes embedded within or attached to the YG-PS NPs, fluorescence lifetime spectroscopy experiments were performed. The mean recovered fluorescence lifetime did not alter within the tested pH range of 5–7, indicating no significant change in the fluorescence properties of the fluorophores (Figure S4, Table S1).
Since YG-PS NP loading and release were shown to be strongly reduced when incubated at 4°C, the effect of temperature in the presence and release of labile and free dye was determined. This was achieved by dialysis at 4°C and compared to that at 37°C against a citric acid – phosphate buffer of pH 7 (data not shown). A slight difference between both conditions was found with 8% versus 12% of labile or free dye determined after 24 hours of dialysis at 4°C and 37°C, respectively. These findings demonstrate that the arrest of the release phenomenon of HPCs due to cooling down to 4°C cannot be accredited to labile and free dye alone. As incubation of YG-PS NPs at 4°C slows down the leaching only minimally, it would not be sufficient to retain the decay in GMFI of HPCs when the observed release process was due to a passive diffusion process such as dye leaching.
Negligible cell death and proliferation of HPCs and CD34-DC upon NP exposure
Cytotoxic effects and cell proliferation, in which the NP load will be divided over the daughter cells, could be another cause of the observed decrease of NP load.7,21 In order to investigate the presence of cytotoxicity, an Annexin V staining was performed after 24 hours of exposure to different doses of YG-PS NPs. In addition, the cell number was determined in both HPCs and CD34-DCs (Figure 5). No increased apoptosis was found for both cell types. Cell counting indicated a modest increase in cell proliferation for both cell types after 24 hours; however, this was not observed in the time window where the most release was observed (eg, 2–4 hours). Therefore, it is reasonable to conclude that the observed transient load is not a consequence of these processes.
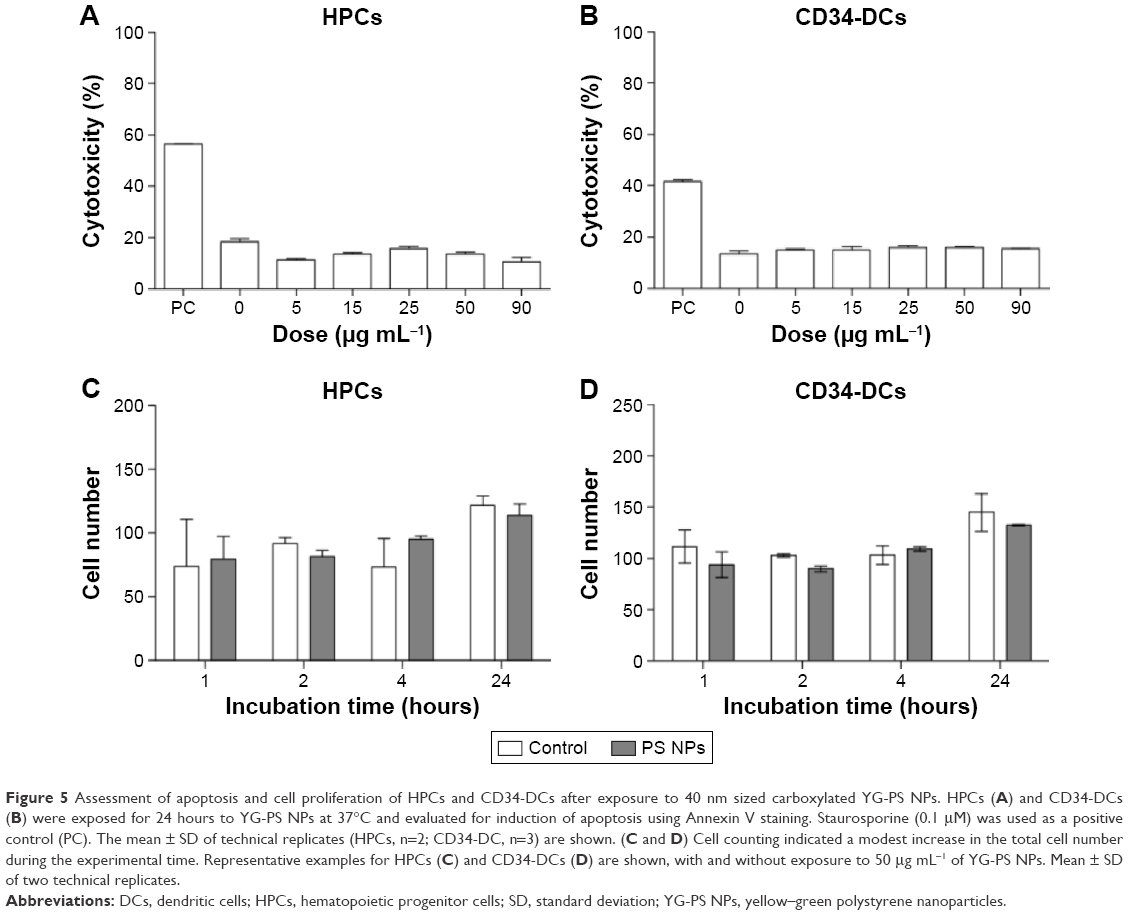 | Figure 5 Assessment of apoptosis and cell proliferation of HPCs and CD34-DCs after exposure to 40 nm sized carboxylated YG-PS NPs. HPCs (A) and CD34-DCs (B) were exposed for 24 hours to YG-PS NPs at 37°C and evaluated for induction of apoptosis using Annexin V staining. Staurosporine (0.1 μM) was used as a positive control (PC). The mean ± SD of technical replicates (HPCs, n=2; CD34-DC, n=3) are shown. (C and D) Cell counting indicated a modest increase in the total cell number during the experimental time. Representative examples for HPCs (C) and CD34-DCs (D) are shown, with and without exposure to 50 μg mL−1 of YG-PS NPs. Mean ± SD of two technical replicates. |
Modeling the kinetics of cellular NP load
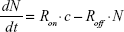
The dynamics of YG-PS NPs in HPCs can be easily described mathematically. Denote the cellular NP load by the number of particles, N, which is proportional to the experimental fluorescent signal measured by the flow cytometer (GMFI). To model the kinetics of N, we assume that cell proliferation and cell death can be neglected, which is realistic for the experiments with HPCs and also for shorter time scales of CD34-DCs (Figure 5). Then, the time dependence of N is determined by two competing contributions: a positive contribution due to the uptake of NPs from the extracellular medium increasing the cellular NP load and a negative contribution due to NPs released from the cell and entering the medium again. In its most simple form, the time derivative of N can be modeled by:
|
|
where c is the extracellular NP concentration, assumed to be a reservoir and hence constant, and Ron and Roff are the rates of the competing processes.
If Ron is constant and Roff is zero, there is no NP release and N increases linearly with time. This behavior is essentially observed in the CD34-DCs (Figure 2D) and many cell lines for short time scales.7 Our experiments with HPCs exhibit clearly a different time-dependent loading (Figure 2C), suggesting the presence of a release process, ie, a positive Roff value with a NP release proportional to the load N. In this case, the cellular NP load will experience a decreasing growth and will eventually saturate at a dynamic steady state. However, if Roff is assumed to be a constant value, ie, time-independent, N will be a monotonic function of time, which is clearly not what we observe. Our experiments show that the load N peaks within a time frame of 1 hour and decreases afterwards (Figure 2C). This suggests an active response in which the release rate increases over time. The experimental behavior can be modeled by Equation 1 if we assume a time-dependent Roff rate (Figure 6A). Figure 6B shows the estimations of Roff based on Equation 1, in which the time derivative is approximated by the finite time difference determined by the experimental measurement frequency. This time dependence can be used to numerically solve differential Equation 1, and it results in the simulated load presented in Figure 6A. This first model approach indicates that the release rate of the YG-PS NPs increases with time; this result is rather robust and remains present also when, eg, a fixed background signal is subtracted from the NP load signal, for instance, due to the adhesion of NPs to the cell membrane.
 | Figure 6 Model of the cellular load kinetics of YG-PS NPs in HPCs describing the presence of a release process. The simulated and the experimentally obtained values of (A) the cellular NP load as a response to an exposure at a fixed NP concentration starting at time zero. (B) The release rate Roff as a function of time. |
Discussion
In the present study, the interaction kinetics of carboxylated YG-PS NPs in HPCs and CD34-DCs were observed to respond differently to identical NPs and under identical conditions. HPCs showed a transient association with the YG-PS NPs, whereas the CD34-DCs displayed a monotonic increase of the NP load over time. This can partially be explained by the difference in their cell physiology. CD34-DCs are more confined to and involved in antigen presentation and immune responses,18 whereas the main ability of HPCs is to self-renew or multiply.1 The differences in cell physiology are coupled with morphological differences. HPCs derived from cord blood have a high nucleus–cytoplasm ratio, with the cytoplasm poor in organelles, although a few mitochondria and endoplasmic reticulum cisternae can be seen.20 In contrast, CD34-DCs have a relatively lower nucleus–cytoplasm ratio, with a cytoplasm containing significantly more organelles, including endosomal vesicles.27 The observations made in this study corroborate the involvement of active cellular processes in the newly observed transient load of HPCs. To our knowledge, this is the first time that this transient loading behavior of HPCs with YG-PS NPs has been reported. Brüstle et al demonstrated the interaction of HPCs and PS NPs, where the uptake of 120 nm sized carboxylated PS NPs was evaluated after 24 hours of exposure which showed the presence of intracellular vesicles containing NPs.28 Duinhouwer et al showed the uptake of PGLA NPs in HPCs after 4 and 20 hours of exposure, without affecting their proliferation and differentiation capabilities.29 Other studies in which iron oxide and Gd2O3 NPs by HPCs were used for MRI applications have reported solely their uptake and little effect on cellular function.9–11,30,31 None of these preceding studies have reported the short-time kinetics of NPs in HPCs. Transient loading of cells requires the release of the NPs, as we have described using the physics model. NP release has been reported before in multiple cell types and reviewed by Sakhtianchi et al and Oh et al.32,25 Internalized NPs are often delivered in early endosomes, which are considered as the main sorting station of the endocytic machinery.33,34 Although the majority of the NPs reside in the endolysosomal pathways, a fraction of the NPs is capable to escape to recycling endosomes and is eventually released by cells.35,36 The NPs that are trapped in the endocytic machinery will end up in the lysosomal compartments. Some of the lysosomes are capable of undergoing exocytosis through fusion with the plasma membrane.37,38 In addition, NPs that have entered the endoplasmic reticulum of the Golgi apparatus may leave cells via vesicles related to the secretion system.39 Also NPs that are present in the cytoplasm (eg, NP uptake by diffusion or endolysosomal escape of NPs) can leave the cell through re-entry to the vesicular system or via unspecific mechanisms.32,37 Based on these reports, it is conceivable to have also an active release in HPCs.
Maintaining and characterizing the physical and chemical stability of NPs are crucial requirements for correctly assessing their biological effects. Instability of the NPs can result in altered nano–bio interactions, and also complicates the interpretation of their outcome. Evaluating the uptake and release of NPs using fluorescence-based techniques is often problematic due to the presence of residual free dye or labile dye within the NP dispersion.7,23 It is very difficult to establish whether the observed phenomenon in HPCs is solely attributed to a specific cellular behavior because of the possibility of technical artifacts, which may influence the observations and the limitations of the available techniques. Although flow cytometry has proven its value in many NP uptake studies, the presence of residual free dye can strongly influence the NP uptake profile.7,23 Confocal laser scanning microscopy cannot distinguish free dye from YG-PS NPs. Moreover, as the HPCs are relatively small and have a high nucleus-to-cytoplasm volume ratio, the diffraction-limited resolution of a confocal microscope does not allow to determine the difference between internalized NPs or NPs associated with the cell membrane due to the small cytoplasm of the HPCs. In order to explore whether a significant proportion of the dye was released from the PS NPs under biological conditions, HPCs and CD34-DCs were exposed under energy-depleted conditions. These experiments demonstrated that the loading and/or release of YG-PS NPs were energy-dependent. This cannot be explained when the observed process was purely attributed to dye leaching and diffusion of the labile dye from the NPs. Moreover, the transient behavior was not attributed to HPC proliferation in which NPs divide over the daughter cells or through the induction of apoptotic cell death and the NPs may leave the cell through the release of apoptotic bodies. In order to exclude that the observed transient loading behavior of HPCs was caused by dye leaching, the amount of free dye or labile dye present in the NP mixture was determined through dialysis experiments under the experimental conditions (ie, in the pH range 5–7 analogous to the acidity of the endolysosomal compartment and cell culture medium, respectively). A limited amount of free dye was present in the dialysate of the NP stock solution, which was independent of the pH of the solution. We demonstrated that the free dye only comprised a small fraction of the total fluorescence intensity compared to that obtained when cells were exposed to YG-PS NPs. Moreover, the intensity profile remained rather stable as a function of time. These results suggest that the impact of residual free dye or labile dye on the cells is rather limited. Nevertheless, it is very difficult to establish this without any doubt, as in some reports it has been demonstrated that polymeric NPs which do not appear to leach under aqueous solutions in contrary can leach dye when they come in contact with the hydrophobic environment of the cell.7,23,40
In order to validate whether there is indeed NP internalization and an active excretion of the YG-PS NPs by HPCs over time, the intracellular and time-dependent YG-PS NPs level should ideally be monitored. Electron microscopy is frequently used to demonstrate the intracellular localization of NPs; however, as YG-PS NPs are lucent under these conditions, they can be confused with spherical vesicular structures with the risk that changes in cellular structures are mistaken for changes in the intracellular accumulation of YG-PS NPs in HPCs.41 Moreover, as YG-PS NPs are composed of organic materials, they cannot be measured using inductively coupled plasma mass spectrometry (ICP-MS) analysis. For that reason, it is highly recommended that our observations should be reproduced with other NPs having a similar size, charge and protein corona composition but different core which allows to validate the observation of NP release using other, more direct quantitative approaches such as ICP-MS or electron microscopy.
Conclusion
Therapeutic strategies and transplantations using HSCs and HPCs may benefit from their remarkable response to YG-PS NPs. The observed transient loading mechanism can open new opportunities for the safe delivery of drugs or molecules of interest with limited bioaccumulation. However, further investigation is required to explore whether the observed phenomenon is specific for the NPs used. The effects of NP species, size, functionalization, administered dose, incubation time and intracellular fate should be carefully investigated. Moreover, further research is needed to reveal how HPCs are capable of mediating the release and which cellular functions and associated dynamics are involved in this process. The resulting knowledge will allow us to exploit the full potential of NP applications in medicine.
Acknowledgment
The authors would like to thank Birgit Baré and Pascale Berckmans for their contribution in the flow cytometry experiments. This work was funded by INTERREG-IV A (BioMiMedics), BOF (Hasselt University), a tUL impulse grant Phase II by the Province of Limburg (Belgium), FP7 project QualityNano (Grant Agreement No INFRA-2010-262163). SD was supported by a fellowship of VITO and Hasselt University (BOF). NS was supported by a post-doctoral scholarship of Research Foundation Flanders (FWO Vlaanderen) and VITO. BW was supported by a fellowship of VITO.
Author’s contribution
All authors contributed toward data analysis, drafting and critically revising the paper and agree to be accountable for all aspects of the work.
Disclosure
The authors report no conflicts of interest in this work.
References
Woods NB, Ooka A, Karlsson S. Development of gene therapy for hematopoietic stem cells using lentiviral vectors. Leukemia. 2002;16(4):563–569. | ||
Edmundson M, Thanh NT, Song B. Nanoparticles based stem cell tracking in regenerative medicine. Theranostics. 2013;3(8):573–582. | ||
Lu R, Neff NF, Quake SR, Weissman IL. Tracking single hematopoietic stem cells in vivo using high-throughput sequencing in conjunction with viral genetic barcoding. Nat Biotechnol. 2011;29(10):928–933. | ||
Kay MA. State-of-the-art gene-based therapies: the road ahead. Nat Rev Genet. 2011;12(5):316–328. | ||
Stuckey DW, Shah K. Stem cell-based therapies for cancer treatment: separating hope from hype. Nat Rev Cancer. 2014;14(10):683–691. | ||
Kim JA, Aberg C, de Carcer G, Malumbres M, Salvati A, Dawson KA. Low dose of amino-modified nanoparticles induces cell cycle arrest. ACS Nano. 2013;7(9):7483–7494. | ||
Salvati A, Åberg C, dos Santos T, et al. Experimental and theoretical comparison of intracellular import of polymeric nanoparticles and small molecules: toward models of uptake kinetics. Nanomedicine. 2011;7(6):818–826. | ||
Lee DE, Koo H, Sun IC, Ryu JH, Kim K, Kwon IC. Multifunctional nanoparticles for multimodal imaging and theragnosis. Chem Soc Rev. 2012;41(7):2656–2672. | ||
England TJ, Bath PM, Abaei M, Auer D, Jones DR. Hematopoietic stem cell (CD34+) uptake of superparamagnetic iron oxide is enhanced by but not dependent on a transfection agent. Cytotherapy. 2013;15(3):384–390. | ||
Daldrup-Link HE, Rudelius M, Oostendorp RA, et al. Targeting of hematopoietic progenitor cells with MR contrast agents. Radiology. 2003;228(3):760–767. | ||
Daldrup-Link HE, Rudelius M, Piontek G, et al. Migration of iron oxide-labeled human hematopoietic progenitor cells in a mouse model: in vivo monitoring with 1.5-T MR imaging equipment. Radiology. 2005;234(1):197–205. | ||
Hedlund A, Ahren M, Gustafsson H, et al. Gd(2)O(3) nanoparticles in hematopoietic cells for MRI contrast enhancement. Int J Nanomedicine. 2011;6:3233–3240. | ||
McNeer NA, Chin JY, Schleifman EB, Fields RJ, Glazer PM, Saltzman WM. Nanoparticles deliver triplex-forming PNAs for site-specific genomic recombination in CD34+ human hematopoietic progenitors. Mol Ther. 2011;19(1):172–180. | ||
McNeer NA, Schleifman EB, Cuthbert A, et al. Systemic delivery of triplex-forming PNA and donor DNA by nanoparticles mediates site-specific genome editing of human hematopoietic cells in vivo. Gene Ther. 2013;20(6):658–669. | ||
Mottram PL, Leong D, Crimeen-Irwin B, et al. Type 1 and 2 immunity following vaccination is influenced by nanoparticle size: formulation of a model vaccine for respiratory syncytial virus. Mol Pharm. 2007;4(1):73–84. | ||
Fifis T, Gamvrellis A, Crimeen-Irwin B, et al. Size-dependent immunogenicity: therapeutic and protective properties of nano-vaccines against tumors. J Immunol. 2004;173(5):3148–3154. | ||
Varela JA, Bexiga MG, Aberg C, Simpson JC, Dawson KA. Quantifying size-dependent interactions between fluorescently labeled polystyrene nanoparticles and mammalian cells. J Nanobiotechnology. 2012;10:39. | ||
Diwan M, Elamanchili P, Lane H, Gainer A, Samuel J. Biodegradable nanoparticle mediated antigen delivery to human cord blood derived dendritic cells for induction of primary T cell responses. J Drug Target. 2003;11(8–10):495–507. | ||
Schoeters E, Verheyen GR, Nelissen I, et al. Microarray analyses in dendritic cells reveal potential biomarkers for chemical-induced skin sensitization. Mol Immunol. 2007;44(12):3222–3233. | ||
Deliliers GL, Caneva L, Fumiatti R, et al. Ultrastructural features of CD34+ hematopoietic progenitor cells from bone marrow, peripheral blood and umbilical cord blood. Leuk Lymphoma. 2001;42(4):699–708. | ||
Kim JA, Aberg C, Salvati A, Dawson KA. Role of cell cycle on the cellular uptake and dilution of nanoparticles in a cell population. Nat Nanotechnol. 2011;7(1):62–68. | ||
Rode M, Berg T, Gjøen T. Effect of temperature on endocytosis and intracellular transport in the cell line SHK-1 derived from salmon head kidney. Comp Biochem Physiol A Mol Integr. 1997;117(4):531–537. | ||
Tenuta T, Monopoli MP, Kim J, et al. Elution of labile fluorescent dye from nanoparticles during biological use. PloS One. 2011;6(10):e25556. | ||
Iversen TG, Skotland T, Sandvig K. Endocytosis and intracellular transport of nanoparticles: present knowledge and need for future studies. Nano Today. 2011;6(2):176–185. | ||
Oh N, Park JH. Endocytosis and exocytosis of nanoparticles in mammalian cells. Int J Nanomedicine. 2014;9(Suppl 1):51–63. | ||
Hara-Chikuma M, Yang B, Sonawane ND, Sasaki S, Uchida S, Verkman AS. ClC-3 chloride channels facilitate endosomal acidification and chloride accumulation. J Biol Chem. 2005;280(2):1241–1247. | ||
Clark EM, Joshi DS, Grimm AB, Joshi AD, Wang P, Joshi SS. Ultrastructural basis of enhanced antitumor cytotoxicity of cord blood-derived CTLs: a comparative analysis with peripheral blood and bone marrow. Int J Oncol. 2010;37(3):645–653. | ||
Brüstle I, Simmet T, Nienhaus GU, Landfester K, Mailänder V. Hematopoietic and mesenchymal stem cells: polymeric nanoparticle uptake and lineage differentiation. Beilstein J Nanotechnol. 2015;6:383–395. | ||
Duinhouwer LE, van Rossum BJM, van Tiel ST, et al. Magnetic resonance detection of CD34+ cells from umbilical cord blood using a 19-F label. PloS One. 2015;10(9):e0138572. | ||
Maxwell DJ, Bonde J, Hess DA, et al. Fluorophore-conjugated iron oxide nanoparticle labeling and analysis of engrafting human hematopoietic stem cells. Stem Cells. 2008;26(2):517–524. | ||
Arbab AS, Yocum GT, Rad AM, et al. Labeling of cells with ferumoxides-protamine sulfate complexes does not inhibit function or differentiation capacity of hematopoietic or mesenchymal stem cells. NMR Biomed. 2005;18(8):553–559. | ||
Sakhtianchi R, Minchin RF, Lee KB, Alkilany AM, Serpooshan V, Mahmoudi M. Exocytosis of nanoparticles from cells: role in cellular retention and toxicity. Adv Colloid Interface Sci. 2013;201–202:18–29. | ||
dos Santos T, Varela J, Lynch I, Salvati A, Dawson KA. Effects of transport inhibitors on the cellular uptake of carboxylated polystyrene nanoparticles in different cell lines. PLoS One. 2011;6(9):e24438. | ||
dos Santos T, Varela J, Lynch I, Salvati A, Dawson KA. Quantitative assessment of the comparative nanoparticle-uptake efficiency of a range of cell lines. Small. 2011;7(23):3341–3349. | ||
Stayton I, Winiarz J, Shannon K, Ma Y. Study of uptake and loss of silica nanoparticles in living human lung epithelial cells at single cell level. Anal Bioanal Chem. 2009;394(6):1595–1608. | ||
Chu Z, Huang Y, Tao Q, Li Q. Cellular uptake, evolution, and excretion of silica nanoparticles in human cells. Nanoscale. 2011;3(8):3291–3299. | ||
Panyam J, Labhasetwar V. Dynamics of endocytosis and exocytosis of poly(D,L-lactide-co-glycolide) nanoparticles in vascular smooth muscle cells. Pharm Res. 2003;20(2):212–220. | ||
Jiang X, Rocker C, Hafner M, Brandholt S, Dorlich RM, Nienhaus GU. Endo- and exocytosis of zwitterionic quantum dot nanoparticles by live HeLa cells. ACS Nano. 2010;4(11):6787–6797. | ||
Cartiera MS, Johnson KM, Rajendran V, Caplan MJ, Saltzman WM. The uptake and intracellular fate of PLGA nanoparticles in epithelial cells. Biomaterials. 2009;30(14):2790–2798. | ||
Pietzonka P, Rothen-Rutishauser B, Langguth P, Wunderli-Allenspach H, Walter E, Merkle HP. Transfer of lipophilic markers from PLGA and polystyrene nanoparticles to caco-2 monolayers mimics particle uptake. Pharm Res. 2002;19(5):595–601. | ||
Mühlfeld C, Rothen-Rutishauser B, Vanhecke D, Blank F, Gehr P, Ochs M. Visualization and quantitative analysis of nanoparticles in the respiratory tract by transmission electron microscopy. Part Fibre Toxicol. 2007;4(1):11. |
Supplementary materials
Nanoparticle uptake and uptake kinetics in HPCs and CD34-DCs
Dialysis of nanoparticles
Interaction kinetics of nanoparticles versus free dye in HPCs
Fluorescence lifetime spectroscopy
The YG-PS NP stock solution was 100-fold diluted in citric acid – phosphate buffers with different pH (pH 5, 6 and 7). An identical microscope used for imaging experiments was employed. The YG-PS NPs were excited with a stationary femto-second pulsed laser (MaiTai DeepSee, Spectra-Physics) tuned at an output wavelength of 800 nm. The emission light was detected using non-descanned detection method: The fluorescence was directed using a dichroic mirror KP650, a short-pass KP685 and a band-pass BP565-615 IR towards a photon-counting PMT (Hamamatsu 7422, Herrsching am Ammersee, Germany). This PMT was connected to an SPC830 card (Becker and Hickl, Berlin, Germany). For each buffer, minimum two time traces were collected in fifo mode for 60 s with a micro time resolution of 12 bit spread over 10 ns. The histogram of arrival times of the resulting data was analyzed using SPCImage with an incomplete multi-exponential model consisting of two lifetime components. The mean lifetime τm was calculated using Equation S1:
|
|

where ai and τi are, respectively, the amplitude and the lifetime of the ith component.
 | Figure S1 YG-PS NPs loading and release are energy-dependent. The loading with fluorescent 40 nm sized YG-PS NPs is energy-dependent in both HPCs (A) and CD34-DCs (B). Cells were incubated for 1 hour at 37°C or 4°C prior to exposure to 50 μg mL−1 uptake YG-PS NPs at the same temperature. Furthermore, energy-dependent release of NPs is demonstrated in HPCs (C), while CD34-DCs continue to accumulate NPs (D). Here, cells were exposed to 50 μg mL−1 of YG-PS NPs at 37°C and after 1 hour cells were cooled down to 4°C to block all active processes. Different curves represent different treatment conditions of cells from one single donor. For every panel a representative example from two independent donors is shown. |
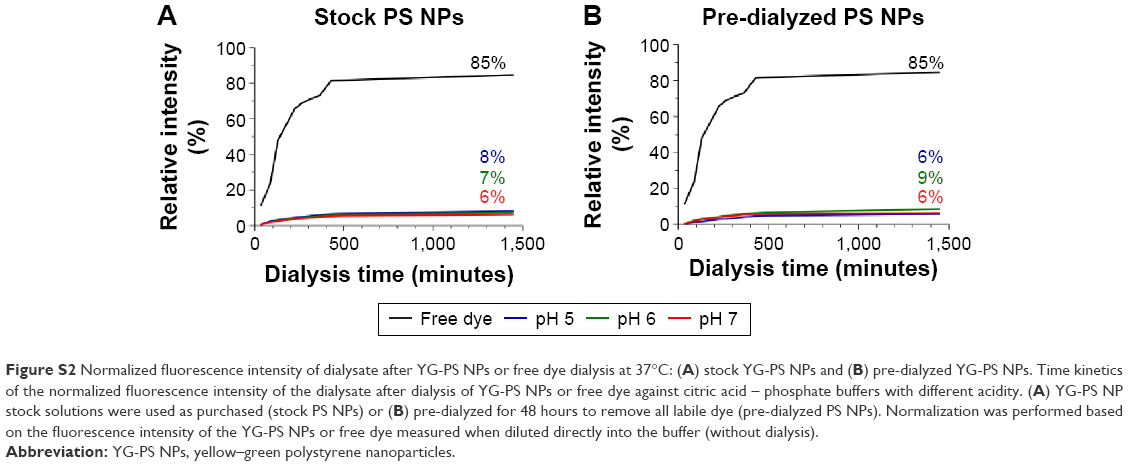 | Figure S2 Normalized fluorescence intensity of dialysate after YG-PS NPs or free dye dialysis at 37°C: (A) stock YG-PS NPs and (B) pre-dialyzed YG-PS NPs. Time kinetics of the normalized fluorescence intensity of the dialysate after dialysis of YG-PS NPs or free dye against citric acid – phosphate buffers with different acidity. (A) YG-PS NP stock solutions were used as purchased (stock PS NPs) or (B) pre-dialyzed for 48 hours to remove all labile dye (pre-dialyzed PS NPs). Normalization was performed based on the fluorescence intensity of the YG-PS NPs or free dye measured when diluted directly into the buffer (without dialysis). |
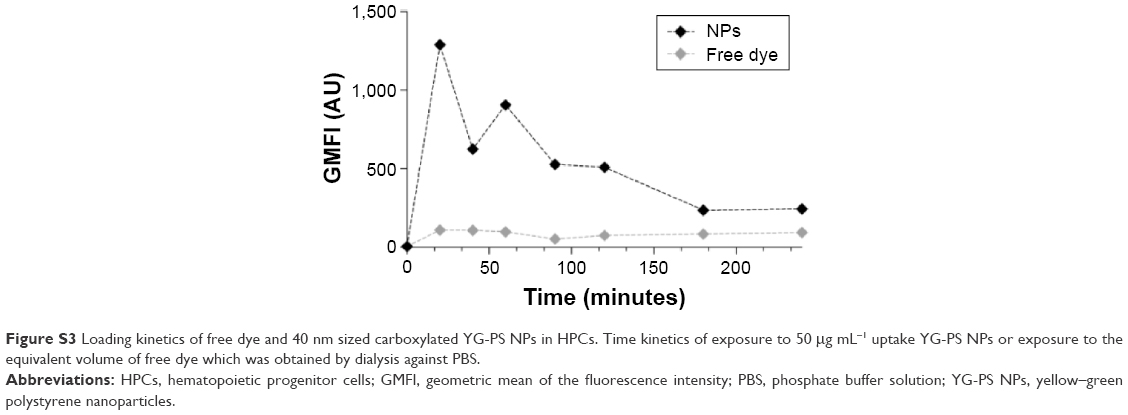 | Figure S3 Loading kinetics of free dye and 40 nm sized carboxylated YG-PS NPs in HPCs. Time kinetics of exposure to 50 μg mL−1 uptake YG-PS NPs or exposure to the equivalent volume of free dye which was obtained by dialysis against PBS. |
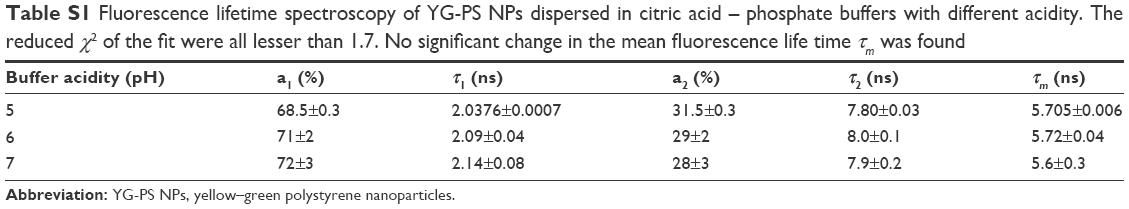 | Table S1 Fluorescence lifetime spectroscopy of YG-PS NPs dispersed in citric acid – phosphate buffers with different acidity. The reduced χ2 of the fit were all lesser than 1.7. No significant change in the mean fluorescence life time τm was found |
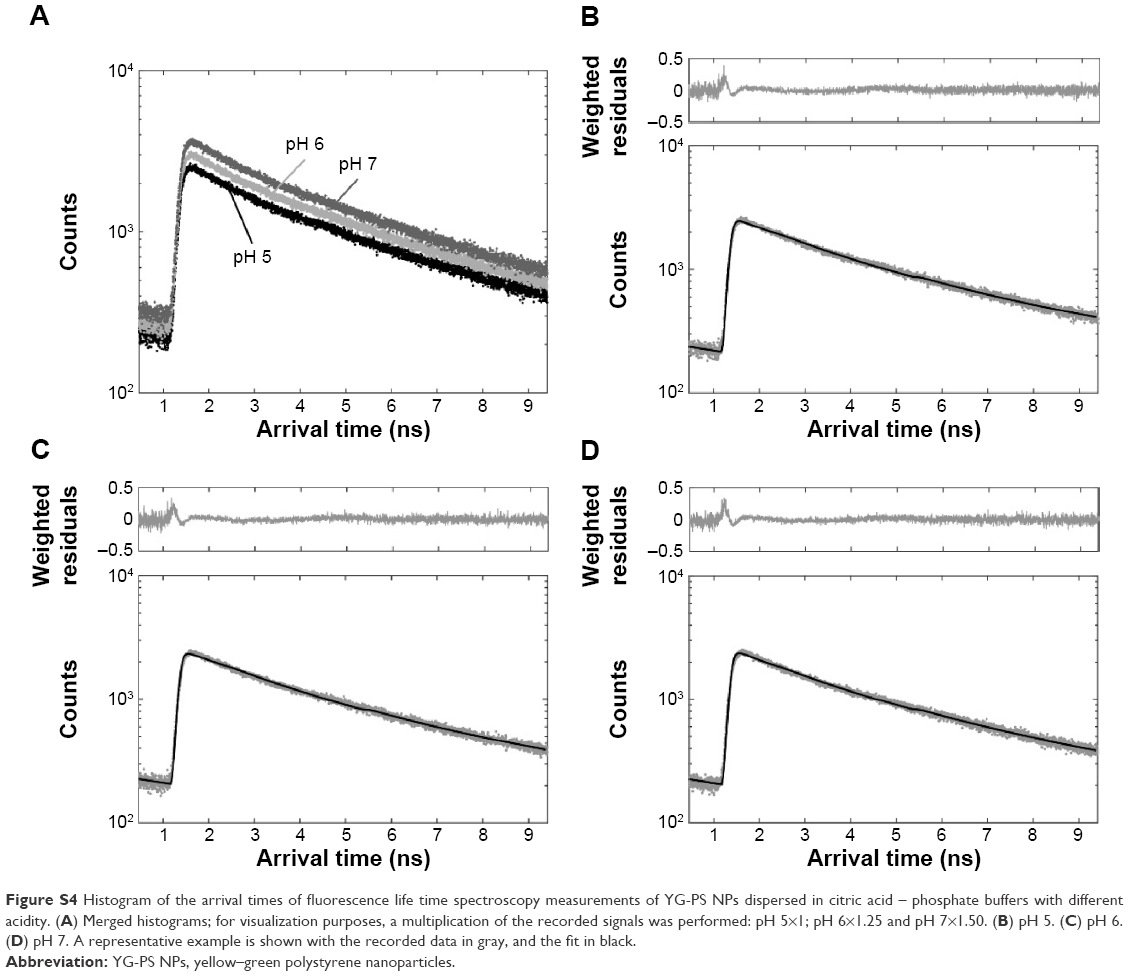 | Figure S4 Histogram of the arrival times of fluorescence life time spectroscopy measurements of YG-PS NPs dispersed in citric acid – phosphate buffers with different acidity. (A) Merged histograms; for visualization purposes, a multiplication of the recorded signals was performed: pH 5×1; pH 6×1.25 and pH 7×1.50. (B) pH 5. (C) pH 6. (D) pH 7. A representative example is shown with the recorded data in gray, and the fit in black. |
 © 2017 The Author(s). This work is published and licensed by Dove Medical Press Limited. The
full terms of this license are available at https://www.dovepress.com/terms
and incorporate the Creative Commons Attribution
- Non Commercial (unported, 3.0) License.
By accessing the work you hereby accept the Terms. Non-commercial uses of the work are permitted
without any further permission from Dove Medical Press Limited, provided the work is properly
attributed. For permission for commercial use of this work, please see paragraphs 4.2 and 5 of our Terms.
© 2017 The Author(s). This work is published and licensed by Dove Medical Press Limited. The
full terms of this license are available at https://www.dovepress.com/terms
and incorporate the Creative Commons Attribution
- Non Commercial (unported, 3.0) License.
By accessing the work you hereby accept the Terms. Non-commercial uses of the work are permitted
without any further permission from Dove Medical Press Limited, provided the work is properly
attributed. For permission for commercial use of this work, please see paragraphs 4.2 and 5 of our Terms.