Back to Archived Journals » Energy and Emission Control Technologies » Volume 4
Traffic management strategies for emissions reduction: recent experience in London
Authors Beevers S, Carslaw D, Dajnak D, Stewart G, Williams M, Fussell J, Kelly F
Received 10 April 2015
Accepted for publication 12 May 2015
Published 28 April 2016 Volume 2016:4 Pages 27—39
DOI https://doi.org/10.2147/EECT.S69858
Checked for plagiarism Yes
Review by Single anonymous peer review
Peer reviewer comments 3
Editor who approved publication: Dr Adolfo Perujo
Sean David Beevers, David Carlin Carslaw, David Dajnak, Gregor B Stewart, Martin Lloyd Williams, Julia C Fussell, Frank James Kelly
MRC-PHE Centre for Environment and Health, Facility of Life Sciences and Medicine, King’s College, London, UK
Abstract: Air pollution strategies in London over the last 12 years have centered upon the congestion charging scheme, and at the same time, the fitting of particle traps to London buses, the low emissions zone (LEZ), and the Mayor’s Air Quality Strategy (MAQS). The 2003 congestion charging scheme achieved much of the scheme’s aims, but the demand to travel and the need for road space eroded the initial benefits. While fitting particle traps on buses was predicted to reduce particulate matter (PM) exhaust emissions, the introduction of phases 1 and 2 of the LEZ and MAQS strategies were both predicted to have modest emission impacts. Reliance on new Euro-standard vehicles to reduce emissions, and as a way of designing LEZs, has been problematic, with oxides of nitrogen (NOx) and nitrogen dioxide (NO2) emissions from diesel vehicles reducing less than predicted. Consequently, the UK has not met annual NO2 European Union (EU) limit values, necessitating a time extension application. A mismatch between PM10 ambient trends and emissions has also been reported, with the long-term performance of PM particle filters remaining an important question. Assessing London’s traffic management schemes has relied upon emission inventories and dispersion models, and to date, there has been no confirmation of the effects of the schemes using ambient data, a challenging and important area of research. However, measurements of ambient NOx, NO2, ozone, PM species, and roadside vehicle emissions have all contributed to the improvement of road traffic emission inventories in London, and it remains important to undertake ambient monitoring to assess future schemes. Looking forward, the real-world emissions performance of Euro 6/VI vehicles, selective catalytic reduction, and the ultra-low emissions zone in London will play a critical role in meeting EU limit values for ambient NO2, and in light of the increasing health evidence of urban air pollution, policy makers should aim to reduce PM concentrations toward health-based World Health Organization guideline values.
Keywords: congestion charging, low emissions zone, traffic management, NOx, PM10 vehicle emissions
Introduction
At the beginning of the 20th Century, only 13% of the global population lived in urban areas and 16 cities had a population of 1 million people, while in 2006, almost 400 cities (70% in less developed countries) contained more than 1 million residents.1 Between 2013 and 2050, while the population of developed regions is forecast to remain largely unchanged, the 49 least developed countries are projected to double in size, with 6.3 billion people predicted to be living in urban areas.2 In India and the People’s Republic of China, rapid urbanization has resulted in a rise in traffic congestion, noise and pollution, as well as traffic-related fatalities and injuries.3,4 The policies proposed to counter these effects include the design of new roads to accommodate buses, cyclists and pedestrians, improved traffic management and public transport services, a slowdown in roadway investment and restrictions to motor vehicle use in congested city centres.In London – a major global city that is forecast to grow by 13% between 2012 and 20225 – a number of these policies have been enacted over the last 12 years. Experiences of the schemes themselves as well as the challenges involved in monitoring the impacts are discussed in this paper in the hope that such knowledge should prove of value to interested parties considering such action in other cities.
London air quality policy background
The Greater London Authority (GLA) comprises the Mayor of London and the London Assembly and is accountable for the strategic governance of the city. The GLA Act 19996 legislated the Mayor of London to set out and maintain eight overarching strategies, including those with a focus on air quality and transport. The 2001 Mayor’s Transport Strategy described a lack of investment in transport infrastructure that was harming business efficiency as well as the City’s competitive position in the world in the face of a worsening quality of life for Londoners.7 It reported that traffic congestion was approaching gridlock, polluting the city’s air, and that the public and businesses regularly identified congestion and under-resourced public transport as London’s most pressing problems. A significant aim was thus to reduce traffic congestion by increasing the overall capacity of London’s underground and rail systems by up to 50% by 2016 and bus capacity by 40% across London by 2011. A number of transport and air quality strategies have since been produced, recognizing the role of transport in environmental quality and incorporating four key initiatives: congestion charging, the London low emissions zone (LEZ) (phases 1 and 2), the Mayor’s Air Quality Strategy (MAQS) 2010, and the proposed London ultra-low emissions zone (ULEZ). Much of the literature describing the impacts of London’s air quality and traffic management schemes originate from transport for London (TfL) and GLA reports. In turn, the results contained in these reports are based upon the well-established emissions and air quality model of King’s College London.8
Meeting air quality standards in London
Since 2003, exceedance of the annual mean nitrogen dioxide (NO2) European Union (EU) limit value (40 μg m−3 by 2010) in London has occurred at both urban background locations (defined as sites that are unaffected by major local sources) and roadside sites (defined as being between 1 and 5 m from the kerb of a road). In recent years, exceedances at background locations have diminished, but they remain in central London and close to major roads. The PM10 (particulate matter less than 10 μm in diameter) annual mean EU limit value (40 μg m−3 by 2005) has not been exceeded at urban background locations since 2003, although exceedances at roadside sites have been common. That the annual mean NO2 limit value is harder to achieve than the hourly limit (<18 hours >200 μg m−3 by 2010), while the daily PM10 limit values (<35 daily exceedances of 50 μg m−3 by 2005) are more difficult to adhere to than the annual limit, is exemplified by measurements at the Marylebone Road central London kerbside site (defined as within 1 m of the kerb of a road). Between 2004 and 2014, despite PM10 concentrations approaching the 40 μg m−3 limit value, Marylebone Road has only exceeded this on one occasion, in 2011. In contrast during the same period, the daily PM limit value has been exceeded in all but 2 of the years (2013 and 2014). The annual mean NO2 limit value has been breached at this site every year between 2004 and 2014, some years by greater than twice the limit. The hourly limit value has also been breached every year except 2014 (provisional data), with some years having >800 hours of exceedances.
Between 2003 and the present day, important changes have occurred within the UK vehicle fleets, driven by UK government policy to promote the use of diesel vehicles through taxing CO2 emissions,9 new cleaner vehicles entering the fleet, and, in London from 2001 to 2005, by TfL fitting London buses, representing 80% of the total bus vehicle-kilometers, with particle traps. The London atmospheric emissions inventory10 results show that vehicle NOx emissions are predicted to reduce by 70% between 2003 and 2020, or 4% per annum, and PM10 exhaust by 88%, or 5% per annum (Table 1), although by including nonexhaust PM10 sources (tire wear and brake wear), this reduces to 29% over the same period or 2% per annum. The diesel/petrol split of emission changes from 62%/38% for NOx in 2003 to 92%/8% in 2020 and from 65%/36% for PM10 (exhaust + tire wear + brake wear) in 2003 to 71%/29% in 2020 (Table 1). Vehicles are predicted to represent 57% of all NOx emission sources in London in 2003, falling to 35% in 2020, and are predicted to represent 71% of PM10 sources in both 2003 and 2020.
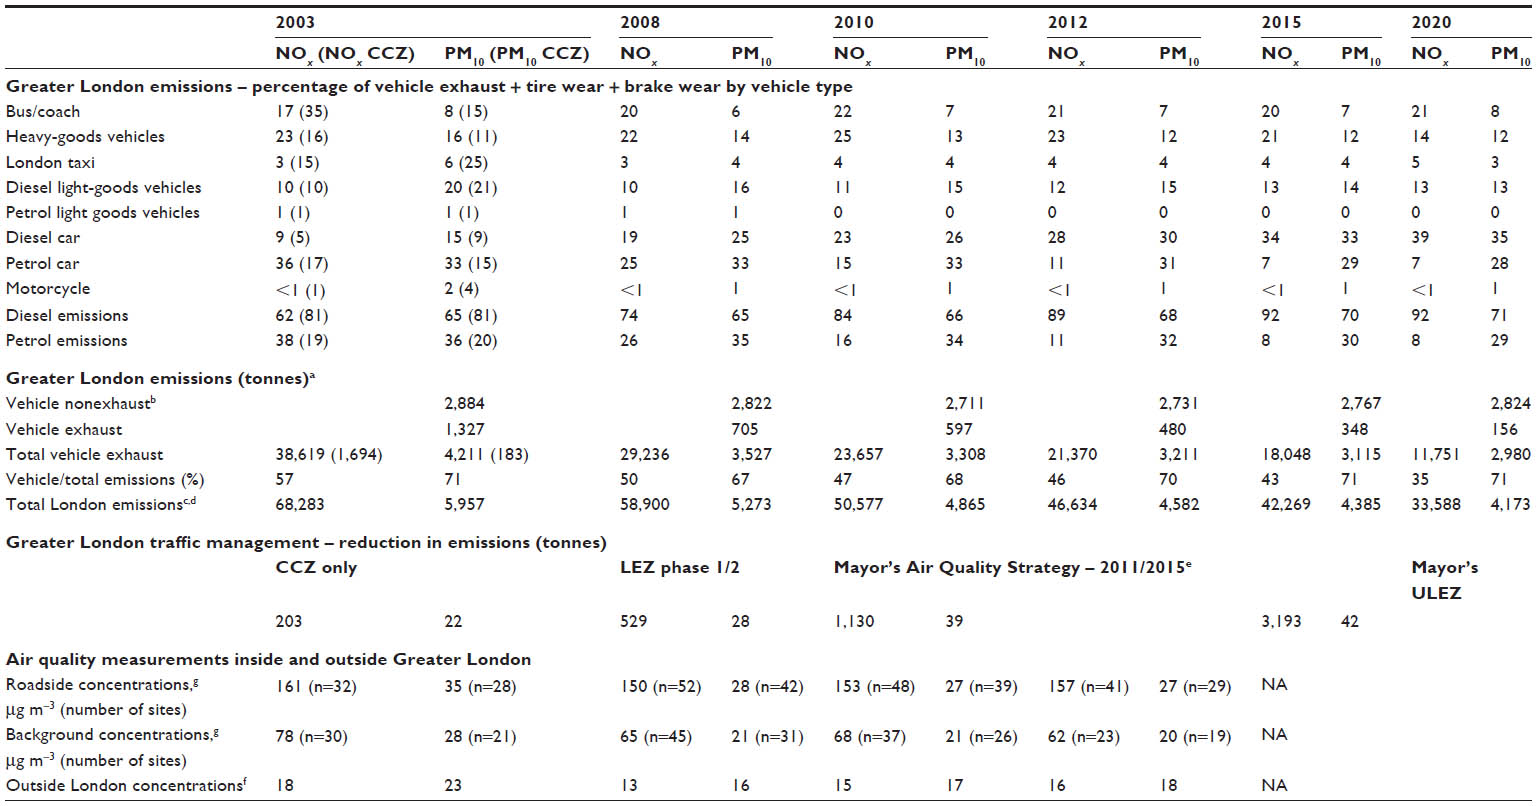 | Table 1 London emissions and air quality between 2003 and 2020 |
Finally, from measurements of roadside/kerbside, background, and rural sites within and outside London (Table 1) in 2003/2008/2010/2012, on average, ~23% of NOx concentrations at background sites is from outside London, but for PM10 this is 82%. At roadside/kerbside sites, 10% of NOx is from outside London and 63% of PM10. These results demonstrate that NOx can be controlled through reducing London emissions, while controlling PM10 is more difficult.
Air quality and health
The World Health Organization (WHO) reported that “globally 3.7 million deaths were attributable to ambient air pollution (AAP) in 2012”.11 Approximately 88% of these deaths occur in low- and middle-income (LMI) countries, which represent 82% of the world population. Deaths also occurred in large numbers in high-income countries of Europe (280,000), the Americas (94,000), the Western Pacific (67,000), and the Eastern Mediterranean (14,000).11 The WHO has also recently reviewed evidence of associations between air pollution and ill health, through the REVIHAAP (review of evidence on health aspects of air pollution) and HRAPIE (health risks of air pollution in Europe) projects,12,13 and as a result, evidence for an effect of NO2 and PM2.5 on mortality as well as a broad array of disease outcomes has been strengthened. In London, the fraction of all-cause adult mortality attributable to anthropogenic particulate air pollution (measured as fine particulate matter, PM2.5) is 6.6%.14
Congestion charging
Congestion schemes worldwide
In 1975, Singapore introduced the area licensing scheme – the first congestion charging system in a city and one that subsequently switched to an electronic road pricing system in 1998.15 More recent examples include the City of Stockholm scheme,16,17 Milan’s zonal payment initiative was introduced at the beginning of 200818 and others were introduced in Oslo in 1990 and in Bergen in 1986.19 There are many other road user charging systems in operation around the world, including area wide schemes and motorway tolling, primarily introduced with dual aims of raising revenue for road building/maintenance and reducing congestion. Relatively few schemes cite the environment specifically, although the aims of the Swiss scheme include a switch from heavy-goods vehicle (HGV) travel to rail to protect the Alpine region and include both a distance, weight, and Euro class based charge. A number of other cities have considered and rejected congestion charging, including Cambridge, Bristol, Edinburgh, and Manchester in the UK and in the US, New York came close to becoming the first major American city to introduce a traffic congestion charge.20
The London congestion charging scheme
In 2002, due to widespread public concern over the health effects of air pollution, the Mayor of London launched his air quality strategy entitled Cleaning London’s Air.21 This set out policies and proposals to move toward a point where pollution no longer posed a significant risk to human health. A key part of this strategy was the congestion charging scheme (CCS) – considered to be good option based on its effectiveness at reducing traffic levels and public acceptability so long as the proceeds were used to improve public transport, a requirement for the first 10 years.
The implementation of the CCS began in February 2003, with a standard charge of £5 per vehicle per day, operating during the hours of 7.00 am and 6.30 pm, Monday to Friday, and covering an area bounded by the inner ring road (IRR) (Figure 1). A 90% discount was applied for residents within the charging zone, some concessions for regular users and fleet operators and no charge for a number of vehicle classes: those used by disabled people, motorcycles and mopeds, emergency vehicles, public service vehicles with more than 17 seats, London licensed taxis, and certain “environmentally friendly” vehicles. In February 2007, the original central London congestion charging zone (CCZ) was extended westward, although following a public consultation, in January 2011, this was removed so that now the original zone remains, with an area of ~22 km2 (1.4% of London). In July 2005, the basic charge was raised from £5 to £8 per day and now varies between £10.50 and £14, depending upon when and how it is paid.
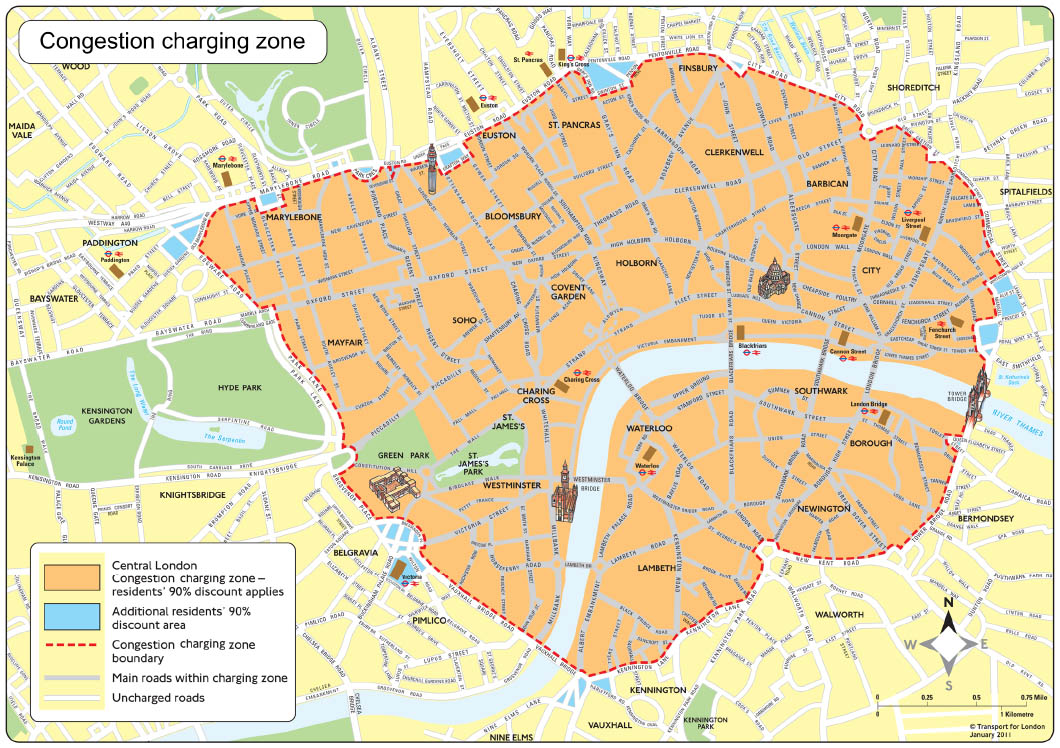 | Figure 1 The London congestion charging zone (CCZ) – not including the western extension. |
When the scheme was introduced, the primary objectives were to achieve a reduction between 10% and 15% in traffic circulating within the CCZ (measured as vehicle-kilometers traveled by all vehicles with four or more wheels), and a reduction in traffic growth in inner London (the London boroughs adjoining the CCZ) to zero. Congestion charging was also expected to deliver a reduction of traffic growth in outer London by a third, an increase in traffic on the IRR, a reduction in traffic on the radial approaches to the CCZ, and changes to the pattern of trip-making to be outside of charging hours.
Congestion charging impacts
Congestion
The initial effect of the scheme in the CCZ22,23 was a 30% reduction in congestion in 2003/2004 or a delay of 1.6 min km−1, compared with precharging conditions in 2002, where delays were typically 2.3 min km−1. Congestion is defined by TfL as “excess delay” (min km−1) over and above that which would be experienced under “uncongested” conditions during the early hours of the morning. Radial routes approaching the charging zone in inner London also demonstrated reduced congestion during 2003, although by 2004, conditions were more comparable to 2002. More generally, congestion in inner London was stable between 2002, 2003, and 2004.23 The impact to vehicle operation of changes in congestion was reported as reduced queuing times at junctions rather than increases in driving speeds and also reduced congestion during the “shoulder” periods (morning and evening) associated with reduced traffic flow.
During 2005, changes to network capacity to meet other transport priorities (including improved safety and increased priority for buses, taxis, and cyclists) began to affect the initial benefits. As a consequence, congestion increased in 2005 to 1.7 min km−1, more than the low of 1.6 min km−1 immediately after the introduction of the zone, but still lower than the figure of 2.3 min km−1 in 2002.24 On the IRR and main radial routes approaching the CCZ, conditions in 2005 were similar to 2004, while main roads in inner London showed increases in congestion with average delays of 1.5 min km−1 compared to 1.3 min km−1 in 2002. During 2006, there was an increase in congestion associated with a rise in road works, combined with a gradual longer-term trend of increased congestion across London, and was only 8% lower than in 2002.25 In the original central London charging zone, levels of congestion intensified and, during charging hours in 2007, were identical to those in 2002. By 2008, the western extension to the CCZ exhibited congestion values that were similar to pre-extension levels, despite having lower traffic levels.26 TfL concluded that since traffic volumes were reduced in the western extension, the increased congestion reflected temporary local changes such as road works, or more permanent local changes such as major developments.
Traffic speeds
The introduction of the CCS substantially increased traffic speeds during charging hours from 14 km h−1 in 2002 to ~17 km h−1 in 2003, levels last seen in the early 1980s. Since 2003, however, average observed charging-hour speeds have progressively fallen back, to approximately 16 km h−1 in 2005 and 15 km h−1 in 2006.25
Vehicle-kilometers
The initial effects of the scheme was to reduce the vehicle-kilometers traveled within the zone by 15%, based upon vehicles with four or more wheels and during charging hours only.22 Changes to travel patterns (eg, traffic entering the CCZ), arising from the scheme, occurred very quickly in 2003; however, changes since have tended to reflect traffic trends elsewhere in London.25 In contrast to the within-zone findings, traffic on the IRR remained similar to levels before the introduction of charging. Overall, the effect of the CCS was to reduce the number of potentially chargeable vehicles (ie, cars, vans, and lorries) entering the CCZ during charging hours, while nonchargeable vehicles, such as licensed taxis, buses, and two-wheelers all increased.25 While in operation, traffic entering the western extension zone during charging hours in 2007 (vehicles with four or more wheels) decreased by 14%,26 and traffic circulating inside the extension zone decreased by approximately 10%. Traffic on the boundary route around the western extension showed a small increase of up to 4%.
Emission impacts
An analysis of CCS emission impacts,27 using methods of the London atmospheric emissions inventory, showed that between 2002 and 2003, total NOx emissions in the charging zone reduced by 12.0% and increased on the IRR by 1.5%. PM10 emissions fell by 11.9% in the charging zone and by 1.4% on the IRR, consistent with emission reductions reported by TfL22,23 (2004/2005). CO2 emissions were predicted to reduce by 19.5%.27 Furthermore, a significant reduction in the emissions of NOx and PM10 were associated with increases in vehicle speed, with slower speeds having a disproportionate effect, and this was as important in reducing emissions as changes in vehicle numbers. A later analysis projected somewhat larger average reductions (approximately 20%) in NOx and PM10 emissions,8 which may partly be explained by the fact that the modeling compared the 2 years before and 2 years after the introduction of the CCS. Further detailed investigation of network average vehicle speed in both central and inner London28 showed that the speed between pre- and post-CCS periods had increased on average by 2.1 km h−1 and at a time that agreed well with the introduction of the CCS on February 17, 2003. TfL26 reported modest benefits inside the western extension zone, with reductions in NOx, PM10, and CO2 emissions of 2.5%, 4.2%, and 6.5%, respectively.
Air pollution impacts
The projected changes in concentrations of NOx, NO2, and PM10 were small,8 amounting to a net decline of 3.3 μg m−3 in the annual average NOx concentration and a decline of 0.8 μg m−3 in PM10. NO2 was projected to increase slightly, by 0.6 μg m−3 on average, and this was attributed to higher NO2 emissions associated with the introduction of particle traps on diesel buses as part of TfL’s improvements in the public transport system. The modeling also suggested that contributions from tire and brake wear might be important components of vehicle emissions, a notable observation owing to the unregulated nature of these sources.
Low Emissions Zones
LEZs in Europe
London is not alone in deploying LEZs to tackle air quality problems. Many other countries across Europe have introduced similar initiatives, namely Germany, Italy, the Netherlands, Sweden, Switzerland, the Czech Republic, and Denmark, with some examples focused on specific roads, including Autobahns in Austria and the Mont Blanc tunnel in France. In common with London, the majority of European LEZs focus their efforts on HGVs, buses, and vans. Notable exceptions to this are the LEZs of Italy and Germany, where all vehicles are included. A comprehensive description of European LEZs is given in http://urbanaccessregulations.eu/overview-of-lezs.
The London LEZ
In July 2003, a feasibility study was undertaken on possible LEZs in London29 followed by an evaluation.30 The Deloitte review included consultation with UK vehicle operators, London Boroughs, the UK Department for Environment Food and Rural Affairs (DEFRA), and the UK Department for Transport. In addition, TfL undertook a consultation,31 and thereafter the Mayor of London launched the London LEZ on February 4, 2008, with the aim of discouraging the drivers of the most polluting vehicles from entering Greater London by levying a daily charge of £100–£200 for non-LEZ compliant vehicles. The zone boundary is approximately the whole of Greater London (Figure 2) and within the LEZ, automatic number plate recognition (ANPR) cameras read the number plates of LEZ target vehicles and check them for compliance using a database held by TfL. The LEZ operates 24 h day−1, 365 days of the year.
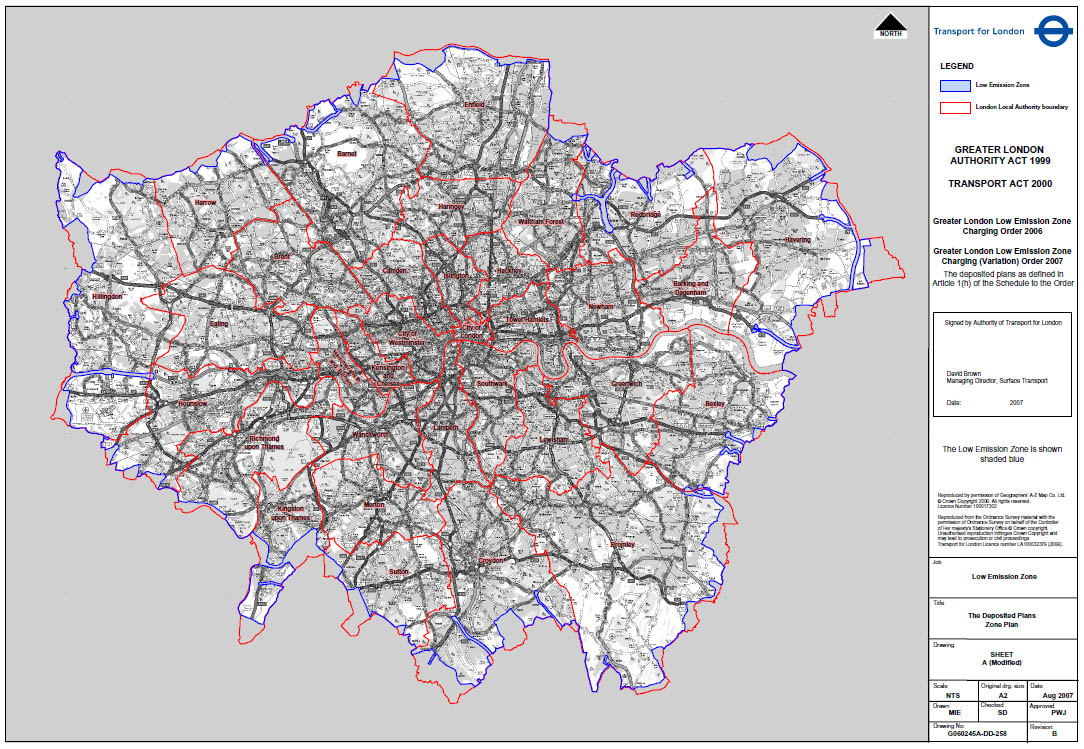 | Figure 2 The Greater London low-emission zone. |
The LEZ was designed to be introduced as a phased system; the first phase, introduced in February 2008, required HGVs with a weight greater than 12 tonnes to comply with Euro III emission standards; the second phase, introduced in July 2008, required medium goods vehicles (between 3.5 and 12 tonnes), buses, and coaches to meet Euro III emission standards. Pre-Euro III vehicles could comply with the LEZ by retrofitting end of pipe technology, eg, a particle trap, and as a result, obtain a reduced pollution certificate through a UK Department for Transport run scheme. The Mayor of London delayed the introduction of LEZ phase 3 until January 2012, and alongside the introduction of LEZ phase 4 became part of the MAQS.32 Phase 3 required light-goods vehicles (LGVs) and minibuses to comply with Euro III emission standards and phase 4 required all HGVs, buses, and coaches to comply with Euro IV emission standards.
The London LEZ impacts
Emission impacts of phases 1 and 2
Within months of the implementation of the LEZ, 98% of HGVs (regulated by phase 1 of the scheme) and 96% of medium goods vehicles (regulated by phase 2) complied with the scheme.33 The LEZ saved 28 tonnes of PM10 (3.6% of road traffic exhaust emissions), 26 tonnes of PM2.5 (3.7% of road traffic exhaust emissions), and 529 tonnes of NOx (2% of total road traffic exhaust emissions) in 2008. These values exclude the reductions in particulate emissions from the TfL bus fleet that complied with the LEZ well ahead of the implementation date. Tailpipe exhaust emissions of PM10 from TfL buses were estimated to have fallen by approximately 90% since 2000, despite a 32% increase in vehicle-kilometers operated.33
Air quality impacts of phases 1 and 2
The LEZ air pollution impacts were predicted to show a very small reduction of 0.03 μg m−3 of PM10 across the whole of Greater London, with reductions close to major roads of up to 0.5 μg m−3 for PM10.33 However, these results at the roadside were still important since the daily mean EU limit value was predicted to be sensitive to small changes in average PM10 concentrations, and achieving the standard was of direct relevance to the UK’s application to the European Commission for a compliance extension in 2011.
Phases 1 and 2 of the scheme were estimated to have reduced average concentrations of NO2 across London by 0.12 μg m−3, with peak reductions of up to 0.16 μg m−3.33 Such small changes in PM10 and NO2 are not detectible in ambient measurements. Of significance, for the first time, TfL gave recognition that particle traps could result in greater direct emissions of NO2 from the vehicle exhaust, as well as acknowledging the need for much greater emission reductions in London with future LEZ schemes targeting NO2 concentrations.33
The MAQS 2010
Following the introduction of the first two phases of the LEZ, the MAQS 201032 set out further policies to improve London’s air quality (Table 2). The MAQS was important since it also formed part of an air quality plan used in the UK extension applications (June 2011 for PM10 and January 2015 for NO2), following failure to comply with EU limit values by the original dates.
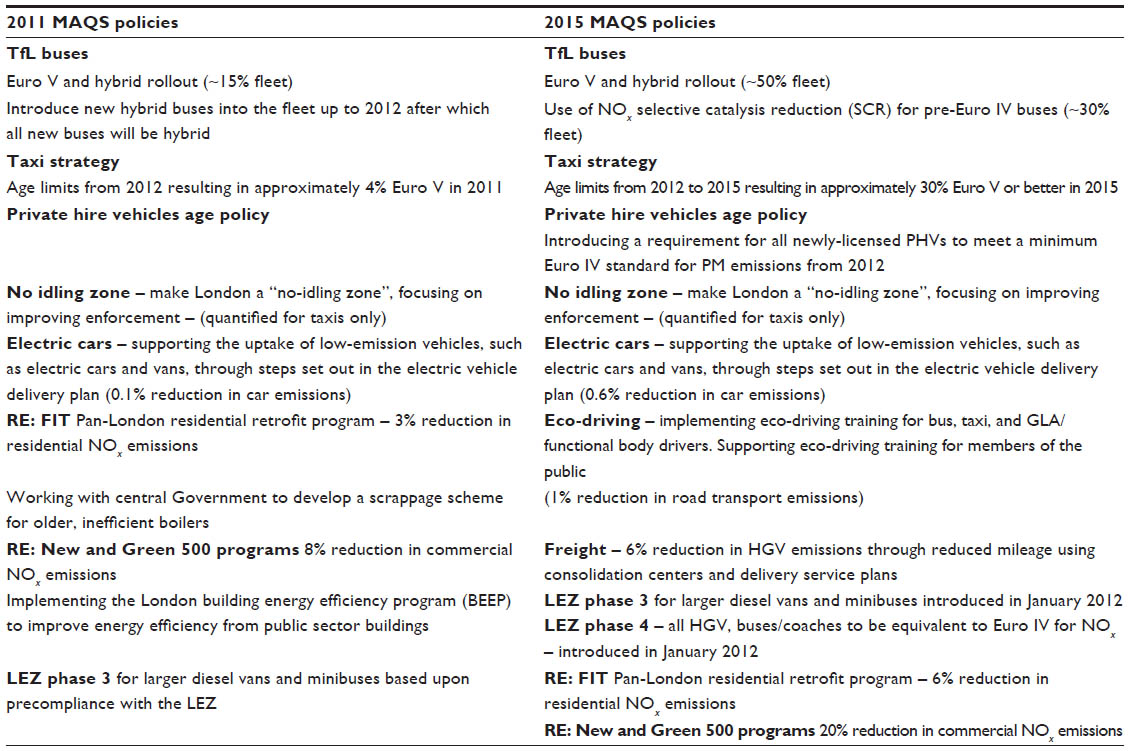 | Table 2 Policies modeled for the MAQS |
The MAQS impacts
Emission impacts
In 2011, the MAQS strategy in Greater London was predicted to reduce NOx emissions by a total of 1,130 tonnes (2% of total London emissions), reducing vehicle emissions by 468 tonnes and domestic and commercial gas combustion by 662 tonnes (Table 3). The 2015 predictions show a share of the NOx emissions reductions between vehicles (1,917 tonnes) and gas combustion sources (1,276 tonnes), representing ~8% of total London emissions. Buses and HGV’s dominated the vehicle emission reductions in 2015, while taxis, cars, and LGVs dominated PM10 emission reductions in 2011 and 2015.
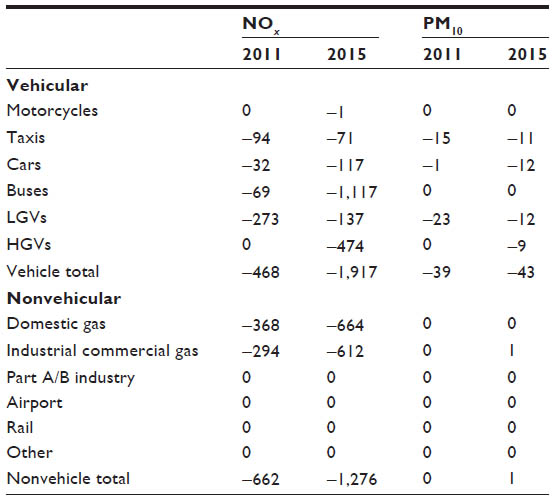 | Table 3 Greater London emissions changes (tonnes/annum) due to the MAQS 2010 |
Air quality impacts
Prior to the MAQS strategy, most areas of Greater London were already in compliance with the annual mean EU limit values for PM10, and all areas were predicted to be compliant in 2011.32 Concern existed however over the small number of areas in London that were still at risk of exceeding the EU limit for daily average PM10, with the GLA concluding that the benefits of the MAQS policies would be to provide greater confidence that the PM10 daily limit value would be met in 2011.
The MAQS strategy32 cited evidence that “local measures” deployed in other European cities could reduce concentrations of PM10 at a local level by approximately 10%–20%, equivalent to reducing the number of UK exceedances of the daily limit value by approximately 6 days and that by adding heavier LGVs and minibuses to the LEZ, combined with measures in MAQS to reduce emissions from taxis and buses, an additional 4–6 exceedance days could be removed. At this time, the impact of such “local measures” was untested in London, although later, Barratt et al34 showed that one such action, namely the use of dust suppressants on roads, while benefiting locations close to industrial and construction sites did not prove to be effective on major roads.
Air quality modeling indicated that the MAQS, together with natural fleet turnover, would reduce the number of roads in London exceeding the EU annual average NO2 limit value in 2015 by between 10% and 15%. Predictions showed reductions in NO2 concentrations at roadside locations outside central London of approximately 4 μg m−3, with greater reductions of approximately 10 μg m−3 on average at some locations in central London. However, the MAQS strategy conceded that at some locations, including kerbsides closest to major roads in central London, limit values would still be exceeded in 2015, to the extent that a further reduction in NOx emissions of 40%–60% would be needed to meet them. Furthermore in inner London, reductions of between 10% and 30% would be required on some major roads to meet limit values for NO2.
The ULEZ
In recognition of the need for further action to meet NO2 limit values, TfL and the GLA are currently assessing a range of policy options for an ULEZ.35 Alongside the GLA report,35 and other as yet unpublished work evaluating a range of ULEZ options such as those in Table 4, a public consultation exercise has been undertaken. A final decision is pending with regard to specific requirements on vehicles operating within the ULEZ area, while the location is likely to mirror the CCZ (Figure 1).
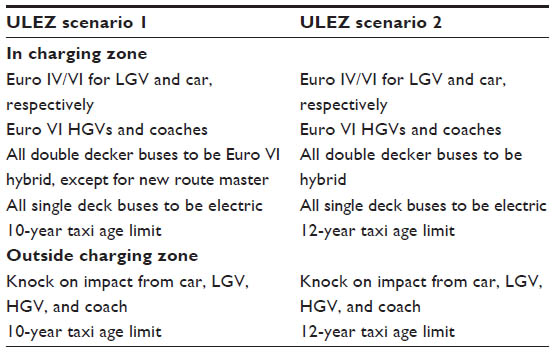 | Table 4 Summary of possible ULEZ scenario options |
Monitoring impacts of the traffic management schemes
It remains difficult to clearly establish the impacts of any traffic management scheme using ambient monitoring data, due to a number of factors. For example, scheme emission impacts are a relatively small proportion of total emissions and occur alongside those changes relating to new, cleaner vehicles entering the fleet. In the case of the CCS, the small geographical area meant that any benefits were masked by changes in the surrounding urban area, and added to this, ambient monitoring was lacking. In any ambient data analysis, account also needs to be taken of the contribution from outside London, which is often represented by a small number of rural sites that in turn change over time due to European and UK wide policy. Furthermore, while schemes such as congestion charging have a clear start date, LEZs do not, as vehicle operators do not wait until the first day of the scheme to change their vehicles, and this results in a period of precompliance some months in advance. One of the most challenging areas however is the influence of meteorology on ambient concentrations, which can confound time series trend analysis. It is not surprising therefore that as a consequence of these issues, there is almost complete reliance on emission inventories and dispersion models to assess scheme impacts.
Ambient pollutant measurement assessment of London traffic management schemes
Added to the difficulties in establishing scheme impacts using ambient measurements, the London CCS lacked before/after pollutant measurements. Reliance was also placed on existing monitoring in London, which while being comprehensive across the city, has very few sites in and around the CCZ. Despite this, Atkinson et al36 investigated the potential impact of the CCS on NOx, nitric oxide, NO2, PM10, carbon monoxide, and ozone measured at roadside and background monitoring sites across Greater London. Temporal changes in pollution concentrations within the CCZ were compared to changes at monitors unaffected by the scheme as well as for weekends when the scheme was not operating. However, the single roadside monitor within the CCZ meant that it was not possible to identify any changes in pollution concentrations associated with the scheme. An alternative and potentially important method is “meteorological normalization”, which shows promise in extracting emissions trends from ambient data by accounting for the prevailing meteorology.37 Interpretation of such data when applied to real-world problems such as a traffic management schemes does however remain difficult.
Because of difficulties in interpreting ambient data, other more easily measured impacts have been reported, such as vehicle flows, speed, and congestion effects of the CCS. In addition, for the LEZ, the use of ANPR cameras has helped to establish the level of compliance within the London vehicle fleet. Furthermore, recognition by TfL and the GLA of the importance of ambient measurements in assessing the impacts of the LEZ has led to a number of the London measurement sites being upgraded and new ones developed to capture scheme effects.38 It should be noted however, despite using measurements of black carbon, traffic counts, and ANPR data to capture exhaust specific changes of the LEZ scheme, to date no research on the effect of the LEZ or MAQS on ambient measurements has been published.
Ambient data and emissions inventory development
There are important uses of ambient measurements beyond scheme assessments, and by combining ambient data research with emission inventories and dispersion modeling, impacts modeling methods can improve. In London, this has not only led to improvements in the understanding of NOx and NO2 but also to nonexhaust PM emissions.
For example, the dieselization of the vehicle fleet in London and widespread use of particle traps on buses have prompted a number of important research initiatives and ultimately benefited London emissions inventory modeling and the assessment of scheme impacts. First, in London, there is now a considerable body of research on the estimates of primary NO2 emitted directly from vehicle exhausts. Carslaw39 used hourly modeling and a simple constrained chemical model to show that the NO2/NOx emission ratios from road traffic have increased markedly from a mean of approximately 5–6 vol% in 1997 (and assumed within the London emissions inventory [LAEI] until 2008) to approximately 17 vol% in 2003, an important step in correctly predicting NO2 compliance with EU limit values close to roads. This work was extended to a range of London roadside sites,40 and with other research led to the UK Air Quality Expert Group report on the subject.41 Crucial queries have been investigated, including the poor comparison of real-world emissions of NOx from diesel vehicles, with results from regulated vehicle emission tests,42 as well as the quantification of NOx and NO2 emissions from diesel vehicles using particle traps in urban areas, and more recently in the use of selective catalytic reduction.43,44
Furthermore, a comprehensive analysis of ambient trends in NOx and NO2 in the UK45 showed two characteristics: a decrease in concentration from approximately 1996 to 2002–2004, followed by a period of more stable concentrations from 2002/2004–2009. From 2004 to 2009, the annual percentage reduction in NOx and NO2 concentrations has been in the range of 1%–2% and 0.5%–1%, respectively, including London roadside sites. Beevers et al46 concluded that these trends were not as large as suggested by UK emission calculations, indicating that future UK and London emission inventories forecasts had been overly optimistic for NOx and NO2 emissions, especially from diesel vehicles. However, current London NOx emissions have shown good agreement with flux measurements taken on the BT Tower in central London47 – one of the few ways in which an emissions inventory can be evaluated directly – although with predicted trends in total NOx emissions of 4% per year between 2003 and 2010 and greater than 5% for vehicle only emissions (Table 1), these are still greater than suggested by ambient data trends and there remains a need for research in this area.
A similar contradiction between trends in ambient PM10 concentrations and emission inventories has also been reported,48 with the authors pointing out that although annual mean concentrations of PM10 in and around London reduced during the 1990s, concentrations then became stable, with small increases during 2001–2003. Harrison et al49 also questioned why PM10 concentrations stabilized during the early 2000s, and, furthermore, it has been shown that between 2003 and 2008, concentrations of PM10 at central/inner London roadside sites decreased by 4%–5% and at outer London sites by 13%–14%, both comparing poorly with a 25% reduction estimated for the London inventory.50
However, through the use of chemical tracer species to represent the total mass of tire, brake, and resuspended PM, Harrison et al51 concluded that nonexhaust sources of road transport PM10 and PM2.5 were of more importance to total road transport emissions than was previously thought. Subsequent inclusion of these results from ambient data within the London emissions inventory10 has increased total PM10 emissions by ~158%, tire wear emissions by ~9%, and brake wear emissions by ~262%, relative to previous estimates. Current versions of the LAEI show that trends in vehicle related PM10 to be 11% between 2003 and 2008 (Table 1), halving previous estimates, albeit still approximately twice than suggested by ambient data. Furthermore, vehicle PM exhaust emissions are predicted to reduce by 47% between 2003 and 2010 (Table 1), which is difficult to reconcile against ambient data. Essential, further work is currently underway to measure PM chemical tracers at a range of road types for application to emission modeling of PM10, with the understanding of exhaust PM, an important area for consideration, and with the long-term effectiveness of vehicle particle filters, an important question to answer.
Discussion
Lessons learned
There are a number of important lessons to be learned from traffic management in London. First, while emissions in urban areas represent the majority of NOx concentrations, this is not the case for PM, where the contribution from outside London is large. Consequently, expectations regarding the control of these two pollutants, using traffic management, are very different.
Reliance on vehicle technology and the use of Euro standards to define LEZs has proved to be problematic, since the emissions performance of diesel vehicles using oxidation catalysts and particle filters in the real world has not been as predicted by emissions modeling. In contrast, petrol vehicle emissions have been effectively controlled and represent a good policy solution for ambient NOx and PM.
It is extremely important to design a monitoring campaign around any traffic management scheme, with attention focused upon ambient measurements at roadside locations, such as NOx, NO2, and PM mass, but also PM components directly related to vehicle exhaust, such as black carbon. Wherever possible, meteorological data should be measured – although care needs to be taken regarding siting of instruments in large urban areas to avoid significant building effects. Measurements should also be made of traffic flow and speed, as well as the use of increasingly available ANPR data, to give detailed vehicle information, including the use of exhaust technology on specific vehicle types.
Our experience has shown that coupling ambient data analysis and emission/dispersion modeling can provide invaluable insight with which to improve the assessment of scheme impacts. But the confirmation of the impacts of a scheme using ambient data has yet to be made and remains an important research area.
Future air pollution issues in London
Since NOx and NO2 concentrations have not reduced as expected in London, UK, and Europe, due to dieselization of the vehicle fleet and the failure of these vehicles to replicate their test performance on the road, much depends upon the performance of Euro 6/VI vehicles in the coming years. Tests of the real-world emissions of these vehicles, and associated selective catalytic reduction systems, show promise but will require vigilance in the coming years. Further work is required to understand PM and NOx/NO2 emission trends, and while London meets EU limit values for PM10, it does not meet the health-based WHO guideline values and it remains to be seen if PM2.5 exposure reduction targets will be met, although emission forecasts suggest that they will. PM from transport sources (exhaust and nonexhaust) undoubtedly plays an important role in London, yet while it is accepted that these are difficult sources to characterize, they have not received the same scrutiny as NOx and NO2. Thus, more research on PM vehicle sources is required to improve our understanding of emission inventory forecasts, with the long-term performance of particle filters being an important yet unanswered question.
Acknowledgments
This work was supported by the United Kingdom’s cross-research council Environmental Exposures and Health Initiative (NE/I007806/1) and the National Institute for Health Research Health Protection Research Unit (NIHR HPRU) in Health Impact of Environmental Hazards at King’s College London in partnership with Public Health England (PHE). The views expressed are those of the authors and not necessarily those of the NHS, the NIHR, the Department of Health, or Public Health England.
Disclosure
The authors report no conflicts of interest in this work.
References
Cohen B. Urbanization in developing countries: current trends, future projections, and key challenges for sustainability. Technol Soc. 2006;28(1): 63–80. | |
United Nations. World Population Prospects: The 2012 Revision. New York, NY: United Nations; 2012. Available from: http://esa.un.org/wpp/. Accessed Mar 2015. | |
Pucher J, Korattyswaropam N, Mittal N, Ittyerah N. Urban transport crisis in India. Transp Pol. 2005;12(3):185–198. | |
Pucher J, Peng ZR, Mittal N, Zhu Y, Korattyswaropam N. Urban transport trends and policies in China and India: impacts of rapid economic growth. Transp Rev. 2007;27(4):379–410. | |
Office for National Statistics (ONS). 2012-Based Subnational Population. South Wales, UK: Office for National Statistics; 2011. Available from: http://www.ons.gov.uk/ons/dcp171778_363912.pdf. Accessed Mar 2015. | |
Greater London Authority (GLA). Greater London Authority Act 1999. London, UK: GLA; 1999. Available from: http://www.legislation.gov.uk/ukpga/1999/29/contents. Accessed Mar 2015. | |
Greater London Authority (GLA). The Mayors Transport Strategy. London, UK: GLA; 2000. Available from: http://legacy.london.gov.uk/mayor/strategies/transport/pdf/final_execsumm.pdf. Accessed Mar 2015. | |
Kelly FJ, Anderson HR, Armstrong B, et al. The Impact of the Congestion Charging Scheme on Air Quality in London. Boston, MA: Health Effects Institute; 2011. Available from: http://pubs.healtheffects.org/view.php?id1/4358. Accessed Mar 2015. | |
Mazzi EA, Dowlatabadi H. Air quality impacts of climate mitigation: UK policy and passenger vehicle choice. Environ Sci Technol. 2007;41:387–392. | |
Greater London Authority (GLA). London Atmospheric Emissions Inventory 2010. London, UK: GLA; 2012. Available from: http://data.london.gov.uk/dataset/london-atmospheric-emissions-inventory-2010. Accessed Mar 2015. | |
World Health Organization (WHO). Burden of Disease from Household Air Pollution for 2012. Geneva, Switzerland: WHO; 2014. Available from: http://www.who.int/phe/health_topics/outdoorair/databases/FINAL_HAP_AAP_BoD_24March2014.pdf?ua=1. Accessed Mar 2015. | |
World Health Organization (WHO). Review of Evidence on Health Aspects of Air Pollution – REVIHAAP Project: Final Technical Report. Geneva, Switzerland: WHO; 2013. Available from: http://www.euro.who.int/en/what-we-do/health-topics/environment-and-health/air-quality/publications/2013/review-of-evidence-on-health-aspects-of-air-pollution-revihaap-project-final-technical-report. Accessed Mar 2015. | |
World Health Organization (WHO). Health Risks of Air Pollution in Europe – HRAPIE Project Recommendations for Concentration–Response Functions for Cost–Benefit Analysis of Particulate Matter, Ozone and Nitrogen Dioxide. Geneva, Switzerland: WHO; 2014. Available from: http://www.euro.who.int/en/health-topics/environment-and-health/air-quality/publications/2013/health-risks-of-air-pollution-in-europe-hrapie-project-recommendations-for-concentrationresponse-functions-for-costbenefit-analysis-of-particulate-matter,-ozone-and-nitrogen-dioxide. Accessed Mar 2015. | |
Public Health England. Available from: http://www.phoutcomes.info/search/particulate#gid//pat/6/ati/101/page/3/par/E12000007/are/E09000002/iid/30101/age/230/sex/4. Accessed Mar 2015. | |
Goh M. Congestion management and electronic road pricing in Singapore. J Transp Geogr. 2002;10:29–38. | |
Johansson C, Burman L, Forsberg B. The effects of congestions tax on air quality and health. Atmos Environ. 2009;43:4843–4854. | |
Eliasson J. Lessons from the Stockholm congestion charging trial. Transp Pol. 2008;15:395–404. | |
Rotaris L, Danielis R, Marcucci E, Massiani J. The urban road pricing scheme to curb pollution in Milan, Italy: description, impacts and preliminary cost–benefit analysis assessment. Transp Res. 2010;44:359–375. | |
Lian JI. The Oslo and Bergen toll rings and road-building investment – effect on traffic development and congestion. J Transp Geogr. 2008;16: 174–181. | |
Schaller B. New York City’s congestion pricing experience and implications for road pricing acceptance in the United States. Transp Pol. 2010;17:266–273. | |
Greater London Authority (GLA). Cleaning London’s Air, The Mayors Air Quality Strategy. London, UK: GLA; 2002. Available from: http://legacy.london.gov.uk/mayor/strategies/air_quality/docs/full.pdf. Accessed Mar 2015. | |
Transport for London (TfL). Congestion Charging, Central London. Impacts Monitoring, Second Annual Report. Report prepared for the Mayor of London by Transport for London. London, UK: TfL; 2004. Available from: http://www.tfl.gov.uk/cdn/static/cms/documents/impacts-monitoring-report-2.pdf. Accessed Mar 2015. | |
Transport for London (TfL). Central London Congestion Charging, Impacts Monitoring, Third Annual Report. Report prepared for the Mayor of London by Transport for London. London, UK: TfL; 2005. Available from: http://www.tfl.gov.uk/cdn/static/cms/documents/central-london-congestion-charging-impacts-monitoring-third-annual-report.pdf. Accessed Mar 2015. | |
Transport for London (TfL). Central London Congestion Charging, Impacts Monitoring, Fourth Annual Report. Report prepared for the Mayor of London by Transport for London. London, UK: TfL; 2006. Available from: http://www.tfl.gov.uk/cdn/static/cms/documents/fourth-annual-report-overview.pdf. Accessed Mar 2015. | |
Transport for London (TfL). Central London Congestion Charging, Impacts Monitoring, Fifth Annual Report. Report prepared for the Mayor of London by Transport for London. London, UK: TfL; 2007. Available from: http://www.tfl.gov.uk/cdn/static/cms/documents/fifth-annual-impacts-monitoring-report-2007-07-07.pdf. Accessed Mar 2015. | |
Transport for London (TfL). Central London Congestion Charging, Impacts Monitoring, Sixth Annual Report. Report prepared for the Mayor of London by Transport for London. London, UK: TfL; 2008. Available from: https://www.tfl.gov.uk/cdn/static/cms/documents/central-london-congestion-charging-impacts-monitoring-sixth-annual-report.pdf. Accessed Mar 2015. | |
Beevers SD, Carslaw DC. The impact of congestion charging on vehicle emissions in London. Atmos Environ. 2005;39(1):1–5. | |
Beevers SD, Carslaw DC. The impact of congestion charging on vehicle speed and its implications for assessing vehicle emissions. Atmos Environ. 2005;39:6875–6884. | |
AEA Technology. The London Low Emission Zone Feasibility Study. Oxon, UK: AEA Technology; 2003. Available from: https://www.tfl.gov.uk/cdn/static/cms/documents/phase-2-feasibility-summary.pdf. Accessed Mar 2015. | |
Deloitte. LEZ Strategic Review Report. London, UK: Deloitte; 2004. Available from: https://www.tfl.gov.uk/cdn/static/cms/documents/3-lez-strategic-Review-Report-250205.pdf. Accessed Mar 2015. | |
Transport for London (TfL). Draft Transport and Air Quality Strategy Revisions: London Low Emission Zone Consultation with the London Assembly and the Greater London Authority Functional Bodies. London, UK: TfL; 2006. Available from: https://www.tfl.gov.uk/cdn/static/cms/documents/lez-mayors-report-0601.pdf. Accessed Mar 2015. | |
Greater London Authority (GLA). Cleaning London’s Air, The Mayors Air Quality Strategy. London, UK: GLA; 2010. Available from: http://www.london.gov.uk/priorities/environment/publications/mayors-air-quality-strategy. Accessed Mar 2015. | |
Transport for London (TfL). Travel in London Report 3. London, UK: TfL; 2010. Available from: http://www.tfl.gov.uk/cdn/static/cms/documents/travel-in-london-report-3.pdf. Accessed Mar 2015. | |
Barratt B, Carslaw DC, Fuller GW, Green D, Tremper A. Evaluation of the Impact of Dust Suppressant Application on Ambient PM10 Concentrations in London. Report produced for Transport for London. London, UK: King’s College London, Environmental Research Group; 2012. Available from: http://www.tfl.gov.uk/cdn/static/cms/documents/evaluation-dust-suppressants-pmconcentrations.pdf. Accessed Mar 2015. | |
Greater London Authority (GLA). Ultra Low Emission Zone Update to the London Assembly. London, UK: GLA; 2014. Available from: http://www.london.gov.uk/sites/default/files/ULEZ%20scrutiny%20briefing%20%E2%80%93%20February%202014.pdf. Accessed Mar 2015. | |
Atkinson RW, Barratt B, Armstrong B, et al. The impact of the congestion charging scheme on ambient air pollution concentrations in London. Atmos Environ. 2009;43(34):5493–5500. | |
Carslaw DC, Taylor PJ. Analysis of air pollution data at a mixed source location using boosted regression trees. Atmos Environ. 43:3563–3570. | |
Transport for London (TfL). London Low Emission Zone Impacts Monitoring Baseline Report – July 2008. London, UK: TfL; 2008. Available from: http://www.tfl.gov.uk/cdn/static/cms/documents/lez-impacts-monitoring-baseline-report-2008-07.pdf. Accessed Mar 2015. | |
Carslaw DC. Evidence of an increasing NO2/NOX emissions ratio from road traffic emissions. Atmos Environ. 2005;39:4793–4802. | |
Carslaw DC, Beevers SD. Estimations of road vehicle primary NO2 exhaust emission fractions using monitoring data in London. Atmos Environ. 2005;39:167–177. | |
Air Quality Expert Group (AQEG). Trends in Primary Nitrogen Dioxide in the UK. Department for Environment, Food and Rural Affairs; Scottish Executive; Welsh Assembly Government; and Department of the Environment in Northern Ireland. London, UK: AQEG; 2007. Available from: http://uk-air.defra.gov.uk/assets/documents/reports/aqeg/primary-no-trends.pdf. Accessed Mar 2015. | |
Carslaw DC, Beevers SD, Tate JE, Westmoreland E, Williams ML. Recent evidence concerning higher NOx emissions from passenger cars and light duty vehicles. Atmos Environ. 2011;45:7053–7063. | |
Carslaw DC, Rhys-Tyler G. New insights from comprehensive on-road measurements of NOx, NO2 and NH3 from vehicle emission remote sensing in London, UK. Atmos Environ. 2013;81:339–347. | |
Carslaw DC, Priestman M, Williams ML, Stewart GB, Beevers SD. Performance of optimised SCR retrofit buses under urban driving and controlled conditions. Atmos Environ. 2015;105:70e77. | |
Carslaw DC, Beevers SD, Westmoreland E, et al. Trends in NOx and NO2 Emissions and Ambient Measurements in the UK. Version: July 2011. Available from: http://uk-air.defra.gov.uk/assets/documents/reports/cat05/1108251149_110718_AQ0724_Final_report.pdf. Accessed Mar 2015. | |
Beevers SD, Westmoreland E, de Jong M, Williams ML, Carslaw DC. Trends in NOx and NO2 emissions from road traffic in Great Britain. Atmos Environ. 2012;54:107–116. | |
Lee JD, Helfter C, Purvis RM, et al. Measurement of NOx fluxes from a tall tower in central London, UK and comparison with emissions inventories. Environ Sci Technol. 2015;49(2):1025–1034. | |
Fuller GW, Green D. Evidence for increasing concentrations of primary PM10 in London. Atmos Environ. 2006;40(32):6134–6145. | |
Harrison RM, Stedman J, Derwent D. New Directions: why are PM10 concentrations in Europe not falling? Atmos Environ. 2008;42(3): 603–606. | |
Beevers SD, Carslaw DC, Westmoreland E, Mittal H. Air Pollution and Emissions Trends in London. Report produced for the UK Department for Environment, Food and Rural Affairs; 2009. Available from: http://uk-air.defra.gov.uk/assets/documents/reports/cat05/1004010934_ MeasurementvsEmissionsTrends.pdf. Accessed Mar 2015. | |
Harrison RM, Jones AM, Gietl J, Yin J, Green DC. Estimation of the contributions of brake dust, tire wear, and resuspension to nonexhaust traffic particles derived from atmospheric measurements. Environ Sci Technol. 2012;46:6523−6529. | |
Cleaner Air for London. Available from: http://www.cleanerairforlondon.org.uk/londons-air/air-quality-data/london-emissions-laei/gla-emissions-summary. Accessed Feberuary 15, 2016. | |
Department for Environment Food & Rural Affairs. Automatic Urban and Rural Network. Available from: http://www.londonair.org.uk/london/asp/datadownload.asp. Accessed March 10, 2016. | |
King’s College London. London Air Quality Network. Available from: http://www.londonair.org.uk/london/asp/datadownload.asp. Accessed March 10, 2016. | |
Transport for London.Transport Data Service. Available from http://content.tfl.gov.uk/congestion-charge-zone-map.pdf). Accessed March 10, 2016. | |
Transport for London.Transport Data Service. Available from http://content.tfl.gov.uk/low-emission-zone-map.pdf). Accessed March 10, 2016. |
 © 2016 The Author(s). This work is published and licensed by Dove Medical Press Limited. The
full terms of this license are available at https://www.dovepress.com/terms
and incorporate the Creative Commons Attribution
- Non Commercial (unported, 3.0) License.
By accessing the work you hereby accept the Terms. Non-commercial uses of the work are permitted
without any further permission from Dove Medical Press Limited, provided the work is properly
attributed. For permission for commercial use of this work, please see paragraphs 4.2 and 5 of our Terms.
© 2016 The Author(s). This work is published and licensed by Dove Medical Press Limited. The
full terms of this license are available at https://www.dovepress.com/terms
and incorporate the Creative Commons Attribution
- Non Commercial (unported, 3.0) License.
By accessing the work you hereby accept the Terms. Non-commercial uses of the work are permitted
without any further permission from Dove Medical Press Limited, provided the work is properly
attributed. For permission for commercial use of this work, please see paragraphs 4.2 and 5 of our Terms.