Back to Journals » International Journal of Nanomedicine » Volume 9 » Issue 1
Toxicity of pristine graphene in experiments in a chicken embryo model
Authors Sawosz E ![]() , Jaworski S, Kutwin M
, Jaworski S, Kutwin M ![]() , Hotowy A, Wierzbicki M
, Hotowy A, Wierzbicki M ![]() , Grodzik M
, Grodzik M ![]() , Kurantowicz N, Strojny B, Lipińska L, Chwalibog A
, Kurantowicz N, Strojny B, Lipińska L, Chwalibog A ![]()
Received 6 April 2014
Accepted for publication 2 June 2014
Published 14 August 2014 Volume 2014:9(1) Pages 3913—3922
DOI https://doi.org/10.2147/IJN.S65633
Checked for plagiarism Yes
Review by Single anonymous peer review
Peer reviewer comments 3
Ewa Sawosz,1 Slawomir Jaworski,1 Marta Kutwin,1 Anna Hotowy,1 Mateusz Wierzbicki,1 Marta Grodzik,1 Natalia Kurantowicz,1 Barbara Strojny,1 Ludwika Lipinska,2 André Chwalibog3
1Division of Nanobiotechnology, Warsaw University of Life Sciences, Warsaw, Poland; 2Institute of Electronic Materials Technology, Warsaw, Poland; 3Department of Veterinary Clinical and Animal Sciences, University of Copenhagen, Frederiksberg, Denmark
Abstract: Evaluation of the potential cytotoxicity of graphene is a key factor for medical applications, where flakes or a surface of graphene may be used as bioactive molecules, drug carriers, or biosensors. In the present work, effects of pristine graphene (pG) on the development of a living organism, with an emphasis on morphological and molecular states of the brain, were investigated using a chicken embryo model. Fertilized chicken eggs were divided into the control group and groups administered with pG suspended in milli-Q water at concentrations of 50 µg/L, 100 µg/L, 500 µg/L, 1,000 µg/L, 5,000 µg/L, and 10,000 µg/L (n=30 per group). The experimental solutions were injected in ovo into the albumin and then the eggs were incubated. After 19 days of incubation, the survival, weight of the body and organs, and blood serum biochemical indices were measured. The brain samples were collected for microscopic examination of brain ultrastructure and measurements of gene and protein expression. Survival of embryos was significantly decreased after treatment with pG, but the body and organ weights as well as biochemical indices were not affected. In all treatment groups, some atypical ultrastructures of the brain were observed, but they were not enhanced by the increasing concentrations of pG. Expression of proliferating cell nuclear antigen at the messenger ribonucleic acid level was downregulated, and the number of proliferating cell nuclear antigen-positive nuclei was significantly reduced in the 500–10,000 µg/L groups compared with the control group, indicating a decreased rate of deoxyribonucleic acid synthesis in the brain. The present results demonstrate some harmful effects of the applied pG flakes on the developing organism, including brain tissue, which ought to be considered prior to any medical applications.
Keywords: graphene, nanostructure, brain, toxicity
Introduction
Carbon is one of the most essential elements in the world. The human body contains 9% carbon atoms (about 40% of dry matter),1 which are an incomparable and fundamental element of macromolecules. Carbon-containing molecules in living organisms are organic compounds, defined as molecules containing C–H and C–C bonds.2 Carbon allotropes are mainly considered as inorganic; however, they are mostly C–C structures and may also form C–H bonds. Therefore, scientists perceive nanoparticles of carbon allotropes as relatively friendly and biocompatible, properties that predispose them to medical applications. Nevertheless, several studies have shown considerable diversity in the toxic effects of such nanoparticles, generally demonstrating toxic effects of nanotubes but no toxicity of diamond nanoparticles.3,4
A new form of carbon allotrope, graphene, has been considered for medical applications. It was demonstrated on pheochromocytoma cells and HeLa cells that graphene is less toxic in comparison with nanotubes.5 Moreover, graphene is significantly less taken up by cells than nanodiamond.5 This may suggest that graphene could be used in anticancer therapy, as it is safer than nanotubes and internalized less by cells than nanodiamond.
Graphene is a single atomic layer of an sp2-bonded carbon nanostructure. So far, it is the thinnest two-dimensional allotrope of carbon that can freely exist. Graphene exhibits unusual mechanical, electronic, and thermal properties6,7 that influence its biocompatibility. Moreover, the physically active surface of graphene may bind and activate cell receptors, especially those located in cell membranes. Hence, according to Li et al8 pristine graphene (pG) increased the expression of messenger ribonucleic acid (mRNA) of a key membrane transforming growth factor-β (TGF-β) receptor, triggering apoptosis via mitochondrial-dependent apoptotic cascades. Expression of TGF-β also has an antiproliferative effect, which interacts with fibroblast growth factor 2 (FGF-2) and controls proliferating cell nuclear antigen (PCNA) involved in tumorgenesis.9
In our previous experiments, it was revealed that pG decreased the viability of glioblastoma multiforme cells, leading to apoptosis.10 Moreover, the graphene flakes showed strong affinity to glioblastoma cells, resulting in adhesion of graphene to the cell’s body, which leads to cell membrane damage. This indicated pG as a potential agent for brain cancer therapy. However, side effects on a living organism must also be investigated, including molecular and morphological evaluations of the brain as the most sensitive target organ.
Graphene, according to methods of production, is available for medical research in three main forms: pG, graphene oxide (GO), and reduced graphene oxide (rGO). All these forms of graphene can cause different toxic effects. It has been demonstrated that GO was not highly toxic to multiple myeloma cells.11 Recently, we have shown that pG and rGO caused deoxyribonucleic acid (DNA) damage in the U87 cancer cells, indicating their toxicity, whereas GO was not toxic.12 However, in in vivo experiments with mice injected with graphene, GO caused chronic toxicity, including lung granuloma formation, at the level of 0.4 mg per animal.13 GO and rGO, when introduced to the lungs, also generated reactive oxygen species and caused apoptosis and inflammation at the level of 50 μg per mouse.14 GO applied at the level of 400 μg was lethal, whereas 100 μg and 250 μg per mouse stimulated chronic toxicity and lung, liver, and spleen granulomas.13 Furthermore, certain in vitro experiments indicate pro-oxidative, proinflammatory, and proautophagy effects of graphene,15,16 and also suggest a proapoptotic effect.16,17
A chicken embryo is a very useful model for investigating toxicity at the whole organism level, including brain evaluation, because of its fast growth, sensitivity to external treatments, and lack of blood–brain barrier at the beginning of embryogenesis.18,19 It is also a suitable fast growth model for characterization of anti- and proproliferative mechanisms at the molecular level.20
We hypothesized that pG administered to embryos at the beginning of embryogenesis might affect the ultrastructure and molecular responses of the brain. Therefore, the objective of the present study was to evaluate the toxicity of pG at the organism level, with a special emphasis on the brain, including morphological and proliferating status, using a chicken embryo model.
Materials and methods
Nanoparticles
The graphene powder used was natural flakes, produced by liquid-phase exfoliation of graphite, purchased from Skyspring Nanomaterials, Houston, TX, USA. According to the producer, the purity of the material was >99.5%. It had a specific surface area of 120–150 m2·g−1, and the thickness of particles was 1–5 nm with the average surface diameter 4 μm. Graphene was dispersed in milli-Q water to prepare experimental suspensions. The suspensions were sonicated for 30 minutes. The flakes were inspected using a JEM-2000EX transmission electron microscope (TEM) at 80 keV (JEOL, Tokyo, Japan) with a Morada 11 megapixel camera (Olympus Soft Imaging Solutions GmbH, Münster, Germany). Samples of graphene suspension (50 μg/L) for TEM were prepared by placing droplets of hydrocolloids onto formvar-coated copper grids (Agar Scientific Ltd, Stansted, UK). Immediately after the droplets had dried in air, the grids were inserted into the TEM. The test was performed in triplicate.
The spectral measurements of particles were taken using a Fourier transform infrared spectrophotometer, Vertex 80 v (Bruker BioSpin Corporation, Billerica, MA, USA). The study was conducted with two techniques: measurements of attenuated total reflectance with crystal germanium and measurements of diffused light reflectance derived from a Kubelka–Munk model. In both cases, the samples were in powder form. The measurements were performed in the spectral range of 500–4,000 cm−1 with the resolving power of 2 cm−1 for attenuated reflectance and 4 cm−1 for diffused reflectance.
The size distribution and zeta potential of pG suspended in milli-Q water or in chicken egg albumin were measured by the laser dynamic scattering electrophoretic method,21 using Zetasizer Nano ZS90 (Malvern Instruments, Malvern, UK). Egg albumin was mixed with different graphene suspensions (50 μg/L, 100 μg/L, 500 μg/L, 1,000 μg/L, 5,000 μg/L, and 10,000 μg/L) and incubated for 1 hour. Each sample was measured after 120 seconds of stabilization at 25°C, with 20 replicates.
Animal model
Fertilized eggs (55±2.1 g) from Ross Line 308 hens were obtained from a commercial hatchery, stored for 4 days at 12°C, and then incubated under standard conditions. Prior to the incubation, the eggs were weighed and randomly divided into seven groups, each with 30 eggs. The control group was not treated. The treatment groups were treated with graphene suspended in milli-Q water at concentrations of 50 μg/L, 100 μg/L, 500 μg/L, 1,000 μg/L, 5,000 μg/L, and 10,000 μg/L. The experimental solutions were given in ovo by injection of 0.3 mL of the solutions into the albumin, using sterile 1 mL tuberculin syringes. After 19 days of incubation, the eggs were opened. The embryos were weighed and immediately decapitated while blood samples were collected. The morphology of the embryos was examined according to the Hamburger and Hamilton22 standard. The chosen organs were dissected and weighed. Samples of the brain were fixed in liquid nitrogen and stored at –80°C for pending analyses or were prepared for microscopic examination.
Blood serum biochemical indices
Blood samples from the jugular vein were centrifuged 4 hours after collection at 3,000× g for 15 minutes (Sorvall® ST 16; Thermo Fisher Scientific, Waltham, MA, USA) to obtain blood serum. The activity of alanine aminotransaminase, asparagine aminotransaminase, lactate dehydrogenase, and alkaline phosphatase and the levels of glucose and blood urea nitrogen were examined using the dry chemistry equipment Vitros® DT 60 II (Johnson & Johnson, New Brunswick, NJ, USA) with Manuals Maintenance and Troubleshooting (Johnson & Johnson).
Examination of ultrastructure of brain tissue
Brain tissues from the control group and the groups treated with 50 μg/L and 500 μg/L pG were fixed for TEM examination in a fixative consisting of 1% glutaraldehyde in phosphate-buffered saline at pH 7.2. After fixation, the samples were postfixed in 1% osmium tetroxide and dehydrated in a graded series of ethanol. The tissues were embedded in an epoxy embedding resin (Fluka Epoxy Embedding Medium Kit; Sigma-Aldrich Co., St Louis, MO, USA). Ultrathin sections (100 nm) were cut with an ultramicrotome (Leica EM UC6; Leica Microsystems Nussloch GmbH, Nussloch, Germany) and stained with uranyl acetate and lead citrate. The samples were viewed using the TEM at 80 keV (JEOL), and images were taken with a Morada 11 megapixel camera (Olympus Soft Imaging Solutions GmbH).
Gene expression at the mRNA level
The samples of brain were homogenized in TRIzol® Reagent (Thermo Fisher Scientific), and total RNA was extracted according to the manufacturer’s instructions. The RNA was purified using the SV Total RNA Isolation System (Promega Corporation, Madison, WI, USA) and quantitated using a NanoDrop spectrophotometer (NanoDrop Technologies, Wilmington, DE, USA). It was transcribed into complementary DNA (cDNA) using both random hexamer and oligo(dT) primers, and the products of these reactions were mixed.
The polymerase chain reaction (PCR) primer oligonucleotides were designed based on chicken mRNA sequences for FGF2, vascular endothelial growth factor (VEGF), and PCNA. The primers gave the expected band in PCR using cDNA samples from control chicken embryos and a larger band in PCR using chicken genomic DNA. Quantification of enzyme cDNA levels was subsequently performed by real-time PCR using SYBR Green I detection and the LightCycler® System (Roche Diagnostics GmbH, Mannheim, Germany). For each sample, 200 ng of a cDNA template was added to 12.5 μL of (QuantiTect) SYBR Green Master IX (Roche Diagnostics GmbH) and 0.15 μL of both forward and reverse primers (final concentration 0.6 μM each). The total volume was made up to 20 μL with RNA-free water. An initial denaturing step at 95°C for 15 minutes was followed by 40 cycles with a denaturing step at 94°C (15 seconds), an annealing step at 56°C (30 seconds), and an elongation step at 72°C (60 seconds). The cycling reports and melting curves were evaluated as part of the analysis. All of the reactions were performed in triplicate. For analyses, relative quantification was applied with β-actin and elongation factor 1α2 housekeeping genes.
PCNA detection by immunohistological methods
Chicken brains (n=9), three from each of the control group, 50 μg/L pG group, and 500 μg/L pG group, were sampled and fixed in Bouin’s solution. Fixed samples were dehydrated in a graded series of ethanol, embedded in Paraplast® (Sigma-Aldrich Co.), and cut into 5 μm sections using a microtome (RM 2265; Leica Microsystems Nussloch GmbH). Proliferating cells were identified by immunohistochemistry using antibodies directed against PCNA (NB500-106; Novus Biologicals, Littleton, CO, USA). Sections for this purpose were incubated with mouse monoclonal anti-PCNA (dilution 1:200) for 1 hour at 4°C and visualized with Dako EnVision™ +System-HRP (DAKO K4007; Dako A/S, Glostrup, Denmark). The proliferation levels are expressed as the number of PCNA-positive nuclei in the cross-sections of the cerebrum and were counted in visual fields (40 μm2) of the tissue.
Morphometric evaluation of a number of PCNA-positive cells was carried out using a Leica microscope (DN 750; Leica Microsystems Nussloch GmbH). Ten measurements of each sample were performed at 400× magnification using LAS EZ® Version 2.0.0 software (Leica Microsystems).
Data were analyzed using the general linear model procedure of SAS (SAS Institute Inc., Cary, NC, USA).23 The Tukey–Kramer honestly significant difference test was used to test the separation of the means at a significance level of P<0.05.
Results
Characterization of nanoparticles and colloids
The thickness of pG was at a nanoscale; however, the surface was not. Most of the flakes were as a single layer or a few layers, with surface diameter between 1 μm and 4 μm (Table 1). The TEM images (Figure 1) show the smallest flake (Figure 1A), measuring about 400 nm and the biggest flake (Figure 1B), measuring up to 10 μm. The shape of graphene flakes was irregular with sharp edges, forming rough structures. The spectra of light reflectance of particle samples are demonstrated in Figure 2. The intensive peaks correspond to C=C aryl bonds and C–O ether bonds, which confirms the hydrophobic feature of pG.
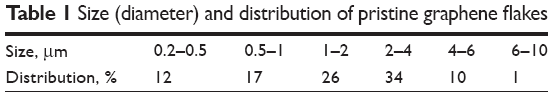 | Table 1 Size (diameter) and distribution of pristine graphene flakes |
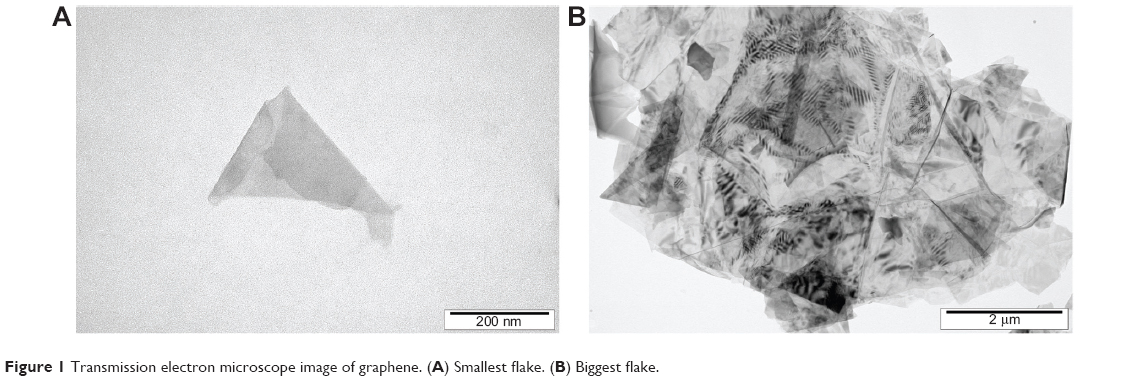 | Figure 1 Transmission electron microscope image of graphene. (A) Smallest flake. (B) Biggest flake. |
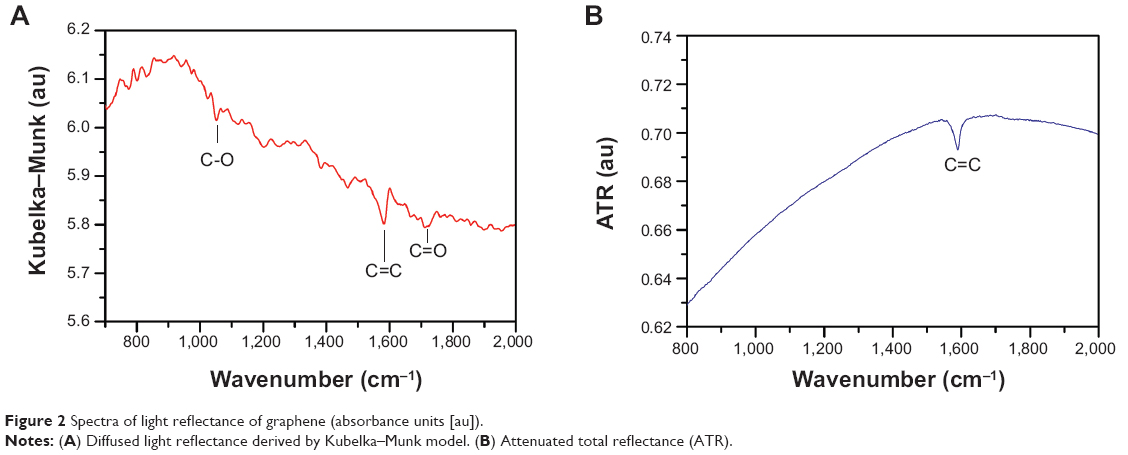 | Figure 2 Spectra of light reflectance of graphene (absorbance units [au]). |
The zeta potential of pG flakes suspended in milli-Q water was −21.8 at the concentration of 50 μg/L and decreased with increasing pG concentrations. The zeta potential for the concentrations >1,000 μg/L was not possible to measure, due to aggregation of the graphene flakes. The zeta potential of chicken egg albumin was −7.59. The colloids of pG and albumin had a zeta potential similar to that of albumin, independently of the graphene concentration (Table 2).
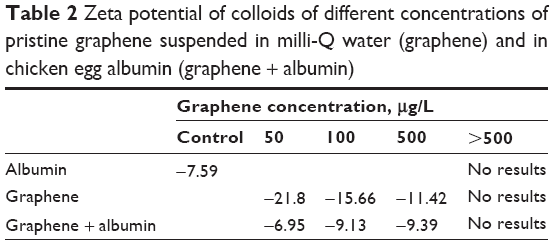 | Table 2 Zeta potential of colloids of different concentrations of pristine graphene suspended in milli-Q water (graphene) and in chicken egg albumin (graphene + albumin) |
Growth and development
Survival of embryos was significantly decreased after treatment with pG in all experimental groups (Table 3). Macroscopic visualization also indicated a few developmental defects, mainly in the group treated with 1,000 μg/L pG. Observed malformations were mainly of the head, neck, and vertebral column, and a dwarf phenotype. However, body weight and weight of the liver, brain, heart, spleen, and bursa of Fabricius of properly developed embryos, which survived until day 20, did not differ between the groups (Table 2). Biochemical indices of blood serum were not affected by pG treatment (Table 4).
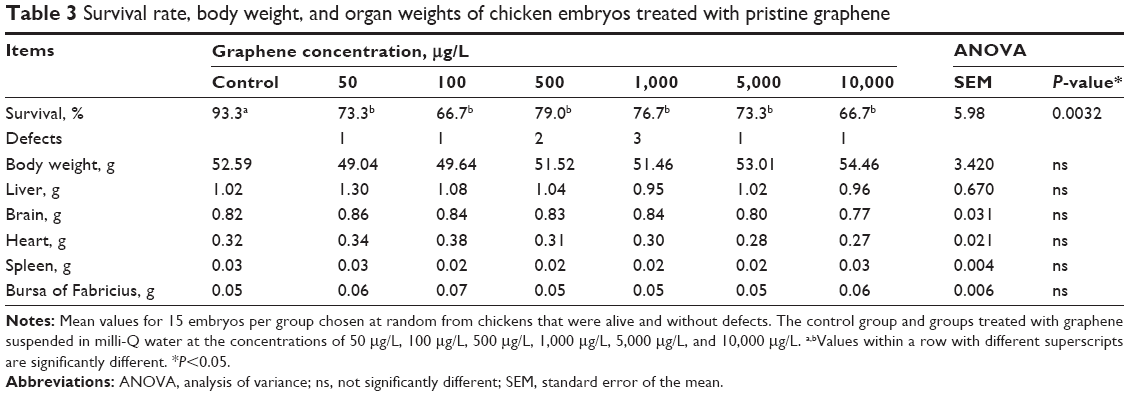 | Table 3 Survival rate, body weight, and organ weights of chicken embryos treated with pristine graphene |
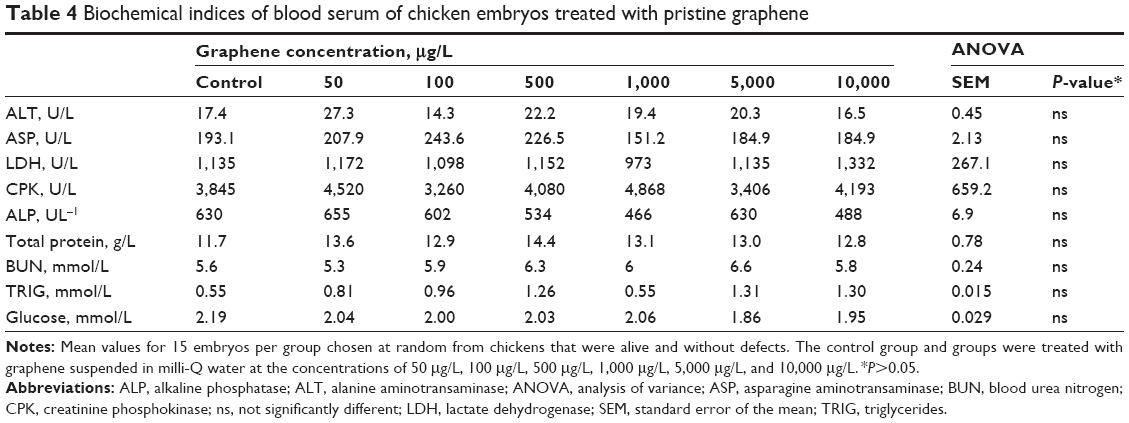 | Table 4 Biochemical indices of blood serum of chicken embryos treated with pristine graphene |
Examination of brain ultrastructure
TEM visualization of the brain samples showed some electron-dense irregular structures in the treatment groups that were not observed in the control group; hence, they could be considered as graphene-like electron-dense structures (Figures 3 and 4). Electron-dense flakes were localized within myelin structures and secondary lysosomes. Some atypical structures such as electron-dense irregular thin lines surrounded by a regular amorphic area were seen in pG-treated embryos. Moreover, the examination of brain ultrastructure showed some cellular alterations in embryos treated with pG in comparison with the control group. In all treatment groups, some atypical ultrastructures were observed, but they were not enhanced with increasing concentrations of pG. Furthermore, the number of vacuoles was increased, and blood vessels with leukocytes were seen. Mitochondria were partially disrupted. They were bigger, and circular or irregular, with a small number of cristae and signs of swelling.
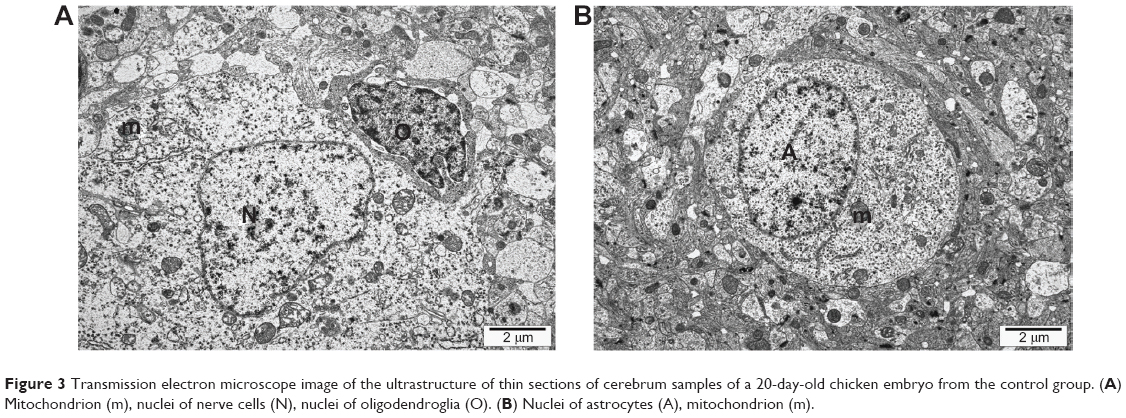 | Figure 3 Transmission electron microscope image of the ultrastructure of thin sections of cerebrum samples of a 20-day-old chicken embryo from the control group. (A) Mitochondrion (m), nuclei of nerve cells (N), nuclei of oligodendroglia (O). (B) Nuclei of astrocytes (A), mitochondrion (m). |
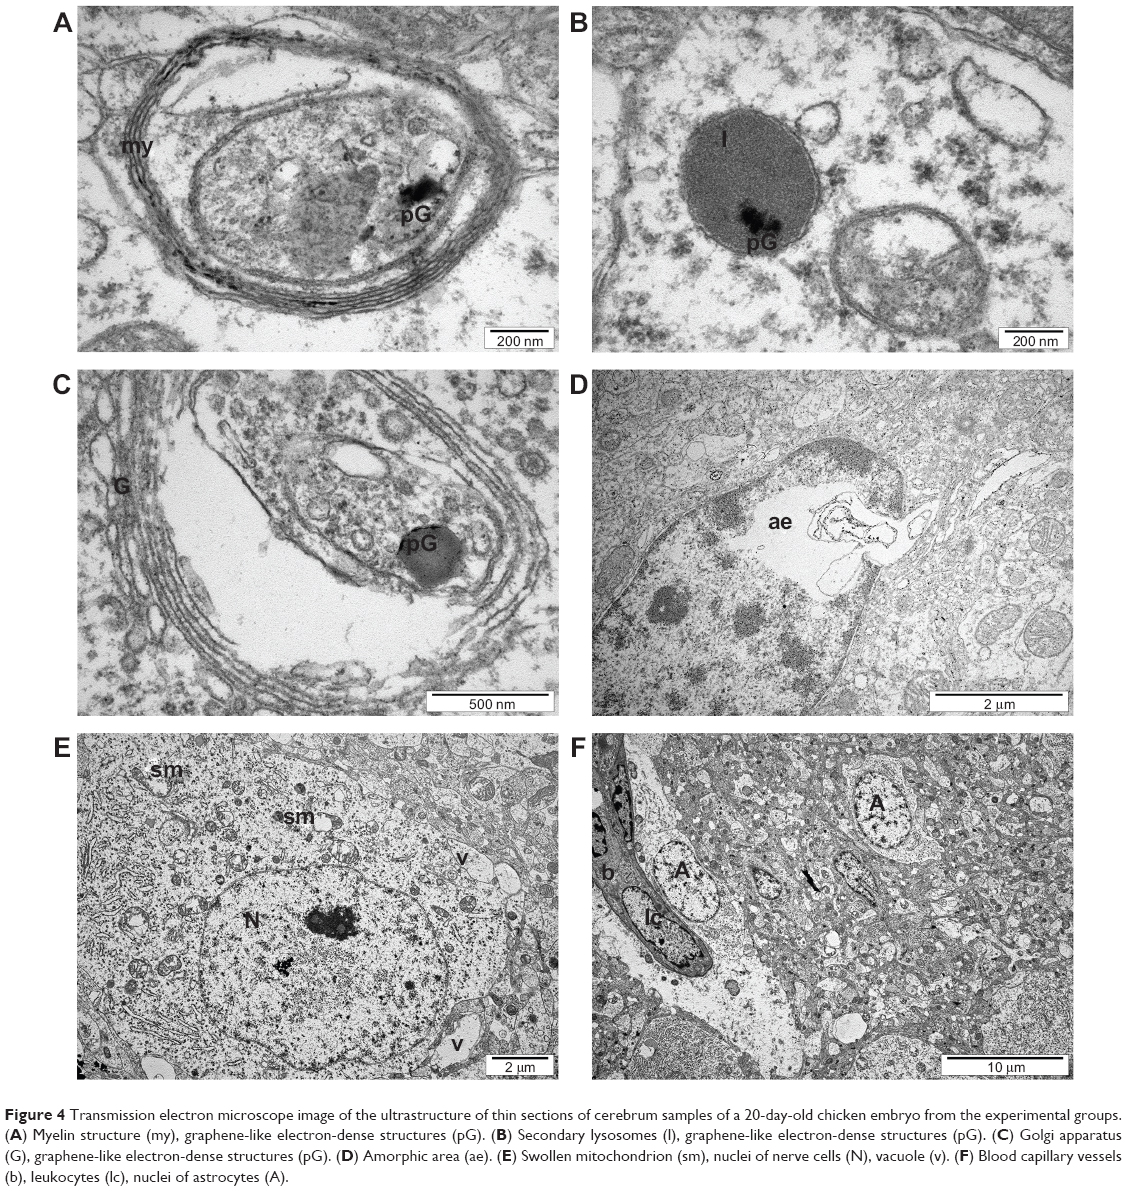 | Figure 4 Transmission electron microscope image of the ultrastructure of thin sections of cerebrum samples of a 20-day-old chicken embryo from the experimental groups. (A) Myelin structure (my), graphene-like electron-dense structures (pG). (B) Secondary lysosomes (l), graphene-like electron-dense structures (pG). (C) Golgi apparatus (G), graphene-like electron-dense structures (pG). (D) Amorphic area (ae). (E) Swollen mitochondrion (sm), nuclei of nerve cells (N), vacuole (v). (F) Blood capillary vessels (b), leukocytes (lc), nuclei of astrocytes (A). |
Gene and protein expression
FGF2 and VEGF mRNA expression did not significantly differ between the groups. pG at 500 μg/L tended to decrease the expression of PCNA mRNA in the embryos, and there was a significant decrease in PCNA mRNA expression in the 1,000 μg/L, 5,000 μg/L, and 10,000 μg/L pG groups compared with the control group. The changes in PCNA expression were confirmed at the protein level. Morphometric results showed a tendency to a reduced number of PCNA-positive nuclei after in ovo application of pG at the 50 μg/L concentration and a significant reduction at 500 μg/L (Figure 5).
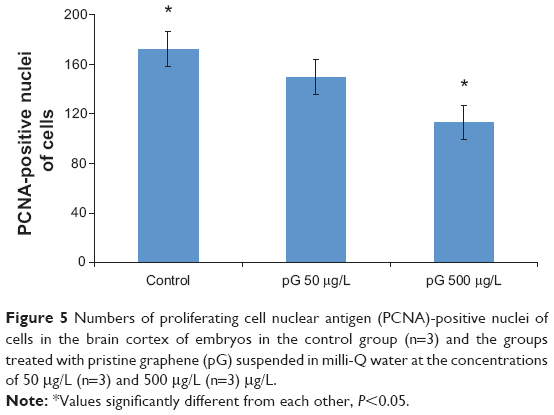 | Figure 5 Numbers of proliferating cell nuclear antigen (PCNA)-positive nuclei of cells in the brain cortex of embryos in the control group (n=3) and the groups treated with pristine graphene (pG) suspended in milli-Q water at the concentrations of 50 μg/L (n=3) and 500 μg/L (n=3) μg/L. |
Discussion
In the present study, toxic effects of pG administered in ovo to chicken embryos were clearly seen. Interestingly, the toxic effects were not dose dependent. On the contrary, in experiments with cultured human alveolar basal epithelial A549 cells, GO slightly decreased cell viability in a dose- and size-dependent manner.24 Graphene also induced a dose-dependent toxicity in human neuronal cells.25 Furthermore, increasing doses of GO decreased HeLa cell viability in a dose-dependent manner, but the release of lactose dehydrogenase was constant for concentrations of 40 μg/mL, 60 μg/mL, and 80 μg/mL.5 Moreover, in experiments with human red blood cells it was indicated that increased graphene concentration was a reason for agglomeration, leading to decreased hemolytic properties.26
Egg albumin contains a wide spectrum of different nutritional compounds, mainly proteins, which are supposed to noncovalently attach to the surface of graphene in a self-assembling process. Measurements of the zeta potential of egg albumin and different concentrations of pG mixed with albumin indicated that pG, independently of the concentration, reached the zeta potential characteristic for albumin. Furthermore, it was demonstrated that the zeta potential of a hydrocolloid of gold nanoparticles was decreased after incubation with human plasma, and the parallel process of agglomeration of gold nanoparticles was observed.27 These observations may confirm the hypothesis that nanoparticles, after being introduced to biological medium (albumin), may be coated, attached, or bound by biomolecules that could modify their dispersion and, consequently, toxic effects.
It has been suggested that hydrophobic materials are readily coated by blood serum proteins, which may act as opsonins.28 pG is a hydrophobic material and shows stable dispersion in polar solvents with the addition of surfactants.29 Moreover, amino acids and also proteins have hydrophobic regions30 that may interfere with hydrophobic graphene and, depending on the amount of graphene (in proportion to protein), graphene may surround proteins or be surrounded by proteins. Nonetheless, to investigate the behavior of pG in embryos, mixtures of pure water and pG had to be prepared. It may be hypothesized that dispersion of pG was different before injection (in the water) and after injection into albumin, because of the specific properties of albumin. Furthermore, in the present study, at the lower concentrations of pG (50 μg/L, 100 μg/L, and 500 μg/L), when the zeta potential was higher, the dispersion of flakes was higher and, consequently, penetration of the embryo was more active in comparison with the higher concentrations, when pG flakes were agglomerated. These findings were verified by the distribution of pG after the eggs were opened, which demonstrated that an increasing concentration of pG led to enlarged, highly visible agglomerated streaks of pG. Thus, the distribution of pG within the eggs probably decreased with increasing pG concentration. Nevertheless, big agglomerates of graphene, even with less efficiency to spread within eggs, might be toxic.
Although the survival rate was decreased in pG groups compared with the control group, the body weight and weight of organs, including the brain, as well as macroscopic morphology of the body of 20-day-old embryos, did not differ between control and treatment groups. Furthermore, biochemical indices of blood serum were not affected. However, because the preservation of blood serum homeostasis is a very potent process, the lack of effects on serum indices might not necessarily reflect a lack of toxic effects. Thus, we examined toxic effects of pG on the brain. The brain contains about 60% fat, being one of the organs with the most lipids.31 Consequently, it could accumulate hydrophobic molecules of graphene. In the developed organism the blood–brain barrier was recognized as nonpermeable for graphene platelets.13 However, in our experiment, graphene was administered prior to the establishment of the blood–brain barrier. As we expected, some histological changes were observed. Evaluation of the brain ultrastructure indicated some distortion of cytoarchitecture of cerebrum samples. These pathological changes were observed in all treatment groups and were independent of the concentration of pG.
The key determinant of the toxicity and biocompatibility of graphene is the chemical nature of groups bonding to its surface. The hydrophobic pG is more toxic than hydrophilic GO, because GO is taken up by cells and internalized.32 This toxicity is caused by the affinity of pG to lipids, which form cell membranes. Thus, pG flakes showed strong adhesion to the cell membrane and easily accumulated in the area of membrane lipids.10 Moreover, in experiments with mice, graphene coated with hydrophilic polyethylene glycol was excreted from the organism without causing toxicity.33
In our experiments, flakes of pG were observed within brain tissue (cerebrum). This is not the case for GO, which was detected in the liver and spleen33 and also in the lung and kidney, but not in the brain.11 Other authors indicated that graphene nanosheets might penetrate epithelial cells, macrophages, and keratinocytes.34 Graphene was localized in the cytoplasm, within membrane-bound vacuoles, and was visualized as an electron-dense linear section or irregular flakes.34 Also, accumulation of graphene was observed in experiments with Arabidopsis thaliana T87 cells.35
The present study was carried out on a whole organism model and not on a cell culture model. Consequently, the movement and distribution of nanoflakes within tissues might be different. There was an irregular electron-dense body within myelin structures or secondary lysosomes. Furthermore, specific structures, irregular electron-dense lines, within astrocytes and endothelial cells, which were partly connected to a totally disrupted lipid membrane and accompanied by an amorphic “white area”. These abnormalities of the tissue ultra-architecture indicate pathological effects of pG on the structure of lipid membranes, confirming that lipid membranes may be a significant platform for hydrophobic graphene localization.36
It ought to be emphasized that, in the present study, pG was given at the beginning of embryogenesis, when the brain and blood–brain barrier were not developed. pG was probably circulated within the organism by different routes and was present in the brain before blood–brain barrier development, which begins at about day 10 of embryogenesis.37 The toxic effect of pG also affected vacuolization of brain tissue. Moreover, the presence of leukocytes within blood vessels might indicate an inflammatory effect. The proinflammatory effect of pG was observed in experiments with murine macrophages.38 Furthermore, experiments with glioblastoma cells pointed to the possibility that pG can induce necrosis of cells. However, apoptosis was the dominant mechanism.10
Our observations of mitochondrial shape remodeling, contraction of cristae of mitochondria, and also ruptures and swelling of mitochondria, indicate the toxicity of pG. Mitochondrial volume homeostasis is necessary to maintain the structural integrity of mitochondria, and it also seems to affect different cellular processes.39 It has been observed that pG can induce cytotoxicity in murine RAW 264.7 macrophages through the depletion of the mitochondrial membrane potential, with consequent induction of the mitochondrial pathway of apoptosis.8
Mitochondrial disruptions may be a signal for rearrangement of gene expression.40 The mRNA expression of a few principal genes involved in growth and development showed no effect of pG on FGF2 and VEGF expression, but the expression of PCNA was downregulated (Table 5). Compared with the control group, PCNA mRNA expression was slightly but significantly decreased in the 500 μg/L pG group and then decreased further at higher concentrations. This result was confirmed by detection of PCNA-positive nuclei using immunochemistry methods. PCNA is associated with the DNA synthesis phase of the cell cycle and is involved in the postreplication DNA repair pathway.41 Furthermore, PCNA index might be useful as an in vivo preclinical biomarker for detecting the toxicity of different compounds in tissues.42,43
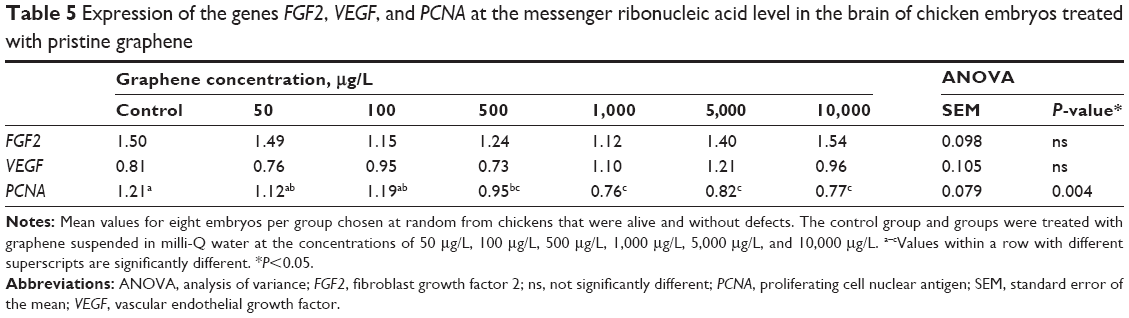 | Table 5 Expression of the genes FGF2, VEGF, and PCNA at the messenger ribonucleic acid level in the brain of chicken embryos treated with pristine graphene |
The present results clearly point to toxicological effects of pG in the chicken embryo model. Graphene affected survival of the embryos, altered the ultrastructure of the brain of embryos, and also downregulated PCNA expression, which could indicate a decreased rate of DNA synthesis in the brain. However, pG, as a two-dimensional structure but also as a hydrophobic molecule, may cause toxic effects, depending not only on the concentration but also on interactions with other biomolecules and routes of distribution in the living organism. Consequently, the behavior and toxicity of nanostructures in the intact living organism may not take place via classic physiological routes and standard toxicological mechanisms. Furthermore, it has to be underlined that the measured toxic effects were caused by the pG flakes with specific size and shape. This limits the generalization of the results to other graphene particles, having different physicochemical characteristics and possibly causing different toxicological effects.
Conclusion
Administration of pG to chicken embryos reduced survival rate but did not affect body weight, organ weights, or blood serum biochemical indices. pG affected the ultrastructure of the brain and likely affected DNA synthesis in the brain, indicating its toxicity, which ought to be considered prior to any medical applications.
Acknowledgment
This work was supported by the Polish National Research Council Grant NCN OPUS 2011/03/B/NZ9/03387.
Disclosure
The authors report no conflicts of interest in this work.
References
Frausto da Silva JJR, Williams RJP. The Biological Chemistry of the Elements: the Inorganic Chemistry of Life. New York, NY: Oxford University Press Inc; 2001:600. | ||
Morrison RT, Boyd RN. Organic Chemistry. 6th ed. Englewood Cliffs, NJ: Prentice Hall; 1992:273–285. | ||
Schrand AM, Ciftan SA, Shenderova OA. Nanodiamond particles: properties and perspectives for bioapplications. Crit Rev Solid State Mat Sci. 2009;34:18–74. | ||
Huang H, Pierstorff E, Liu K, Ōsawa E, Ho D. Nanodiamond-mediated delivery of therapeutics via particle and thin film architectures. In: Ho D, editor. Nanodiamonds: Applications in Biology and Nanoscale Medicine. New York, NY: Springer: Science + Business Media; 2010: 151–174. | ||
Zhang X, Hu W, Jing Li J, Tao L, Wei Y. A comparative study of cellular uptake and cytotoxicity of multi-walled carbon nanotubes, graphene oxide, and nanodiamond. Toxicol Res. 2012;1:62–68. | ||
Novoselov KS, Geim AK, Morozov SV, et al. Electric field effect in atomically thin carbon films. Science. 2004;306:666–669. | ||
Geim AK. Graphene: status and prospects. Science. 2009;324: 1530–1534. | ||
Li Y, Liu Y, Fu Y, et al. The triggering of apoptosis in macrophages by pristine graphene through the MAPK and TGF-beta signaling pathways. Biomaterials. 2012;33(2):402–411. | ||
Pan D, Yang J, Lu F, et al. Platelet-derived growth factor BB modulates PCNA protein synthesis partially through the transforming growth factor beta signalling pathway in vascular smooth muscle cells. Biochem Cell Biol. 2007;85(5):606–615. | ||
Jaworski S, Sawosz E, Grodzik M, et al. In vitro evaluation of the effects of graphene platelets on globlastoma multiforme cells. Int J Nanomedicine. 2013; 8:413–420. | ||
Wu S, Zhao X, Cui Z, et al. Cytotoxicity of graphene oxide and graphene oxide loaded with doxorubicin on human multiple myeloma cells. Int J Nanomedicine. 2014;9:1413–1421. | ||
Hinzmann M, Jaworski S, Kutwin M, et al. Nanoparticles of carbon allotropes exhibit different genotoxic effects on glioblastoma multiforme cell. Int J Nanomedicine. 2014;9:2409–2417. | ||
Wang K, Ruan J, Song H, et al. Biocompatibility of graphene. Nanosc Res Lett. 2011;6:8. | ||
Duch MC, Budinger GRS, Liang YT, et al. Minimizing oxidation and stable nanoscale dispersion improves the biocompatibility of graphene in the lung. Nano Lett. 2011;11:5201–5207. | ||
Chen GY, Yang HJ, Lu CH, et al. Simultaneous induction of autophagy and toll-like receptor signaling pathways by graphene oxide. Biomaterials. 2012;33(27):6559–6569. | ||
Matesanz M-C, Vila M, Feito M-J, et al. The effects of graphene oxide nanosheets localized on F-actin filaments on cell-cycle alterations. Biomaterials. 2013;34(5):1562–1569. | ||
Vallabani NV, Mittal S, Shukla RK, et al. Toxicity of graphene in normal human lung cells (BEAS–2B). J Biomed Nanotechnol. 2011;7(1): 106–107. | ||
Gagnon ZE, Patel A. Induction of metallothionein in chick embryos as a mechanism of tolerance to platinum group metal exposure. J Environ Sci Health A Tox Hazard Subst Environ Eng. 2007;15;42(3):381–387. | ||
Prasek M, Sawosz E, Jaworski S, et al. Influence of nanoparticles of platinum on chicken embryo development and brain morphology. Nanoscale Res Lett. 2013;8:251–260. | ||
Wierzbicki M, Sawosz E, Grodzik M, et al. Carbon nanoparticles downregulate expression of basic fibroblast growth factor in the heart during embryogenesis. Int J Nanomedicine. 2013;8:3427–3435. | ||
Schärtl W, editor. Light Scattering from Polymer Solutions and Nanoparticle Dispersions. Berlin Heidelberg, Germany: Springer-Verlag; 2007. | ||
Hamburger V, Hamilton HL. A series of normal stages in the development of the chick embryo. Dev Dyn. 1952;95(4):231–272. | ||
SAS Institute Inc. Base SAS 9.2 Procedures Guide. Cary, NC: SAS Institute Inc; 2009. | ||
Chang Y, Yang S-T, Liu J-H, et al. In vitro toxicity evaluation of graphene oxide on A549 cells. Toxicol Lett. 2011;200:201–210. | ||
Zhang Y, Ali SF, Dervishi E, et al. Cytotoxicity effects of graphene and single-wall carbon nanotubes in neural phaeochromocytoma-derived PC12 cells. ACS Nano. 2010;4(6):3181–3186. | ||
Liao KH, Lin YS, Macosko CW, Haynes CL. Cytotoxicity of graphene oxide and graphene in human erythrocytes and skin fibroblasts. ACS App Mater Interfaces. 2011;3:2607–2615. | ||
Dobrovolskaia MA, Patri AK, Zheng J, et al. Interaction of colloidal gold nanoparticles with human blood: effect on particle size and analysis of plasma protein binding profiles. Nanomedicine. 2009;5:106–117. | ||
Garnett MC, Kallinteri P. Nanomedicines and nanotoxicology: some physiological principles. Occup Med (Lond). 2006;56:307–311. | ||
Pinto AM, Goncalves IC, Magalhaes FD. Graphene-based materials biocompatibility: a review. Colloids Surf B Biointerfaces. 2013;111: 188–202. | ||
Kato A, Nakai S. Hydrophobicity determined by a fluorescence probe method and its correlation with surface properties of proteins. Biochim Biophys Acta. 1980;624:13–20. | ||
Chang CY, Ke DS, Chen JY. Essential fatty acids and human brain. Acta Neurol Taiwan. 2009;18(4):231–241. | ||
Sasidharan A, Panchakarla LS, Chandran P, et al. Differential nano-bio interactions and toxicity effects of pristine versus functionalized graphene. Nanoscale. 2011;3:2461–2464. | ||
Yang K, Wan J, Zhang S, Zhang Y, Lee ST, Liu Z. In vivo pharmacokinetics, long-term biodistribution, and toxicology of PEGylated graphene in mice. ACS Nano. 2011;5:516–522. | ||
Li Y, Yuana H, Busschec A, et al. Graphene microsheets enter cells through spontaneous membrane penetration at edge asperities and corner sites. Proc Natl Acad Sci U S A. 2013;110(30):12295–12300. | ||
Begum P, Fugetsu B. Induction of cell death by graphene in Arabidopsis thaliana (Columbia ecotype) T87 cell suspensions. J Hazard Mater. 2013;260:1032–1041. | ||
Bianco A. Graphene: safe or toxic? The two faces of the medal. Angew Chem Int. 2013;52:4986–4997. | ||
Grange-Messent V, Raison D, Bouchaud C. Astrocyte-endothelial cell relationships during the establishment of the blood–brain barrier in the chick embryo. Biol Cell. 1996;86:45–51. | ||
Zhou H, Kai Zhao K, Wei Li et al. The interactions between pristine graphene and macrophages and the production of cytokines/chemokines via TLR- and NF-kB-related signaling pathways. Biomaterials. 2012; 33:6933–6942. | ||
Kaasik A, Safiulina D, Zharkovsky A, Veksler V. Regulation of mitochondrial matrix volume. Am J Physiol Cell Physiol. 2007;292: C157–C163. | ||
Suen D-F, Norris KF, Youle RJ. Mitochondrial dynamics and apoptosis. Genes Dev. 2008;22:1577–1590. | ||
Lehmann AR, Fuchs RP. Gaps and forks in DNA replication: rediscovering old models. DNA Repair. 2006;5(12):1495–1498. | ||
Mishra A, Doyle NA, Martin WJ, Bleomycin-mediated pulmonary toxicity. Am J Respir Cell Mol Biol. 2000;22:543–549. | ||
D’Andrea MR, Lawrence D, Nagele RG, Wang CY, Damiano BP. PCNA indexing as a preclinical immunohistochemical biomarker for testicular toxicity. Biotech Histochem. 2008;83:211–220. |
 © 2014 The Author(s). This work is published and licensed by Dove Medical Press Limited. The
full terms of this license are available at https://www.dovepress.com/terms
and incorporate the Creative Commons Attribution
- Non Commercial (unported, 3.0) License.
By accessing the work you hereby accept the Terms. Non-commercial uses of the work are permitted
without any further permission from Dove Medical Press Limited, provided the work is properly
attributed. For permission for commercial use of this work, please see paragraphs 4.2 and 5 of our Terms.
© 2014 The Author(s). This work is published and licensed by Dove Medical Press Limited. The
full terms of this license are available at https://www.dovepress.com/terms
and incorporate the Creative Commons Attribution
- Non Commercial (unported, 3.0) License.
By accessing the work you hereby accept the Terms. Non-commercial uses of the work are permitted
without any further permission from Dove Medical Press Limited, provided the work is properly
attributed. For permission for commercial use of this work, please see paragraphs 4.2 and 5 of our Terms.