Back to Journals » Clinical Ophthalmology » Volume 8
Topography of retinal recovery processes in humans
Authors Mazinani BE, Merx E, Plange N, Walter P ![]() , Roessler G
, Roessler G
Received 10 June 2013
Accepted for publication 18 November 2013
Published 20 October 2014 Volume 2014:8 Pages 2133—2139
DOI https://doi.org/10.2147/OPTH.S49708
Checked for plagiarism Yes
Review by Single anonymous peer review
Peer reviewer comments 4
Babac E Mazinani, Elke Merx, Niklas Plange, Peter Walter, Gernot F Roessler
RWTH Aachen University, Aachen, Germany
Background: The purpose of this study was to examine retinal recovery processes topographically by the application of three flash sequences with specific interstimulus intervals.
Methods: Twelve healthy subjects underwent multifocal electroretinography with a light-emitting diode stimulator. Every flash sequence consisted of three flashes with 25 msec between the first and the second flash and 35 msec between the second and the third flash. The interval between the third and the first flash of the next step was 85 msec. The interstimulus interval-dependent amplitude reductions of the multifocal electroretinographic response for these three intervals yielded three data points that were used to determine the complete curve of the recovery kinetics.
Results: Amplitude reductions were higher with shorter interstimulus intervals. The mean half-life periods of the recovery kinetics for the different concentric rings and all subjects were: ring 1, 29.3±5.9 msec; ring 2, 24.2±6.4 msec; ring 3, 23±4.1 msec; ring 4, 23.1±4.6 msec; and ring 5, 22.3±4.4 msec. The differences between the first and all other rings were statistically significant (P<0.05).
Conclusion: The kinetics of the amplitude recovery after short interstimulus intervals showed a spatial distribution, with faster recovery toward the macular periphery.
Keywords: multifocal, electroretinography, recovery, LED stimulator, interstimulus interval
Introduction
Responses on electroretinography (ERG) show diminished amplitudes when preceded by a sufficiently short time lag after a first response. The amplitude reduction increases with shortening of the interstimulus interval (ISI).1,2 Full recovery of the true scotopic rod-dependent response requires an ISI of at least several seconds depending on the stimulus conditions.2,3 The recovery of the cone-dependent system can be studied in detail under photopic conditions using a very short ISI; for example, Skrandies and Raile described a recovery of photopic ERG amplitudes earlier than 100 msec.4 Applying this knowledge to the clinical diagnosis of retinal pathology, a topographical analysis of retinal recovery processes would be helpful, firstly to determine if there are local differences in amplitude recovery across the retina, and secondly to test if specific retinal pathologies lead to locally detectable disturbances in amplitude recovery. The multifocal ERG technique, which enables topographical analysis of central retinal function, uses cathode ray tube or liquid crystal display monitors with fixed frame frequencies for stimulation. The rigid default frame length does not allow stimulation settings that would make it possible to estimate amplitude recovery kinetics in a detailed manner. Light-emitting diode (LED) stimulators have been used previously to record multifocal ERGs, and can be driven with variable frame rates and generate dark and bright steps of the desired duration.5 The aim of this study was to examine the topography of retinal refractory processes using multifocal ERG with LED stimulation.
Materials and methods
The photopic response amplitudes of the second flash after a short ISI have recovery kinetics that can be described by an exponential function with saturation after an ISI of sufficient length.4 To determine and describe the characteristics of such kinetics without needing to test a multitude of different ISI, we used a model proposed by Bartz-Schmidt et al for scotopic Ganzfeld ERGs.6 The retina is stimulated with a triple-flash procedure, whereby the first flash is followed by a second flash after a short ISI of 25 msec, followed by a third flash after a medium ISI of 35 msec, and the first flash comes after a sufficient duration to stimulate a maximal amplitude of 85 msec. Based on the data for these three ISI and corresponding amplitudes, and using the above-mentioned mathematical model to determine the function of the amplitude recovery kinetics, the half-life of the function was calculated using Origin 6.0 software (OriginLab Corporation, Northampton, MA, USA) for the average response of each concentric ring:
|
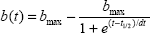
where b(t) represents the amplitude for each time point of the recovery curve, bmax is the maximal amplitude after an infinite dark interval, dt represents a time constant, and t1/2 represents the half-life of the recovery curve, ie, the time necessary for 50% recovery compared with maximal amplitude. The t1/2 results for concentric rings were compared using the paired Wilcoxon signed-rank test.
The retina was stimulated using an LED stimulator (Stasche and Finger GmbH, Brandenburg, Germany) driven by a frame frequency of 100 Hz, resulting in a frame length of 10 msec. The luminance of the dark step was 0.2 cd/m2 and that of the light step was 264 cd/m2 (tested with a Minolta luminance meter; Konica Minolta, Inc., Tokyo, Japan). The LED emitted a bright yellow light with a wavelength of 570–590 nm. Eye safety was not tested.
The recordings were performed according to International Society for Clinical Electrophysiology of Vision guidelines.7 Each subject’s pupils were dilated using phenylephrine 5% and tropicamide 1% eye drops. Contact lens electrodes (ERG-Jet™; Universo S.A., Lausanne, Switzerland) were used. Fixation was not monitored, but amplitude-dependent automatic artifact rejection was used. Recordings were done monocularly, refraction was corrected, if necessary. The stimulus covered the central 60 degrees of the visual field. The size of the stimulation hexagons decreased toward the center to compensate the higher central photoreceptor density and to obtain a consistent signal to noise ratio across the tested field. The distortion factor was 4. Therefore, amplitude densities (response amplitudes divided by the area of the corresponding stimulation hexagon [nV/deg2]) were used for the quantitative analysis as recommended by the International Society for Clinical Electrophysiology of Vision standard. Within the light frame itself, the portion of the light phase could be chosen and was set to 5 msec. Thus, with a frame sequence of 1001000100000000 for each step of the M-sequence, the result was an ISI of 25 msec, 35 msec, and 85 msec. The M-sequence had a length of 212 steps resulting in a test duration of 8×86 seconds.
A pilot study was performed in six subjects using a frame frequency of 60 Hz with double flashes and an ISI of 16.7 (ISI 17), 33.3, 50, and 67 msec. Filter settings were at 5–100 Hz. After obtaining informed consent and following the tenets of the Declaration of Helsinki, 12 healthy subjects of mean age 25±3 years were examined using the three-flash procedure with a field resolution of 61 hexagons. The t1/2 of the recovery kinetics was determined for the potentials of five concentric rings of the stimulus. The peaks for the recorded waveforms were identified by one investigator as local minima (arising from the descending leg of the preceding response) and maxima.
To determine the optimal ISI for the triple-flash paradigm, the minimal ISI required to obtain a maximal amplitude (equal to a response after an infinite dark interval) had to be determined. For this purpose, six subjects were examined using twin flash sequences with ISI of 17, 33, 50, and 67 msec. The 12 subjects in the main study and the six subjects in the pilot study overlapped. The Kolmogorov-Smirnov test (IBM® SPSS® Statistics for Windows software; IBM Corp., Armonk, NY, USA) revealed that our data were normally distributed. The standard deviation was calculated as:
|
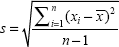
where  is the mean.
Results
Figure 1 shows the mean sum responses for both eyes in all subjects of the pilot study. Whereas no clear second peak in the sum responses is visible at an ISI of 17 msec, the response at 33 msec appears to be reduced, while the responses at 50 msec and 67 msec show no marked difference in amplitude compared with the first flash. Respective comparison of the amplitudes for the 33 msec and 50 msec responses with the amplitude of the first response and ring averages using a paired Student’s t-test was significant for the 33 msec responses in all subjects but not significant for the 50 msec responses. Figure 2 shows that the 33 msec responses are significantly smaller than the first responses, but that the amplitudes have already recovered after an ISI of 50 msec. We concluded that an interval of 85 msec after the third flash (and before each first flash) was sufficient to obtain a maximal amplitude and that the intervals of 25 msec and 35 msec would lie in the ascending part of the amplitude recovery curve.
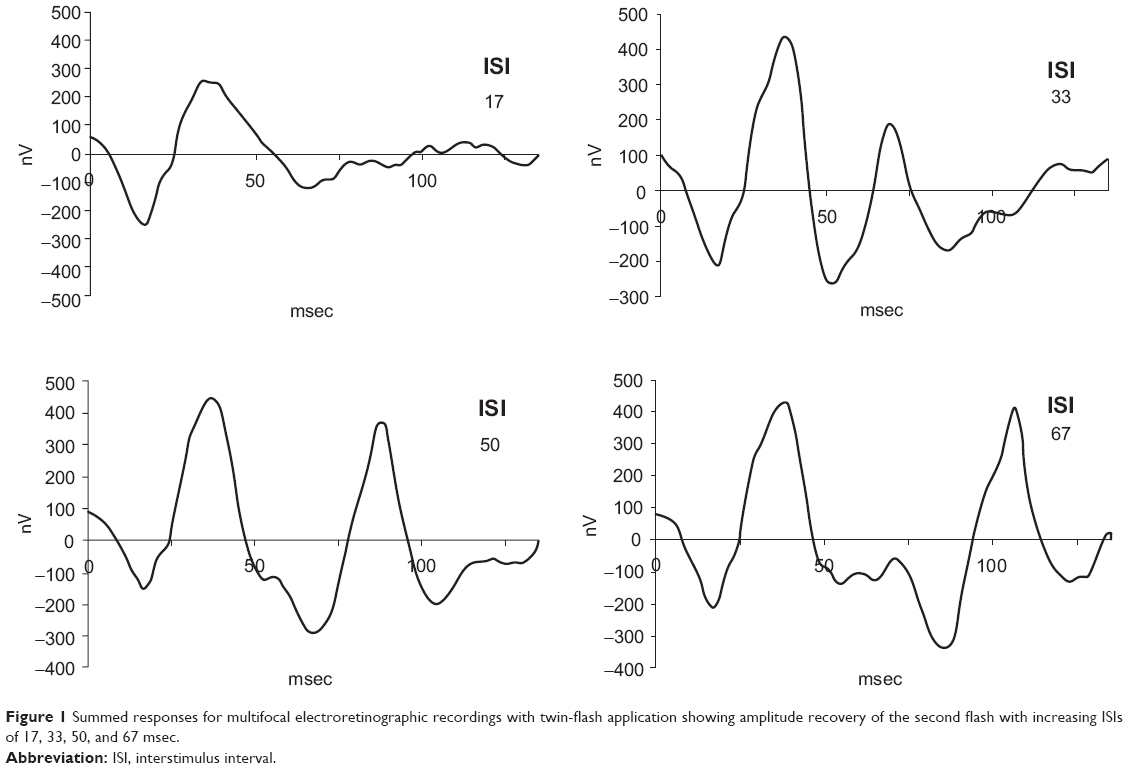 | Figure 1 Summed responses for multifocal electroretinographic recordings with twin-flash application showing amplitude recovery of the second flash with increasing ISIs of 17, 33, 50, and 67 msec. |
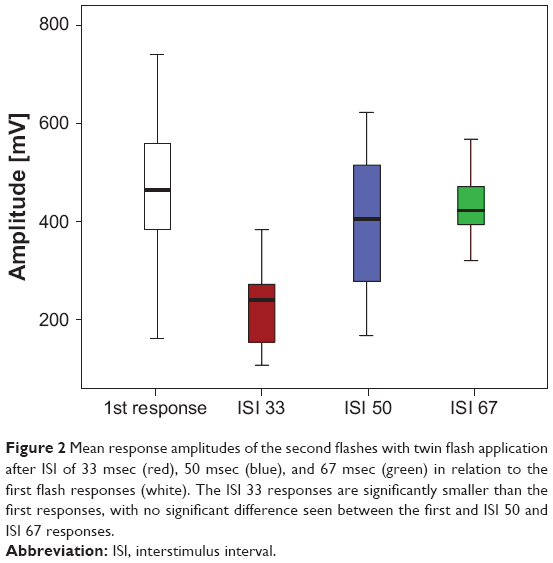 | Figure 2 Mean response amplitudes of the second flashes with twin flash application after ISI of 33 msec (red), 50 msec (blue), and 67 msec (green) in relation to the first flash responses (white). The ISI 33 responses are significantly smaller than the first responses, with no significant difference seen between the first and ISI 50 and ISI 67 responses. |
Figure 3 shows the multifocal ERG result for one subject using the triple-flash stimulus. Because of the long duration of each single step (160 msec) and a lower resulting total number of M-sequence steps (n=212), the responses appear somewhat noisier than the responses from regular multifocal ERG recordings with 61 hexagons. On the other hand, the single step of the triple-flash procedure should have a better signal to noise ratio than a regular multifocal ERG step because it contains responses to three flashes, which means a higher amount of signal. We did not quantify the actual signal to noise ratios, but practice showed that the curve properties were clear enough to identify the peaks and determine the amplitudes. An amplitude-dependent artifact rejection algorithm was used to reduce noise.
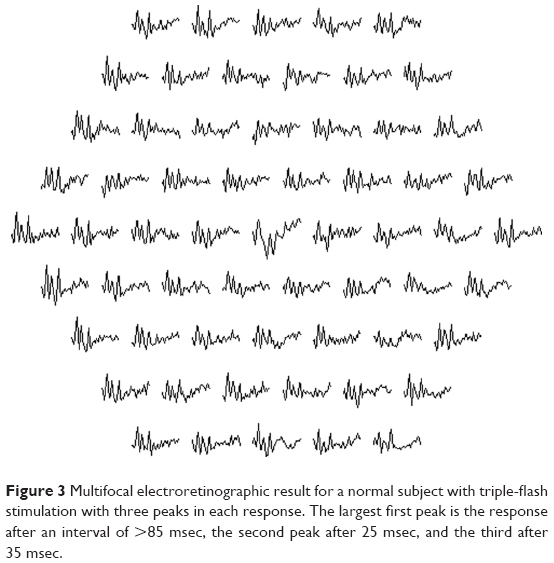 | Figure 3 Multifocal electroretinographic result for a normal subject with triple-flash stimulation with three peaks in each response. The largest first peak is the response after an interval of >85 msec, the second peak after 25 msec, and the third after 35 msec. |
The responses show three peaks, the first of which (P85), with a preceding interval of at least 85 msec, is the largest. The second peak (P25) after an ISI of 25 msec is the smallest and the last peak (P35) after an ISI of 35 msec is of medium amplitude. Figure 4 shows the ring averages for the same subject. From the average responses on the left, it can be seen that there is a tendency for consecutive peaks, especially P25, to show increasing amplitude with increasing eccentricity, and thus a tendency to recover earlier from the preceding flash.
 | Figure 4 Ring analysis for the same subject. Green, ring 1; red, ring 2; brown, ring 3; orange, ring 4; and blue, ring 5. |
The recovery kinetics for the subject described above are shown in Figure 5. The three dots at 25 msec, 35 msec, and 85 msec represent the amplitude densities measured for the P25, P35, and P85 peaks, respectively, in ring 3. Under the logical assumption that an infinitely small ISI would lead to an amplitude of 0 and not a negative amplitude, a corresponding point was set at 0 msec. Further points with an amplitude of 0 were added in the negative part of the ordinate. These were necessary for a correct sigmoidal fit of the recovery curve. Otherwise, our mathematical model would have yielded negative amplitudes with a small ISI in a major part of the calculations.
 | Figure 5 Amplitude recovery kinetics based on the measured interstimulus interval of ring 3 for the same subject. |
Mean amplitude densities for the concentric ring responses at the three stimulated peaks are displayed in Table 1. The mean half-lives for the different concentric rings and all subjects were: ring 1, 29.3±5.9 msec; ring 2, 24.2±6.4 msec; ring 3, 23±4.1 msec; ring 4, 23.1±4.6 msec; and ring 5, 22.3±4.4 msec. The differences between the first and other rings were statistically significant (P<0.05, Figure 6). There were no significant differences between rings 2, 3, 4, and 5.
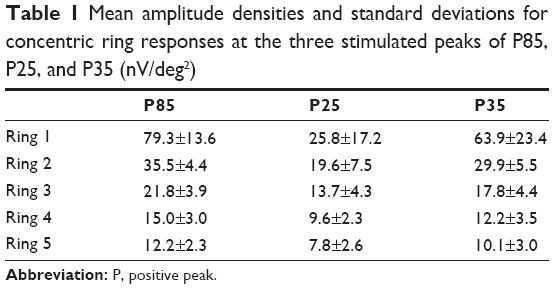 | Table 1 Mean amplitude densities and standard deviations for concentric ring responses at the three stimulated peaks of P85, P25, and P35 (nV/deg2) |
 | Figure 6 Half-lives of the amplitude recovery kinetics showing more rapid recovery peripherally. |
Discussion
Different theories exist about the reason for the reduction in amplitude seen with repeated scotopic ERGs. Early publications suggested active postexcitatory inhibition of the rod system because, even when recorded under scotopic circumstances (dark adaptation, low flash intensities), the second response seemed to have photopic contributions in short ISI: Burian and Spivey reported more rapid amplitude recovery at higher flash intensities,1 Elenius described a refractory period of several hundred milliseconds in patients with achromatopsia,2 and Gliem et al found smaller second peaks with longer dark adaptation using an ISI of 120 msec.8 Therefore, the recording of double-flash ERG under scotopic conditions has been shown to be sensitive in several macular disorders.8,9
Another obvious explanation is a light-adapting photochemical process being involved in the first flash (bleaching of rhodopsin).10 Arden et al concluded that, when using repetitive light flashes, suppression of ERG amplitude was independent of the light period and that this suppression was a neural rather than a photochemical process.11 This conclusion has been supported by others who have located this process to the middle retinal layers with special focus on amacrine cells,12 which seem to modify and stabilize retinal output.13 Studies of retinal adaptation processes seem to support the idea that a combination of photochemical and neuronal mechanisms is involved in refractory processes in the retina.14,15
Previous studies have suggested that the decrease in amplitude after a short ISI is due to local metabolic processes in the retina and that, during recovery, the ERG response at any given moment reflects the balance between supply and demand of energy.7
The results of this study show that recovery in amplitude of the multifocal ERG response is slowest in the center of the macula and becomes more rapid toward the periphery. A possible explanation for this phenomenon could be the structural tendency toward underperfusion and hypoxia in the central fovea.16 The foveal photoreceptor density is the highest across the whole retina,17 photoreceptors consume more oxygen than any other cell type,18 and the fact that each foveal cone gives input to several proximal neurons in a nonconvergent manner even increases the density of energy-demanding cells. The central foveal oxygen demand is so high that in macaques, photoreceptors consume the complete choroidal supply and are dependent on supplement from the retinal vessels in special conditions.19 Despite this fact, there is an avascular foveal zone, which seems to be not simply an adaptation of the vasculature to foveal depression but a concession to optimize the optics, rather, the cellular architecture in the foveal depression adapts to the insufficient blood supply. Provis concludes that, in the adult macula, oxygen supply and consumption are “on a knife-edge”, a phenomenon that must be held liable for the fact that the complications of age-related macular degeneration mostly occur in the center of the macula.16 The relative metabolic stress is highest centrally and decreases in a concentric manner toward the periphery. We conclude from the similar pattern of retinal refractory times in our study that, in photopic ERGs, after depletion of retinal metabolic resources following a first flash, the unfavorable energy supply in the central fovea could explain the slightly prolonged amplitude recovery times compared with the neighboring periphery. A possible way to test this theory in future studies could be to correlate amplitude recovery distributions using new methods of topographical perfusion analysis that have been described recently.20
A centripetal delay of multifocal ERG peak times, similar to our observed distribution of recovery half-lives, is known.21 Whereas nasotemporal latency differences have been attributed to inner retinal activity, to our knowledge, the concentric latency delays have not been explained.22 One possible way to test if our supposed physiological explanation of the amplitude recovery topography also explains the concentric latency delays would be to compare intersubject variations of the topography of both phenomena.
An interesting issue is the relationship between the results of the analysis of higher order kernels in multifocal ERG with our results in particular or with Ganzfeld double-flash ERG experiments in general. Higher order kernels represent the interactions between responses generated by different stimulation steps (base periods) of the M-sequence (consecutive base periods in the case of the first slice of the second order kernel [SOK], which has received the most attention, or base periods that are further apart).23 The SOK “response” is generated by the mathematical difference of a (reduced) response that was preceded by a light step and a full response with no preceding light step, and thus should be affected by the same factors that affect the recovery kinetics of cone ERGs, as have been investigated in the present study and in photopic Ganzfeld experiments.
SOK responses have been attributed to retinal nonlinearities at the level of the optic nerve head,24 the inner retina,25,26 the inner plexiform layer,27 or the outer plexiform layer,28 and in this respect are explained similarly to the neuronal theory for refractory processes in scotopic ERGs. A characteristic topography of SOK responses, such as the typical amplitude density distribution in the first order kernel response, has not been described to our knowledge (a SOK response peak can be located in the nasal retina in some cases).29 In particular, the centrifugal faster amplitude recovery that we have found cannot be confirmed by SOK results. A possible explanation could be that the kernel analysis can describe the retinal recovery kinetics only in a limited way because it is restricted to ISI that are a multiple of the base period, which in turn is determined by the monitor frame frequency. Another point may be the fact that the SOK response not only represents simple amplitude reduction but also the mathematical difference of the complete waveforms, and could therefore be influenced by factors other than the half-life periods obtained here.
The significance of this study is that the theory regarding a relative oxygen deficit in the central macula on anatomical observation is confirmed by a functional finding for the first time. Assuming that amplitude recovery reflects the balance of oxygen supply and demand, the multifocal triple-flash ERG could add diagnostic information in a number of macular vascular diseases, such as diabetic retinopathy and vessel occlusion, as well as in rare disorders such as foveal telangiectasia.
In conclusion, topographical analysis of retinal recovery processes using LED stimulation with a triple-flash paradigm revealed delayed central recovery compared with the peripheral macula. The presumed reason for this phenomenon is the unfavorable relationship between energy demand and supply in the central macula. More research is needed to determine if this test procedure can yield additional information regarding the diagnosis and treatment of macular disorders.
Disclosure
The authors report no conflicts of interest in this work.
References
Burian HM, Spivey BE. The effect of twin flashes and of repetitive light stimuli on the human electroretinogram. Am J Ophthalmol. 1959;48 Part 2:274–286. | ||
Elenius V. Recovery of retinal function from suppression caused by flashes of light. Electroretinogram measurements in totally color-blind eyes. Arch Ophthalmol. 1967;78:297–299. | ||
Gjotterberg M. Double flash human electroretinogram with special reference to the oscillatory potentials and the early phase of dark adaptation: a normative study. Acta Ophthalmol. 1974;52:291–304. | ||
Skrandies W, Raile A. Cortical and retinal refractory periods in the human visual system. Int J Neurosci. 1989;44:185–195. | ||
Smith DC, Keating D, Parks S, Evans AL. An instrument to investigate temporal processing mechanisms with the multifocal ERG. J Med Eng Technol. 2002;26:147–151. | ||
Bartz-Schmidt KU, Brunner R, Esser P, Luke C, Walter P, Sickel W. The triple flash electroretinogram and its significance in macular diseases. B-wave recovery as a diagnostic tool. Graefes Arch Clin Exp Ophthalmol. 1996;234:604–611. | ||
Hood DC, Bach M, Brigell M, et al. ISCEV guidelines for clinical multifocal electroretinography (2007 edition). Doc Ophthalmol. 2008;116:1–11. | ||
Gliem H, Moller DE, Kietzmann G. [The double flash ERG in diabetic retinopathy]. Acta Ophthalmol (Copenh). 1973;51:85–94. German. | ||
Mitsuyu M, Honda Y, Negi A. Application of twin flash stimuli for some mascular diseases isolation of local responses by twin flashes. Acta Ophthalmol. 1980;58:688–696. | ||
Adrian ED. The electric response of the human eye. J Physiol. 1945;104:84–104. | ||
Arden G, Granit R, Ponte F. Phase of suppression following each retinal b-wave in flicker. J Neurophysiol. 1960;23:305–314. | ||
Algvere P, Westbeck S. Human ERG in response to double flashes of light during the course of dark adaptation: a Fourier analysis of the oscillatory potentials. Vision Res. 1972;12:195–214. | ||
Schneider T, Zrenner E. Double-flash responses in different retinal layers. Ophthalmic Res. 1987;19:193–199. | ||
Dowling JE, Wald G. Vitamin A deficiency and night blindness. Proc Natl Acad Sci U S A. 1958;44:648–661. | ||
Rushton WA, Powell DS. Early phase of dark-adaptation. Vision Res. 1972;12:1083–1093. | ||
Provis JM. Development of the primate retinal vasculature. Prog Retin Eye Res. 2001;20:799–821. | ||
Curcio CA, Sloan KR, Kalina RE, Hendrickson AE. Human photoreceptor topography. J Comp Neurol. 1990;292:497–523. | ||
Yu DY, Cringle SJ. Oxygen distribution and consumption within the retina in vascularised and a vascular retinas and in animal models of retinal disease. Prog Retin Eye Res. 2001;20:175–208. | ||
Ahmed J, Braun RD, Dunn R Jr, Linsenmeier RA. Oxygen distribution in the macaque retina. Invest Ophthalmol Vis Sci. 1993;34:516–521. | ||
Nelson DA, Krupsky S, Pollack A, et al. Special report: noninvasive multi-parameter functional optical imaging of the eye. Ophthalmic Surg Lasers Imaging. 2005;36:57–66. | ||
Sutter EE, Tran D. The field topography of ERG components in man. I. The photopic luminance response. Vision Res. 1992;32:433–446. | ||
Hood DC. Assessing retinal function with the multifocal technique. Prog Retin Eye Res. 2000;19:607–646. | ||
Sutter E. The interpretation of multifocal binary kernels. Doc Ophthalmol. 2000;100:49–75. | ||
Sutter EE, Bearse MA Jr. The optic nerve head component of the human ERG. Vision Res. 1999;39:419–436. | ||
Palmowski AM, Sutter EE, Bearse MA Jr, Fung W. Mapping of retinal function in diabetic retinopathy using the multifocal electroretinogram. Invest Ophthalmol Vis Sci. 1997;38:2586–2596. | ||
Raz D, Perlman I, Percicot CL, Lambrou GN, Ofri R. Functional damage to inner and outer retinal cells in experimental glaucoma. Invest Ophthalmol Vis Sci. 2003;44:3675–3684. | ||
Hasegawa S, Ohshima A, Hayakawa Y, Takagi M, Abe H. Multifocal electroretinograms in patients with branch retinal artery occlusion. Invest Ophthalmol Vis Sci. 2001;42:298–304. | ||
Hood DC, Greenstein V, Frishman L, et al. Identifying inner retinal contributions to the human multifocal ERG. Vision Res. 1999;39:2285–2291. | ||
Langrova H, Zrenner E, Kurtenbach A, Seeliger MW. Age-related changes in retinal functional topography. Invest Ophthalmol Vis Sci. 2008;49:5024–5032. |
 © 2014 The Author(s). This work is published and licensed by Dove Medical Press Limited. The
full terms of this license are available at https://www.dovepress.com/terms
and incorporate the Creative Commons Attribution
- Non Commercial (unported, 3.0) License.
By accessing the work you hereby accept the Terms. Non-commercial uses of the work are permitted
without any further permission from Dove Medical Press Limited, provided the work is properly
attributed. For permission for commercial use of this work, please see paragraphs 4.2 and 5 of our Terms.
© 2014 The Author(s). This work is published and licensed by Dove Medical Press Limited. The
full terms of this license are available at https://www.dovepress.com/terms
and incorporate the Creative Commons Attribution
- Non Commercial (unported, 3.0) License.
By accessing the work you hereby accept the Terms. Non-commercial uses of the work are permitted
without any further permission from Dove Medical Press Limited, provided the work is properly
attributed. For permission for commercial use of this work, please see paragraphs 4.2 and 5 of our Terms.