Back to Journals » Diabetes, Metabolic Syndrome and Obesity » Volume 12
TNF-α (−308) Gene Polymorphism and Type 2 Diabetes Mellitus in Ethiopian Diabetes Patients
Authors Ayelign B ![]() , Genetu M, Wondmagegn T
, Genetu M, Wondmagegn T ![]() , Adane G
, Adane G ![]() , Negash M
, Negash M ![]() , Berhane N
, Berhane N ![]()
Received 5 September 2019
Accepted for publication 21 November 2019
Published 28 November 2019 Volume 2019:12 Pages 2453—2459
DOI https://doi.org/10.2147/DMSO.S229987
Checked for plagiarism Yes
Review by Single anonymous peer review
Peer reviewer comments 2
Editor who approved publication: Prof. Dr. Jing Sun
Birhanu Ayelign,1 Meaza Genetu,1 Tadelo Wondmagegn,1 Gashaw Adane,1 Markos Negash,1 Nega Berhane2
1Department of Immunology and Molecular Biology, School of Biomedical and Laboratory Science, College of Medicine and Health Science, University of Gondar, Gondar, Ethiopa; 2Institute of Biotechnology, College of Computational and Natural Science, University of Gondar, Gondar, Ethiopa
Correspondence: Birhanu Ayelign
Department of Immunology and Molecular Biology, School of Biomedical and Laboratory Science, College of Medicine and Health Science, University of Gondar, Gondar, Ethiopa
Email [email protected]
Background: Type 2 diabetes mellitus (T2DM) is a metabolic disorder resulting from insulin insufficiency or function. Predisposing factors for T2DM are mainly genetic and environmental. Genetic polymorphism of cytokines like tumor necrosis factor-alpha (TNF-α) is suggestive of interference with insulin-sensitive glucose uptake and induces insulin resistance that ultimately could lead to T2DM. In this study, we assessed the effect of TNF-α (−308) G/A gene polymorphism and its association with the development of T2DM in an Ethiopian population.
Methods: An institutional-based cross-sectional study was conducted on study subjects with T2DM and non-diabetic healthy controls. DNA was extracted and genotyping was carried out by using amplification refractory mutation system polymerase chain reaction. A genetic-polymorphism on TNF-α (−308) G/A with T2DM was evaluated by logistic regression and Student’s t-test. A P-value Results: In the present study, we observed a significant association between T2DM and TNF-α (−308) gene polymorphism’s GG genotype [χ2 test P = 0.005, OR (95% CI) =2.667 (1.309–5.45d8)]. In contrast, no statistically significant differences were observed in the frequencies of genotypes AA and AG (χ2 test P=0.132 and 0.067, respectively). Moreover, T2DM individuals had higher concentrations of lipid profiles for those carrying the TNF-α (−308) GG genotype as compared to the control group.
Conclusion: TNF-α (−308) genetic polymorphism may be implicated in the genetic susceptibility for, as well as the development of T2DM and lipid metabolism in the Ethiopian population. Therefore, a large-scale study and early screening of TNF-α (−308) genetic polymorphism may help in early management and control of diabetes and related outcomes.
Keywords: TNF-α, T2DM, North West Ethiopia
Background
Diabetes Mellitus (DM) is a chronic disease characterized by impaired metabolism of glucose due to defects in insulin secretion or action.1,2 Globally, the number of adults living with diabetes raised from 108 million in 1980 to 422 million.3 The global prevalence of diabetes is rapidly increasing, rising from 4.7% to 8.5% in the adult population. Accordingly, the magnitude of diabetes in Africa and Ethiopia including Gondar accounts for 7.1%, 3.8% and 2.6%, respectively.3–6 Recently, the burden of diabetes has risen faster in low- and middle-income countries and Type 2 Diabetes Mellitus (T2DM) accounts for more than 90% of the total DM patients.3
Several factors have been attributed to T2DM pathogenesis, of which genetic and environmental factors are the primary factors, and T2DM is also heavily linked to obesity and overweight.7–9 Obesity induces adiposity hypertrophy and changes in stromovascular cell composition to bust pro-inflammatory state which leads to interact adaptive cells with adipose tissue macrophages to modify their activation state.10 The inflammatory and immune-mediated T2DM development as a result of cytokines, including IL-6, TNF-α, IL-1, IL-10 and TGF-β has been also stated as one factor for the development of DM.11 Furthermore, the influence of genetic polymorphisms in pro- and anti-inflammatory cytokine specific genes like TNF-α and IL 10 is the frequently observed risk factor for the development of diabetes.12
Tumor Necrosis Factor-alpha is a pro-inflammatory cytokine that is located in chromosome 6p21.33 within the HLA III region,13,14 and it acts in the regulation of cell proliferation, differentiation and apoptosis. Macrophages are a primary source of TNF-α. It can also be secreted by multiple cells, including T and B cells as well as osteoblasts, smooth muscle cells, endothelial cells, epithelial cells and tumor cells.15,16 Current studies have now demonstrated that TNF-α, which is an NF-kappaB regulated product as well as a potent activator of NF-kappaB,17,18 inhibits insulin receptor (IR) signaling by promoting insulin receptor substrate (IRS) serine phosphorylation that leads to an inhibition of insulin-stimulated tyrosine phosphorylation.19–21 Besides, experimental studies on an animal model have shown that neutralization of TNF increases insulin sensitivity.12,22–24 Despite this, the replacement of nucleotide G by A in the promoter region of the TNF-α gene (−308 G/A) can increase the transcription of the gene. Accordingly, a high gene transcription enhances the production of TNF-α cytokine that leads to the occurrence of T2DM. In addition, homozygous subjects with −308 A/A TNF-α indicate increased levels of fat and lower levels of HDL than homozygous subjects with G allele.23,25 From these, we can consider polymorphic genotype can be associated with an increased frequency of T2DM.12,26 From this, we can understand that there is a gap in the area of the study. Therefore, the aim of this study is to investigate the association between genetic polymorphisms TNF-α (−308 G→A) with T2DM Ethiopian patients and healthy population.
Materials and Methods
Study Design, Period and Participants
A cross-sectional study from September to May 2018 was conducted at the University of Gondar Specialized Hospital Diabetic clinic. For this purpose, 150 participants (75 DM patients with clinically diagnosed and laboratory-confirmed T2DM and 75 healthy controls) were selected by convenient sampling. Participants with confirmed diabetes mellitus or newly diagnosed diabetes using WHO guidelines,27 fasting plasma venous glucose of ≥7mmol/l (126mg/dl) or random plasma venous glucose of ≥11.1mmol/l (200mg/dl), were included. Whereas both groups of participants less than 18 years old, with coronary artery disease, and/or other metabolic disorders, pregnant women and cancer were excluded.
Sample Collection and Processing
Following the acquisition of informed consent socio-demographic data, clinical data and 5 mL of whole blood were collected from each participant. The blood was poured into plane containers and centrifuged after clotting for lipid profile analysis. Serum was kept at −20 °C in sterile circumstances at immunology and molecular laboratory until the analysis was done. Triglyceride, LDL and Cholesterol were determined by means of enzymatic tests using the A25 Bio-system human (German). The normal value of each test was based on the reference of the enzymatic test of the A25 Bio-system human (German) kit. The standard operational procedure was addressed in the pre-analytic, analytic and post-analytic stages of laboratory services which constituted and impacted the overall quality of the laboratory analysis.
DNA Extraction and Genotyping
For this study genomic DNA was extracted from whole blood using salting out method.28 The polymorphism (−308 G/A) in TNF-α gene was amplified and genotyped using thermo cyclic PCR in a 15μl reaction mixture containing 100ng of template DNA, buffer (100 mM Tris, pH 9.0; 500 mM KCl; 15 mM MgCl2; 0.1% gelatin), 200 μM dNTP, 10 pmol of each primer and 1.0 unit Taq DNA polymerase. Each reaction employed a generic antisense primer and one of the two allele-specific sense primers. The primers for SNPs TNF-α (−308) G/A were: forward primer G-5ʹ ATAGGTTTTGAGGGGCATGG-3ʹ, primer A-5ʹ AATAGGTTTTGAGGGGCATGA-3ʹ, reverse primer 5ʹ TCTCGGTTTCTTCTCCATCG-3ʹ. The amplified product was evaluated with 2% agarose gel stained with ethidium bromide and then a UV light gel documentation system was used to observe the band.28,29 The purity of extracted DNA was checked on a Nanodrop spectrophotometer. The DNA yield at 260/280nm between 1.8 and 2.0 was considered as pure.30,31
Statistical Analysis
Data were entered into Epidata 3.1 and checked for completeness and clearance. Data were collected, summarized, tabulated and analyzed using SPSS version 20 software (SPSS, Inc., Chicago, Illinois, USA). The differences in the distribution of genotypes and allele frequencies were analyzed using the Chi-square test. Odds ratios (ORs) and the corresponding 95% confidence interval (95% CIs) were calculated to assess the strength of the association between TNF-α gene polymorphism versus T2DM. A P-value <0.05 was considered as statistically significant. The logistic regression model and Student’s t-test were also applied for comparison of parameters.
Results
To assess the frequency of TNF-α (−308 G/A) gene polymorphism and its association with T2DM, 150 participants (75 T2DM patients and 75 healthy controls) were included. Mean standared deviation (SD) age of the T2DM cases and controls were 55.45
 9.998 and 34.41
 9.012 years, respectively. The sex distributions of males were found to be 47/75 (62.7%) and 41/75 (54.7%) in both study groups (cases and controls), respectively. The mean fast blood sugar (FBS) levels among T2DM cases and controls were also 192.89 mg/dl and 88.03 mg/dl, respectively. With regard to lipid profile, the mean triglyceride (TG), cholesterol and low-density lipoprotein (LDL) level of T2DM case were 192 mg/dl, 191mg/dl, 95 mg/dl, as well 163.59 mg/dl, 163 mg/dl and 60 mg/dl for control groups, respectively. There are statistically significant differences between two groups of serum TG and Cholesterol with P=0.012, 0.014, respectively (Table 1).
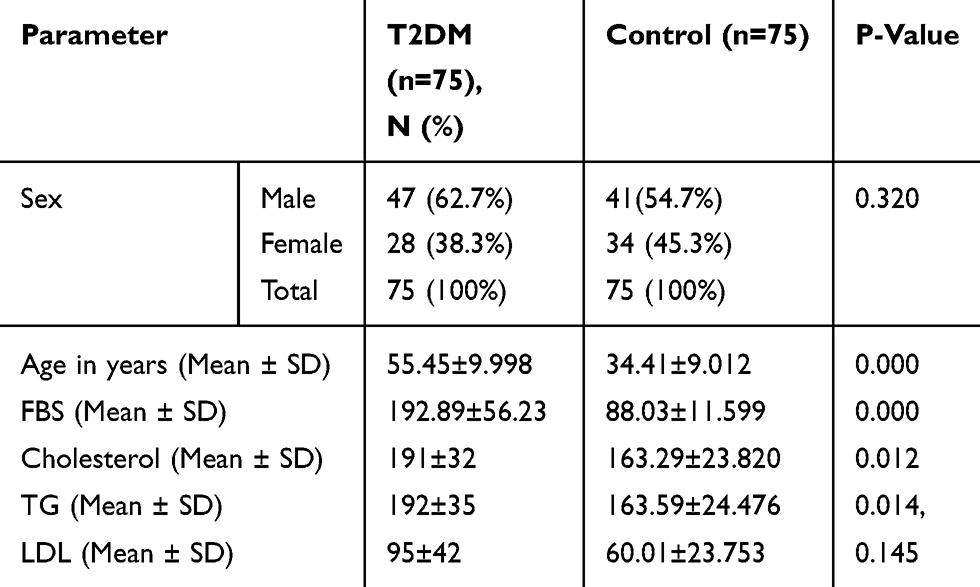 |
Table 1 Socio-Demographic Risk Factors and Biochemical Profiles of the Study Participants, North West Ethiopia, 2018 |
TNF-α −308 (G/A) Genotype and Allelic Distributions in T2DM Patients and Healthy Controls, at the University of Gondar Hospital, 2018
Calculated frequencies of genotype and allelic expression TNF-α gene polymorphism using Hardy Weinberg equilibriums have been shown in Table 2. Among T2DM patients, for TNF-α −308 G/A genetic polymorphism, 45/75 (60%), 24/75 (32%) and 6/75 (8%) were GG, AG and AA genotypes, respectively. Similarly, from 75 healthy controls 36/75 (48%), 27/75 (36%) and 12/75 (16%) were GG, AG and AA genotypes, respectively. Likewise, the allelic frequency of −308*G and −308*A alleles in T2DM patients were 114 (76%) and 36 (24%) respectively; meanwhile allelic frequency of −308*G and −308*A were found to be 90 (60%) and 60 (40%) in healthy controls, respectively [χ2 = 0.004, Fisher exact test=0.002, OR (95% CI) =0.0474]. Besides, with regard to TNF-α (−308) genotype frequencies among case and controls, it was noted that T2DM patients in our study showed a significantly higher frequency of homozygote genotype GG [χ2 P=0.005, fisher’s exact test P=0.005, OR (95% CI) =2.667 (1.309–5.458)]. On the other hand, the frequencies of genotypes AA and AG [χ2p=0.132, fisher’s exact test P=0.208, OR (95% CI) =0.457 and χ2=0.067, fisher’s exact test P=0.066, OR (95% CI) =0.51 (0.248–1.043)], respectively, were not statistically different.
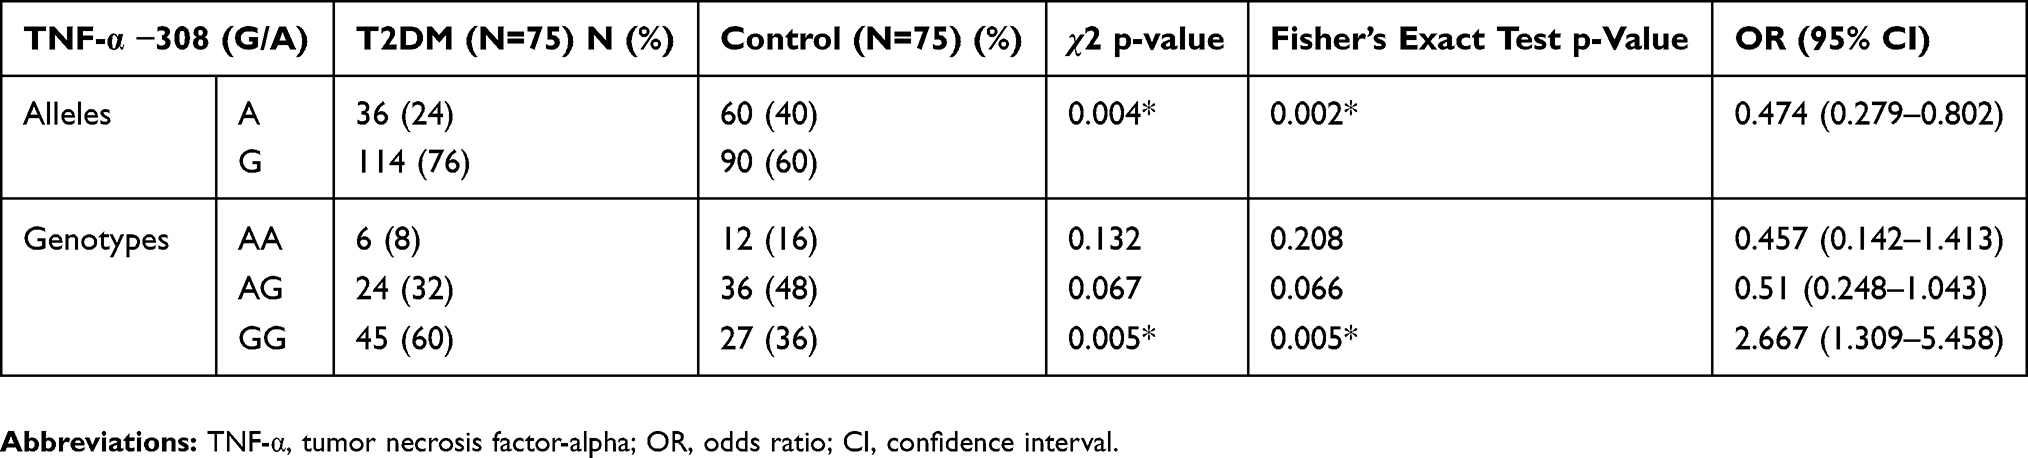 |
Table 2 Frequencies of TNF-α −308 (G/A) Allelic and Genotype Polymorphisms Among Study Participants, North West Ethiopia, 2018 (N= 150) |
Association of TNF-α (−308G/A) Genotype with Biochemical Parameters of T2DM and Healthy Controls
We have summarized the association between TNF-α (−308 G/A) genotype and lipid profile (TG, Cholesterol and LDL) within each of T2DM patients and control groups (Table 3). Moreover, TG, cholesterol and LDL levels in TNF-α (−308) GG genotype (206 mg/dl, 207mg/dl, 92 mg/dl, respectively) were significantly higher than genotype AG (201mg/dl, 188 mg/dl, 96 mg/dl, respectively) and AA (172 mg/dl, 166 mg/dl, 73.5mg/dl, respectively) genotypes in T2DM patients group. Generally, there was a high level of TG, cholesterol and LDL in T2DM than the comparison groups (P= 0.003, P=0.012, P=0.024).
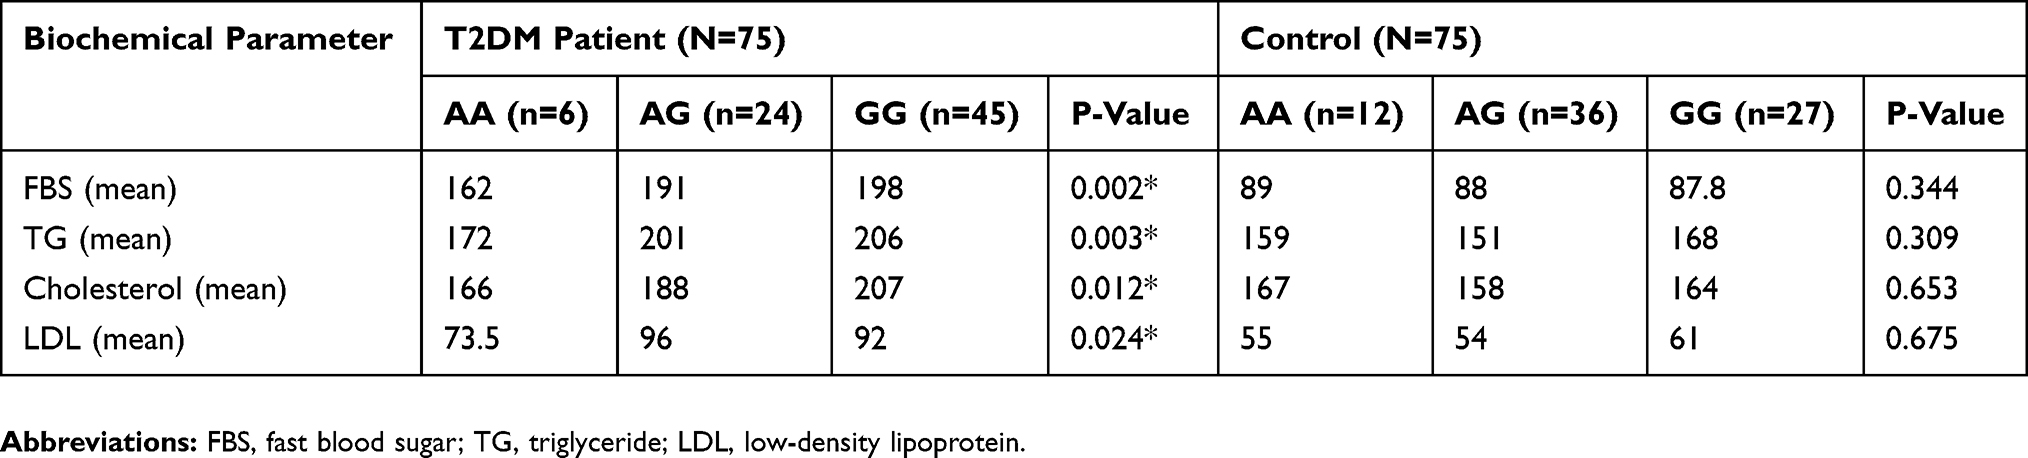 |
Table 3 Association Between Lipid Profiles and TNF-α (−308 G/A) Genotypes in T2DM Patients and Controls |
Discussion
In the present study, we determined the extent of G to A substitution at position −308 TNF-α gene and its association with the development of T2DMand biochemical parameters in an Ethiopian population. Cytokine gene polymorphisms may influence their transcription, levels of production, and could be implicated in inducing susceptibility or resistance to several diseases.32 Findings from several studies have demonstrated that cytokine gene polymorphisms are associated with T2DM and related complications in a context of TNF-α mediator of obesity-linked insulin resistance and resultant of T2DM.33–35 It suggested that a single-nucleotide polymorphism (SNP) in cytokine gene has a specific role in determining diabetes susceptibility.36 TNF-α G/A polymorphism, located on the upstream of the gene at −308, and is known to influence TNF-α plasma level.37 In the present study, TNF-α−308 GG gene polymorphisms showed significant association with lipid metabolism (TG, Cholesterol and LDL) in each group (T2DM patients and control) and within the group. Moreover, TNF-α (−308) GG genotype in TG, cholesterol and LDL were significantly higher than genotype AG and AA in diabetic patients. There was a high level of TG, cholesterol and LDL in T2DM than the comparison groups (P= 0.003, P=0.012, P=0.024). For this reason, we hypothesized that TNF-α GG genotype will increase the expression and production of TNF-α. However, contrary to the authors’ hypothesis, as indicated by Um JY et al, the −308 A allele has been shown to be associated with increased TNF-α expression after in vitro stimulation.38–41 It appears that whether the A allele or the G allele of TNF-α −308 G/A polymorphism is associated with an increased TNF-α production remains to be determined in this Ethiopian population. It is notable that TNF-α production could be influenced by multiple genetic polymorphisms located in the TNF-α gene and/or other immune-related genes. Its production increases plasma lipid metabolism through the inhibition of adipose lipoprotein lipase activity and/or a stimulation of hepatic lipogenesis, induces lipolysis and suppresses free fatty acid (FFA) uptake there by an increasing FFA production will induce hepatic gluconeogenesis opening the door for hyperglycemia.42 An article by Mirhafez et al43 did not show an association of the possession of the GG genotype of the TNF-α gene −308 G/A polymorphism with metabolic syndrome in their study population (P<0.05). Further, in their study, the AA genotype of TNF-α −308 G/A polymorphism was related to an increased level of triglyceride in metabolic syndrome patients, compared to the control group.43 Our study indicated that TNF-α gene promoter −308 G/A polymorphism’s GG genotype was associated with a significantly increased risk of T2DM in an Ethiopian population, but this association remains to be confirmed in larger, independent studies in populations of Ethiopian ancestry, given that the current study had small sample sizes (i.e., only 75 participants in each of T2DN patients and control groups). In previous studies, a study of Kolla et al, had similar findings, such that the GG genotype of TNF-α promoter −308 G/A polymorphism was significantly associated with an increased risk of diabetic neuropathy compared to healthy controls,44 while there are some studies with dissimilar outcomes.23,45,46 The dissimilarity may be due to differences in genetic makeups among different study populations and even variabilities in their environmental risk factors. The logistic regression analysis showed that individuals who had GG genotype at the promoter region of TNF-α at (−308) position have 2.66 times higher risk of developing T2DM when compared to AA and AG genotypes. In addition, we found a significant association between G allele and T2DM (P=0.002). These demonstrate that carriages of the G could be associated with a great risk of T2DM. In the current study, we did not quantify TNF-α serum levels in T2DM patients and control groups, and thus we could not clearly show which TNF gene −308 G/A genotype is associated with an increased TNF-alpha serum level in each of the two study groups. However, in the study population, the G allele is postulated to increase the expression of plasma TNF-α level, which is an important mediator of insulin resistance that might result in diabetes through its ability to inhibit the tyrosine kinase activity of the insulin receptor, interfering with insulin action.37,47 Based on our findings, for G-to-A substitution at position −308 in the TNF-α gene, the GG genotype is more frequently observed in T2DM patients than in healthy controls in the Ethiopian population. However, our study sample sizes are relatively small, and further larger studies are needed to confirm our results. TNF-α is one of the most important pro-inflammatory mediators that could contribute to the development of insulin resistance, and possibly the pathogenesis of T2DM. Consequently, a better understanding of the genetic factors allows clinicians to have an early prediction, screening and diagnosis of T2DM among the Ethiopian population, which eventually could be important in accurate management and reduce DM-related complications. Furthermore, the lack of control of potential cofounders in the logistic regression model was considered as the limitation of the study. In this study, only studied a single SNP, i.e., −308 G/A polymorphism, in the promoter gene of the human TNF gene, and only performed single-SNP analysis on the genetic association of this SNP with T2DM risk was also a limitation. However, there are multiple SNPs located in the TNF gene promoter region besides the −308 G/A polymorphism, which could play important regulatory roles of TNF-α gene transcription, e.g., −238 G/A, −857 C/T, −863 C/A and −1031 T/C promoter polymorphisms.48 Therefore, in addition to the −308 G/A polymorphism, these other promoter polymorphisms of TNF-α could be studied, and haplotype inference based on the multiple linked SNPs residing in the TNF-α gene could be performed, which would provide more valuable genetic information for multiple linked genetic variants than single SNPs,49 and the inferred haplotypes could be applied to conduct haplotype-based association analysis, which could be more informative than single-SNP-based association analysis50 to reveal the causal genetic variant.
Conclusion
In this study, we found that Ethiopian T2DM patients had significantly higher frequencies of GG genotype of TNF-α −308 G/A polymorphism. It is possibly that individuals with GG genotype could develop diabetes faster than their counterparts who carry the AA/AG. Consequently, patients with the GG genotype would develop diabetes faster than their counterparts who have the AA genotype. Our finding also supports the hypothesis that TNF-α −308 G/A polymorphism might play a role in impairing lipid profiles in T2DM patients. Early identification of this genetic marker will help health professionals to provide proper advice and counseling so that the patients could have a regular follow up and modification in lifestyle risk factors and daily diet intakes to protect them from having an early manifestation of T2DM.
Abbreviations
HDL, High-Density Lipoprotein; LDL, low-density lipoprotein; MHC, major histocompatible complex; PCR, polymerase chain reaction; SNP, single-nucleotide polymorphisms; TG, triglyceride; TNF-α, tumor necrotic factor-alpha; T2DM, Type 2 Diabetes Mellitus.
Consent
The authors confirm that all patients provided informed consent forms.
Ethical Approval and Considerations
This project was reviewed and approved by the University of Gondar ethical review committee. Informed written consent was obtained from each study participant before they were asked to provide socio-demographic data and clinical specimens. In the beginning, the objective, risks and benefits associated with this study were briefly explained to each participant using their local language, including the right not to incorporate into the study. Finally, those who provided a written consent were included.
Data Availability
Data supporting these findings are contained within the manuscript and further data can be shared upon reasonable request to the corresponding author.
Author Contributions
Conception of the research idea: BA and NB; All the authors contributed toward data analysis, critically revising the paper, gave final approval of the version to be published, and agreed to be accountable for all aspect of the work.
Disclosure
The authors declare that they have no competing interests in this work.
References
1. Banerjee M, Vats P. Reactive metabolites and antioxidant gene polymorphisms in type 2 diabetes mellitus. Redox Biol. 2014;2:170–177. doi:10.1016/j.redox.2013.12.001
2. Kasper F, Longo H. Harrisons Principle of Internal Medicine 19th Edition. McGraw-Hill Education;2015:3167–3216. (ISBN: 978-0-07-180215-4).
3. WHO. Global Report on Diabetes. World Health Organization; 2016. Available from: https://apps.who.int/iris/bitstream/10665/204871/1/9789241565257_eng.pdf.
4. WHO. Diabetes country profiles 2016. Available from: https://www.who.int/diabetes/country-profiles/en/.
5. Levitt NS. Diabetes in Africa: epidemiology, management and healthcare challenges. Heart. 2008;94(11):1376–1382. doi:10.1136/hrt.2008.147306
6. Nigatu T. Epidemiology, complications and management of diabetes in Ethiopia: a systematic review. J Diabetes. 2012;4(2):174–180. doi:10.1111/jdb.2012.4.issue-2
7. Chen L, Magliano DJ, Zimmet PZ. The worldwide epidemiology of type 2 diabetes mellitus—present and future perspectives. Nat Rev Endocrinol. 2011;8(4):
8. Samsom M, Trivedi T, Orekoya O, Vyas S. Understanding the importance of gene and environment in the etiology and prevention of type 2 diabetes mellitus in high-risk populations. Oral Health Case Rep. 2016;2(1).
9. Sami W, Ansari T, Butt NS, Ab Hamid MR. Effect of diet on type 2 diabetes mellitus: a review. Int J Health Sci. 2017;11(2):65.
10. Kolb H, Mandrup-Poulsen T. An immune origin of type 2 diabetes? Diabetologia. 2005;48(6):1038–1050. doi:10.1007/s00125-005-1764-9
11. Hollegaard M, Bidwell J. Cytokine gene polymorphism in human disease: on-line databases, supplement 3. Genes Immun. 2006;7(4):269–276. doi:10.1038/sj.gene.6364301
12. Banerjee M, Saxena M. Genetic polymorphisms of cytokine genes in type 2 diabetes mellitus. World J Diabetes. 2014;5(4):493. doi:10.4239/wjd.v5.i4.493
13. Baud V, Karin M. Signal transduction by tumor necrosis factor and its relatives. Trends Cell Biol. 2001;11(9):372–377. doi:10.1016/S0962-8924(01)02064-5
14. Locksley RM, Killeen N, Lenardo MJ. The TNF and TNF receptor superfamilies: integrating mammalian biology. Cell. 2001;104(4):487–501. doi:10.1016/S0092-8674(01)00237-9
15. Levine SJ, Larivee P, Logun C, Angus CW, Ognibene FP, Shelhamer JH. Tumor necrosis factor-alpha induces mucin hypersecretion and MUC-2 gene expression by human airway epithelial cells. Am J Respir Cell Mol Biol. 1995;12(2):196–204. doi:10.1165/ajrcmb.12.2.7865217
16. Pociot F, Wilson AG, Nerup J, Duff GW. No independent association between a tumor necrosis factor‐α promotor region polymorphism and insulin‐dependent diabetes mellitus. Eur J Immunol. 1993;23(11):3050–3053. doi:10.1002/(ISSN)1521-4141
17. Hayden MS, Ghosh S. Regulation of NF-κB by TNF family cytokines. Semin Immunol. 2014;26(3):253–266.
18. Liu T, Zhang L, Joo D, Sun S-C. NF-κB signaling in inflammation. Signal Transduct Target Ther. 2017;2:17023. doi:10.1038/sigtrans.2017.23
19. Skolnik EY, Marcusohn J. Inhibition of insulin receptor signaling by TNF: potential role in obesity and non-insulin-dependent diabetes mellitus. Cytokine Growth Factor Rev. 1996;7(2):161–173. doi:10.1016/1359-6101(96)00021-4
20. Kanety H, Feinstein R, Papa MZ, Hemi R, Karasik A. Tumor necrosis factor α-induced phosphorylation of insulin receptor substrate-1 (IRS-1) possible mechanism for suppression of insulin-stimulated tyrosine phosphorylation of IRS-1. J Biol Chem. 1995;270(40):23780–23784. doi:10.1074/jbc.270.40.23780
21. Ishizuka K, Usui I, Kanatani Y, et al. Chronic tumor necrosis factor-α treatment causes insulin resistance via insulin receptor substrate-1 serine phosphorylation and suppressor of cytokine signaling-3 induction in 3T3-L1 adipocytes. Endocrinology. 2007;148(6):2994–3003. doi:10.1210/en.2006-1702
22. Saxena M, Srivastava N, Banerjee M. Association of IL-6, TNF-α and IL-10 gene polymorphisms with type 2 diabetes mellitus. Mol Biol Rep. 2013;40(11):6271–6279. doi:10.1007/s11033-013-2739-4
23. Dalziel B, Gosby AK, Richman RM, Bryson JM, Caterson ID. Association of the TNF‐α− 308 G/A promoter polymorphism with insulin resistance in obesity. Obesity Res. 2002;10(5):401–407. doi:10.1038/oby.2002.55
24. Patel S, Santani D. Role of NF-κB in the pathogenesis of diabetes and its associated complications. Pharmacol Rep. 2009;61(4):595–603. doi:10.1016/S1734-1140(09)70111-2
25. Fernandez-Real J, Gutierrez C, Ricart W, et al. The TNF-α Gene Neo I polymorphism influences the relationship among insulin resistance, percent body fat, and increased serum leptin levels. Diabetes. 1997;46(9):1468–1472. doi:10.2337/diab.46.9.1468
26. Luna GI, Silva I, Sanchez MN. Association between-308G/A TNFA polymorphism and susceptibility to type 2 diabetes mellitus: a systematic review. J Diabetes Res. 2016;2016.
27. WHO. Definition and Diagnosis of Diabetes Mellitus and Intermediate Hyperglycaemia: Report of a WHO/IDF Consultation; 2006. Available from: https://apps.who.int/iris/handle/10665/43588.
28. Gaaib JN, Nassief AF, Al-Assi A. Simple salting-out method for genomic DNA extraction from whole blood. Tikrit J Pure Sci. 2011;16(2):1813–2662.
29. Wang T, Wang L, Zhang J, Dong W. A simplified universal genomic DNA extraction protocol suitable for PCR. Genet Mol Res. 2011;10(1):519–525. doi:10.4238/vol10-1gmr1055
30. Aljanabi SM, Martinez I. Universal and rapid salt-extraction of high quality genomic DNA for PCR-based techniques. Nucleic Acids Res. 1997;25(22):4692–4693. doi:10.1093/nar/25.22.4692
31. Desjardins P, Conklin D. NanoDrop microvolume quantitation of nucleic acids. J Vis Exp. 2010;45:e2565.
32. Trejaut J, Tsai ZU, Lee HL, et al. Cytokine gene polymorphisms in Taiwan. Tissue Antigens. 2004;64(4):492–499. doi:10.1111/j.1399-0039.2004.00287.x
33. Kammoun H, Kraakman M, Febbraio M. Adipose tissue inflammation in glucose metabolism. Rev Endocr Metab Disord. 2014;15(1):31–44. doi:10.1007/s11154-013-9274-4
34. Rodrigues K, Pietrani N, Sandrim V, et al. Association of a large panel of cytokine gene polymorphisms with complications and comorbidities in type 2 diabetes patients. J Diabetes Res. 2015;2015.
35. Yoshioka K, Yoshida T, Takakura Y, et al. Relationship between polymorphisms 804C/A and 252A/G of lymphotoxin-α gene and− 308G/A of tumor necrosis factor α gene and diabetic retinopathy in Japanese patients with type 2 diabetes mellitus. Metabolism. 2006;55(10):1406–1410. doi:10.1016/j.metabol.2006.06.012
36. Bidwell J, Keen L, Gallagher G, et al. Cytokine gene polymorphism in human disease: on-line databases, supplement 1. Genes Immun. 2001;2(2):61. doi:10.1038/sj.gene.6363733
37. Sookoian SC, González C, Pirola CJ. Meta‐analysis on the G‐308A tumor necrosis factor α gene variant and phenotypes associated with the metabolic syndrome. Obes Res. 2005;13(12):2122–2131. doi:10.1038/oby.2005.263
38. Um J-Y, An N-H, Kim H-M. TNF-α and TNF-β gene polymorphisms in cerebral infarction. J Mol Neurosci. 2003;21(2):167–171. doi:10.1385/JMN:21:2:167
39. Wu W-S, McCLAIN KL. DNA polymorphisms and mutations of the tumor necrosis factor-α (TNF-α) promoter in Langerhans cell histiocytosis (LCH). Int J Interferon Cytokine Res. 1997;17(10):631–635. doi:10.1089/jir.1997.17.631
40. Braun N, Michel U, Ernst BP, et al. Gene polymorphism at position −308 of the tumor-necrosis-factor-alpha (TNF-alpha) in multiple sclerosis and it’s influence on the regulation of TNF-alpha production. Neurosci Lett. 1996;215(2):75–78.
41. Wilson AG, Symons JA, McDowell TL, et al. Effects of a polymorphism in the human TNF alpha promoter on transcriptional activation. Proc Natl Acad Sci U S A. 1997;94(7):3195–3199. doi:10.1073/pnas.94.7.3195
42. Chen X, Xun K, Chen L, Wang Y. TNF alpha, a potent lipid metabolism regulator. Cell Biochem Funct. 2009;27(7):407–416. doi:10.1002/cbf.1596
43. Mirhafez SR, Avan A, Pasdar A, et al. Association of TNF alpha promoter G-308A gene polymorphism with increased triglyceride level of subjects with metabolic syndrome. Gene. 2015;568(1):81–84. doi:10.1016/j.gene.2015.05.019
44. Kolla VK, Madhavi G, Reddy BP, et al. Association of tumor necrosis factor alpha, interferon gamma and interleukin 10 gene polymorphisms with peripheral neuropathy in South Indian patients with type 2 diabetes. Cytokine. 2009;47(3):173–177. doi:10.1016/j.cyto.2009.06.007
45. Elsaid A, Helaly MA, Hatata E-SZ, et al. TNF-α-308 and INF-γ+ 874 gene polymorphisms in relation to susceptibility and severity of T2DM among Egyptian cases. Eur J Gen Med. 2012;9(3). doi:10.29333/ejgm/82455
46. Shiau MY, Wu CY, Huang CN, et al. TNF‐α polymorphisms and type 2 diabetes mellitus in Taiwanese patients. Tissue Antigens. 2003;61(5):393–397. doi:10.1034/j.1399-0039.2003.00059.x
47. Brownlee M. Biochemistry and molecular cell biology of diabetic complications. Nature. 2001;414(6865):813. doi:10.1038/414813a
48. Laddha NC, Dwivedi M, Begum R. Increased Tumor Necrosis Factor (TNF)-alpha and its promoter polymorphisms correlate with disease progression and higher susceptibility towards vitiligo. PLoS One. 2012;7(12):e52298. doi:10.1371/journal.pone.0052298
49. Niu T, Qin ZS, Xu X, Liu JS. Bayesian haplotype inference for multiple linked single-nucleotide polymorphisms. Am J Hum Genet. 2002;70(1):157–169. doi:10.1086/338446
50. Stram DO. Multi-SNP haplotype analysis methods for association analysis. Methods Mol Biol. 2017;1666:485–504.
 © 2019 The Author(s). This work is published and licensed by Dove Medical Press Limited. The
full terms of this license are available at https://www.dovepress.com/terms
and incorporate the Creative Commons Attribution
- Non Commercial (unported, 3.0) License.
By accessing the work you hereby accept the Terms. Non-commercial uses of the work are permitted
without any further permission from Dove Medical Press Limited, provided the work is properly
attributed. For permission for commercial use of this work, please see paragraphs 4.2 and 5 of our Terms.
© 2019 The Author(s). This work is published and licensed by Dove Medical Press Limited. The
full terms of this license are available at https://www.dovepress.com/terms
and incorporate the Creative Commons Attribution
- Non Commercial (unported, 3.0) License.
By accessing the work you hereby accept the Terms. Non-commercial uses of the work are permitted
without any further permission from Dove Medical Press Limited, provided the work is properly
attributed. For permission for commercial use of this work, please see paragraphs 4.2 and 5 of our Terms.