Back to Journals » Clinical Ophthalmology » Volume 11
Three-dimensional mapping of peripapillary retinal layers using a spectral domain optical coherence tomography
Authors Hashmani N ![]() , Hashmani S
, Hashmani S
Received 1 September 2017
Accepted for publication 7 November 2017
Published 11 December 2017 Volume 2017:11 Pages 2191—2198
DOI https://doi.org/10.2147/OPTH.S150617
Checked for plagiarism Yes
Review by Single anonymous peer review
Peer reviewer comments 2
Editor who approved publication: Dr Scott Fraser
Video abstract presented by Nauman Hashmani
Views: 952
Nauman Hashmani, Sharif Hashmani
Department of Ophthalmology, Hashmanis Hospital, Karachi, Pakistan
Purpose: To map and view the effects of age, gender, and axial length on seven individual retinal layers around the optic nerve head (ONH).
Methods: We scanned 242 healthy patients using the Spectralis spectral domain optical coherence tomography in an outpatient setting. The layers were observed on the Early Treatment Diabetic Retinopathy Study sectors using the standard Spectralis Family Acquisition Module 6.0.11.0. The center was the ONH, the inner circle (IC) was 1–3 mm away, and the outer circle (OC) was 3–6 mm away. The seven layers were retinal nerve fiber layer (RNFL), ganglion cell layer (GCL), inner plexiform layer (IPL), inner nuclear layer (INL), outer plexiform layer (OPL), outer nuclear layer (ONL), and retinal pigment epithelium (RPE). Additionally, we calculated the mean thickness of two combined layers: inner retinal layer (IRL) and photoreceptor layer (PL). Finally, we measured the mean of the total retinal thickness (TRT).
Results: The TRT was highest at the inferior end in the IC and at the nasal end in the OC. The RPE (p<0.001) and PL (p<0.001) were thicker in males; however, the IRL (p=0.015) was thicker in females. We found that the RNFL (p<0.001, r=0.139), GCL (p<0.001, r=0.116), IPL (p=0.016, r=0.059), INL (p<0.001, r=0.104), OPL (p=0.009, r=0.064), ONL (p<0.001, r=0.157), RPE (p=0.001, r=0.079), IRL (p<0.001, r=0.190), PL (p=0.030, r=0.053), and TRT (p<0.001, r=0.191) correlated negatively with age. The axial length significantly and negatively correlated at the GCL (p=0.003, r=0.093), IPL (p=0.020, r=0.072), INL (p=0.018, r=0.073), ONL (p<0.001, r=0.110), IRL (p=0.003, r=0.092), and TRT (p=0.003, r=0.094). We found poor reproducibility in the IC; however, this was excellent in the OC.
Conclusion: We found significant differences in layers according to age, gender, and axial length. Additionally, reproducibility can be improved by altering the algorithm to account for the ONH parameters.
Keywords: retinal segmentation, optic nerve head, sex, age, gender, interferometry
Introduction
Spectral domain optical coherence tomography (SD-OCT) has quickly established itself as an essential tool in diagnosing various disorders because of its high reproducibility and diagnostic accuracy.1 This technique utilizes interferometry to report the attributes of a three-dimensional structure by using the delay in echo time and the amount of reflected light.2 The machine scans the retina by utilizing the unique clear pathway for light in the eye and provides images of the retina’s three-dimensional structure and its various layers.
With recent advances, it has now become possible to map single retinal layers at both the macula and the optic nerve head (ONH). In fact, several studies have looked at the effects of various demographic variables on these individual layers at the macula.3,4 Other studies have looked at diseased eyes at individual layers. For example, studies looked at the effect of glaucoma on the ganglion cell layer (GCL)5 and the retinal nerve fiber layer (RNFL).6,7 Additionally, work has been done on mapping the peripapillary RNFL in amblyopic eyes.8 However, peripapillary mapping is currently in its infancy and this is the first study to observe the effects of demographic variables on normal eyes at this location. Segmentation at the peripapillary region has the potential to catch diseases that primarily occur at this location at an earlier course.
In our study, we used the newly released software for the Heidelberg SD-OCT machine to analyze the thicknesses of single retinal layers at the ONH. This was assessed in 242 individual patients who presented on an outpatient basis. These patients spanned five age groups. Our main goal was to map the peripapillary retinal layers at the eight ONH sectors as defined by the Early Treatment Diabetic Retinopathy Study (ETDRS). We excluded the center sector as it consisted of the ONH itself. Additionally, we looked at the effects of age, gender, and axial length on these layers. Finally, we observed the reproducibility of these layers at each sector.
Methods
Patients
This was a prospective, cross-sectional and multicenter study in which the data were collected at the two centers of Hashmanis Hospital, Karachi, Pakistan. The Ethics Committee of the Hashmanis Hospital gave approval for conducting the study in accordance with the Declaration of Helsinki. Additionally, a written informed consent was obtained from the patients before administrating the test.
We included patients who claimed to be ophthalmologically healthy and were between the age of 20 and 70 years. One eye per patient was included; in cases where both eyes were eligible, one eye was randomly picked. Ophthalmological examinations at the visit included autorefraction (Topcon KR-800, Japan), best-corrected visual acuity (BCVA) using a Snellen chart, intraocular pressure (IOP) using an air-puff tonometer (Reichert 7CR, Reichert Inc., Depew, NY, USA), dilated fundus examination, slit lamp examination, axial length measurement (Wavelight OB-820, WaveLight, Erlangen, Germany), and a Spectralis SD-OCT exam (Heidelberg Engineering, Germany).
We excluded patients with a refraction >5 diopters (D) or <−6 D, BCVA <0.8, IOP >22 mmHg, any previous ocular surgery, history of cataract, vitreoretinal disease, visual field loss as indicated by the confrontational test, glaucoma, ocular hypertension, amblyopia, evidence of systemic disease, like hypertension or diabetes, or pregnancy.
Each eye was scanned by an experienced OCT operator after dilating the pupil with 1% tropicamide. Several ophthalmologists screened patients for retinal or optic disc changes on dilated fundus exam for inclusion in the study. Additionally, a glaucoma expert examined the color fundus photographs of all patients for evidence of optic disc neuropathy, optic nerve abnormality, or other retinal diseases. Patients with evidence for any of these were excluded.
Measurements on SD-OCT
We used a standard scan protocol in all eyes that were included. We acquired the three-dimensional imaging data using dimensions of 512×496 (horizontal × vertical) a-scans per image. Every scan covered a 6×6 mm area, which was fixated at the ONH. We used the modified Littman’s method to obtain the correct magnification after taking into account the refractive error, corneal radius, and axial length.9 We used only high-quality images with a score of >30 in this study and the Spectralis Family Acquisition Module (SFAM) 6.0.11.0 was used.
Retinal layer measurements
Measurements of individual layers are obtained when a beam of super luminescence diode (SLD) examines the retina to create a set of cross-sectional B-scan images. To obtain the full three-dimensional structural image, 768 B-scans with identical spacing are taken serially. The wavelength of the SLD infrared beam has a mean of 870 nm.
Each scan was checked for appropriateness and excluded if there was any evidence of a mistake. For example, if the lines did not correspond to the retinal layers. If minor errors were present, the software allowed for manual correction. Each eye was first scanned by an operator and then rechecked by a doctor.
We calculated the thickness of each peripapillary layer in each of the nine sectors defined by the ETDRS, as indicated in Figure 1. First, we recorded the thickness in the center, and proceeded to record the thickness in each of the nine sectors for the various retinal layers. The center, however, was the ONH and any value given here was considered false and excluded. The inner ring was ~1–3 mm from the ONH, and the outer ring was 3–6 mm away.
 | Figure 1 The ETDRS sectors around the optic nerve head. |
We calculated the values of the seven retinal layers, as shown in Figure 2. The SFAM measured these layers individually, and the two divisions as a combination of several layers. The single layers measured were RNFL, GCL, inner plexiform layer (IPL), inner nuclear layer (INL), outer plexiform layer (OPL), outer nuclear layer (ONL), and retinal pigment epithelium (RPE). The ONL spanned from the OPL to the external limiting membrane (ELM). The divisions with multiple layers included the inner retinal layer (IRL) and the photoreceptor layer (PL). The IRL spanned from the internal limiting membrane to the OPL and the PL spanned from the ELM to the basement membrane. Finally, a total retinal thickness (TRT) was measured.
 | Figure 2 The retinal layers that were measured are shown. |
Reproducibility
To evaluate for the interobserver reproducibility of measurements, the same scan protocol was employed by two different OCT operators; one patient was scanned twice. This was performed in 50 patients, 25 of whom were male and 25 were female. The mean age for this group was 40.5±14.0 years.
Statistical analysis
We used Google forms to collect our data, which were subsequently imported into the Statistical Package for the Social Sciences (SPSS) v23 (SPSS Inc., Chicago, IL, USA). All subsequent analysis was done on this software. We calculated the mean and SDs using descriptive statistics. The Pearson’s product moment correlation coefficient was used to correlate thickness with age and axial length. A partial correlation was used to calculate an adjusted p-value. Any gender differences were compared using the independent t-test. A linear regression analysis was used on age and axial length. Finally, the coefficient of variation (CV) and the intraclass correlation coefficient (ICC) were used to evaluate for interobserver reproducibility of measurements. We considered a p-value <0.05 to be statistically significant.
Results
Patients
We scanned a total of 307 individuals and included 242. A total of 126 males (52.1%) and 116 females (47.9%) took part with a mean age of 42.0 years and a range of 20–75 years. General characteristics stratified by age are listed in Table 1. Additionally, the mean and SDs of each layer divided by the ETDRS sectors are shown in Table 2.
 | Table 1 General characteristics |
 | Table 2 Retinal thickness by layer |
Excluded patients
A total of 65 patients were excluded from the study. These patients were excluded because of the following: algorithm failure (n=28, 43.1%), evidence of glaucoma (n=14, 21.5%), central serous chorioretinopathy (n=10, 15.4%), disc edema (n=5, 7.7%), optic disc changes (n=3, 4.6%), age-related macular degeneration (n=2, 3.1%), retinitis pigmentosa (n=2, 3.1%), and diabetic retinopathy (n=1, 1.5%).
Thickness of retinal layers
Our data, as seen in Table 2, showed that the thickest point of the RNFL in the inner circle (IC) was the inferior pole. However, the other layers within the IRL, except the OPL, were thickest at the temporal pole, with the OPL being thickest nasally. Despite multiple layers being thicker at the temporal quadrant, the IRL was found to be thickest at the inferior end like the TRT. This coincided with the RNFL layer, which was significantly thicker at this pole when compared to the differences in other layers.
Like the IC, the RNFL at the outer circle (OC) was also thickest at the inferior end. However, the other layers were all thicker at the nasal quadrant.
Gender
We found no difference in the two genders when looking at age (p=0.328), IOP (p=0.453), axial length (p=0.554), and refractive error (p=0.775). Table 3 shows statistically significant differences among genders at the RPE (p<0.001), IRL (p=0.015), and PL (p<0.001). The RPE and the PL were thicker in males while the IRL was thicker in females.
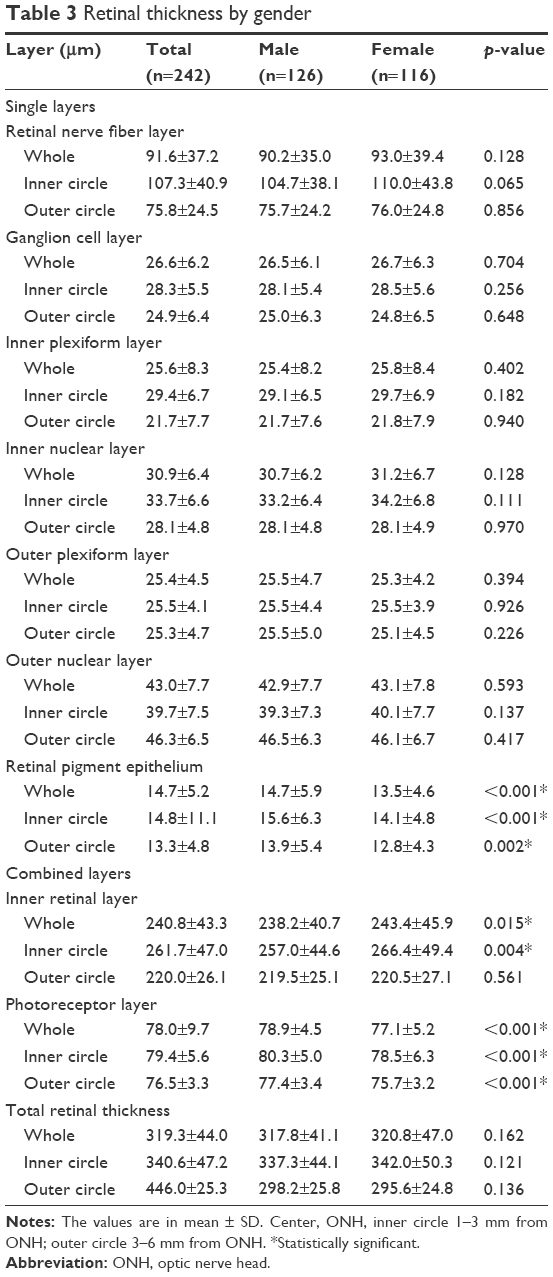 | Table 3 Retinal thickness by gender |
Age and axial length analysis
Table 4 shows that the RNFL (p<0.001), GCL (p<0.001), IPL (p=0.016), INL (p<0.001), OPL (p=0.009), ONL (p<0.001), RPE (p=0.001), IRL (p<0.001), PL (p=0.030), and TRT (p<0.001) correlated negatively with age. Similar results were obtained when adjusting for the axial length.
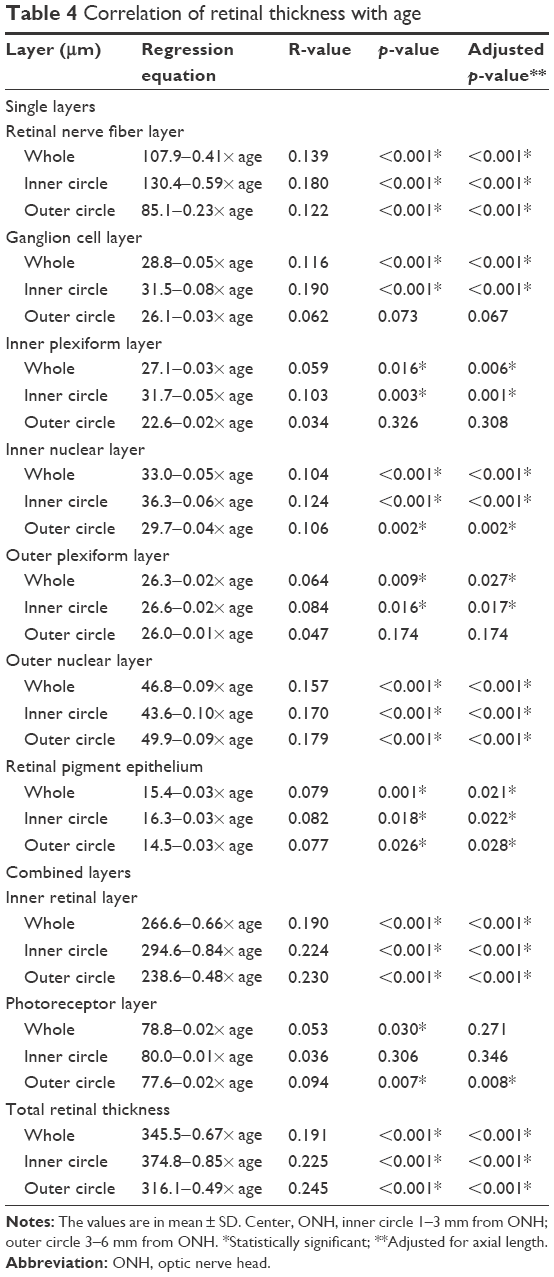 | Table 4 Correlation of retinal thickness with age |
Six layers were negatively correlated with axial length and reached statistical significance: GCL (p=0.003), IPL (p=0.020), INL (p=0.018), ONL (p<0.001), IRL (p=0.003), and TRT (p=0.003). Adjusting the p-values for age showed similar results. The other layers showed no correlation, as shown in Table 5.
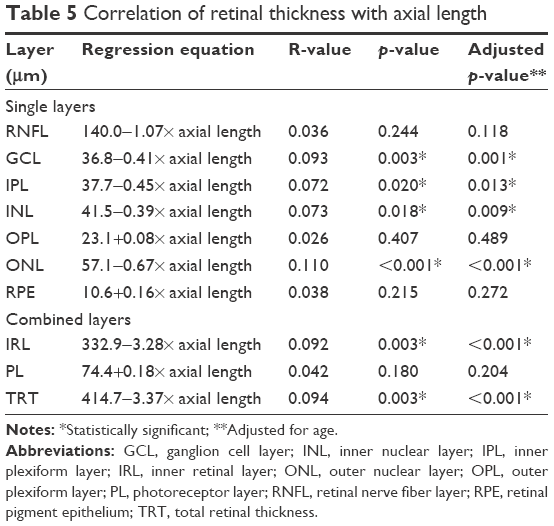 | Table 5 Correlation of retinal thickness with axial length |
Reproducibility
As seen in Table 6, the CVs for the IC ranged from 0.128 to 0.001. Those for the OC ranged from 0.056 to 0.008. For the whole peripapillary area, the CV ranged from 0.184 to 0.014.
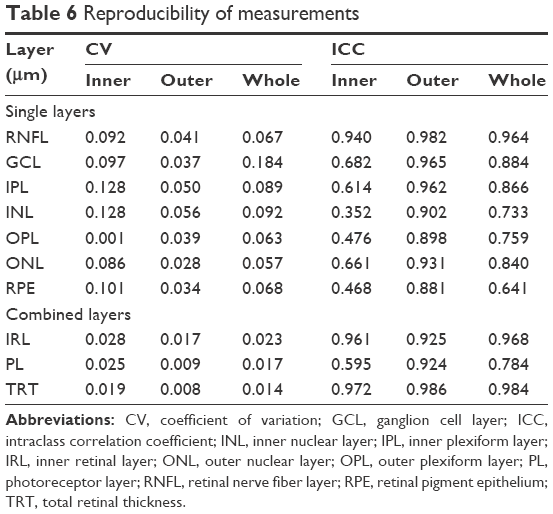 | Table 6 Reproducibility of measurements |
The ICC for the IC ranged from 0.972 to 0.352. Those for the OC ranged from 0.986 to 0.881. For the whole peripapillary area, the ICC ranged from 0.984 to 0.641.
Discussion
Calculating the thickness of various retinal layers can be a useful diagnostic tool to evaluate and monitor retinal diseases. For that to occur, however, studies must evaluate the effects of demographic variables in normal and healthy eyes. Three studies evaluated this at the macula,3,4,10 and others have worked at mainly the RNFL and GCL.8,11,12 Our study is the first to focus on normal eyes and evaluate effects of demographic variables at seven peripapillary retinal layers.
Retinal layer thickness
Our mean TRT was 318.0±35.4 μm, which is similar to previous studies.13,14 Some differences are present, which can be explained by machine variability.13 Also, we found comparable mean RNFL thicknesses when looking at a study performed in India using the same instrument.15 Similarly, when looking at a study performed by Leung et al in the USA, comparable results were obtained at the superior, inferior, and nasal quadrants.11 However, the temporal side was significantly thinner in both samples (70.2±10.3 and 78.3±13.3 μm) when compared to ours (92.0±35.0 μm). The latter study used a Stratus OCT machine, which can account for these differences. It has been reported that the Spectralis machine shows thinner values in all quadrants except the temporal area.16 Interestingly, other studies in the USA using the Spectralis machine reported uniformly thinner values throughout the retina except at the nasal region.17,18 However, our values were divided into ICs and OCs, while all mentioned studies used a mean value for each quadrant.
Gender differences
Studies evaluating the retinal thicknesses have contradictory data; some are consistent with our findings stating no relationship to gender,19–21 while others have found significant differences.22–24 It is valid to note, however, that all the above studies were performed at the macula, which could account for the differences.
Data in the literature regarding the relationship of RNFL to gender are inconsistent as well. Ooto et al3 found a thicker RNFL in females while Won et al10 reported the opposite. Our study found no relationship between the two genders and several studies agree with us.18,25 We recommend further research to evaluate this association. Finally, one previous study looked at differences of the RPE layer at the macula and found no difference between the genders.10 Our study contradicts this finding.
Correlation with age
A significant correlation of age was found with all the retinal layers. Our findings correlate with a similar study performed by Ooto et al,3 although they found a positive correlation with the photoreceptor outer segment layer. Additionally, several studies have correlated age with TRT26 and RNFL27 negatively, like our study. Furthermore, we found the GCL to correlate negatively with age, and previous studies agree with our finding.3,10
Previous histologic studies have demonstrated a loss of neurons in the inner retina because of aging, which accounted for a loss of about 0.3%–0.6% per year.28,29 Similarly, the RNFL lost 0.2% of thickness per year.30 Our study shows similar findings with TRT, IRL, and GCL losses of 0.2, 0.3, and 0.2% per year, respectively. However, the RNFL showed greater losses of 0.5% per year. Additionally, we also found significant losses in the INL and ONL like Ooto et al.3
This study found a significant relationship of the outer retina to age, and other studies disagree with us. Two studies evaluated the central foveal thickness, a layer dominated by the outer retina,27,31 and found no significance. A study by Ooto et al found no consistent relationship between age and the outer retina, as well.3 However, a histologic study by Gao and Hollyfield, which included 35 donor eyes from 17 to 95 years, showed a consistent drop of the RPE rods and cones at the equatorial retina.32 We recommend further evaluation of this relationship.
Correlation with axial length
There is disagreement on whether retinal thickness varies with axial length. One study included high myopes and found a significant negative correlation.33 On the other hand, another study that included a wider variety of myopes found no significance.34 A third study included both hyperopes and myopes and found no significant correlation.26 Our study included both low myopes and hyperopes and found a significant correlation.
Reproducibility
Our study found excellent reproducibility at the outer layers. Additionally, most layers as a whole were reproducible, as well. These findings correlate with previous studies performed at the macula, which found excellent reproducibility in all ETDRS sectors.3,4,17
This paper, however, found poor reproducibility in approximately all layers in the inner ETDRS sector with the exception of RNFL, IRL, and TRT. This can be explained by the encroachment of the ONH into the IC. The central area of the ETDRS sectors accounts for only 1 mm. However, the normal ONH measures larger than this value. A study performed in 60 adults found mean ONH dimensions of 1.88 mm vertically and 1.77 mm horizontally.35 Therefore, if the algorithm accounted for an individual’s ONH size dynamically, we believe that the inner sectors would be highly reproducible, as well.
Algorithm failure
A previous study excluded 19/464 enrolled patients because of algorithm failure (5.0%).3 Our study had a significantly higher rate with 28/307 subjects being rejected (9.1%). Another study by Ishikawa et al excluded OCT images based on image quality; they excluded 144/162 images (88.9%) in normal eyes and 144/222 images (64.9%) in glaucomatous eyes.36 The first study and our study both included only high-quality images and, therefore, are directly comparable. The higher rate of failure in our study can be explained by the algorithm’s naivety to the ONH parameters; if the algorithm does not understand where the nerve ends, it predicts the other layers with less accuracy as well. Therefore, we believe that a smarter software algorithm will reduce this rate.
Study standardization
We had a similar study protocol compared to previous researches evaluating the retinal layers.3,4,10 Most studies evaluating the retinal layers at the macula used a similar refractive range of −6.00 to 5.00 D. Similarly, studies screened for ocular hypertension. Additionally, researchers looked for glaucoma; however, the methods used were different: Ooto et al3 used fundus photographs and the Humphrey field analyzer and Won et al used fundoscopy. The study by LoDuca et al4 simply states that normal eyes were used; however, no further elaboration is provided on screening techniques. Our study screened for glaucoma using fundus photograph images and the Donder’s method for catching visual field loss.
In terms of sample size, there was a wide variation with a range from 15 eyes in LoDuca et al’s4 study to 256 eyes in Ooto et al’s3 study. Ages were similar in all studies with both young and old patients accounted for except in LoDuca et al’s4 study; however, they had a limited sample size, which explains their narrow range. Finally, all studies used the ETDRS maps covering a 6×6 mm map.
Limitations
First, the dimensions of the ONH could not be accounted for as the ETDRS segments were predefined; therefore, variation may have occurred in the IC. The ETDRS sectors have a 1 mm central circle, 1–3 mm IC, and 3–6 mm OC; the ONH encroaches upon the IC.
Second, we could only assess Pakistani adults in one city and results from other places around the world may vary. Finally, those with high myopia could not be assessed; there have been reports of an influence on retinal thickness with high myopia, as previously mentioned.
Conclusion
We mapped thickness of peripapillary retinal layers and observed the effects of three variables on them. We found age, gender, and axial length to significantly affect the various retinal layers. Additionally, we found poor reproducibility of the algorithm on the inner ETDRS sectors, while finding this to be excellent on the outer sectors. We recommend alteration of the algorithm to dynamically map the ONH for better results on the inner ETDRS sectors.
Acknowledgments
We are indebted to Mr Asif Murad for lending his expertise on the OCT machine and his contribution in data collection. Additionally, we would like to thank Mr Faisal Ahmed, Ms Samreen Jahangir, and Mr Faraz Haroon for their immense contribution in data collection. Finally, we would like to thank Dr Azfar Nafees Hanfi for his help in reviewing the fundus photographs. Without the hard work of these individuals, this manuscript would not be possible. The research was funded by the Hashmanis Foundation.
Disclosure
The authors report no conflicts of interest in this work.
References
De Salvo G, Vaz-Pereira S, Keane PA, Tufail A, Liew G. Sensitivity and specificity of spectral-domain optical coherence tomography in detecting idiopathic polypoidal choroidal vasculopathy. Am J Ophthalmol. 2014;158(6):1228–1238. | ||
Schuman J. Spectral domain optical coherence tomography for glaucoma (An AOS Thesis). Trans Am Ophthalmol Soc. 2008;106:426–458. | ||
Ooto S, Hangai M, Tomidokoro A, et al. Effects of age, sex, and axial length on the three-dimensional profile of normal macular layer structures. Invest Ophthalmol Vis Sci. 2011;52(12):8769–8779. | ||
LoDuca AL, Zhang C, Zelkha R, Shahidi M. Thickness mapping of retinal layers by spectral domain optical coherence tomography. Am J Ophthalmol. 2011;150(6):849–855. | ||
Garvin MK, Lee K, Burns TL, Abràmoff MD, Sonka M, Kwon YH. Reproducibility of SD-OCT-based ganglion cell-layer thickness in glaucoma using two different segmentation algorithms. Invest Ophthalmol Vis Sci. 2013;54(10):6998–7004. | ||
Arifoglu HB, Simavli H, Midillioglu I, Berk Ergun S, Simsek S. Comparison of ganglion cell and retinal nerve fiber layer thickness in pigment dispersion syndrome, pigmentary glaucoma, and healthy subjects with spectral-domain OCT. Semin Ophthalmol. 2017;32(2):204–209. | ||
Ferreras A, Pable LE, Garway-Heath DF, Fogagnolo P, García-Feijoo J. Mapping standard automated perimetry to the peripapillary retinal nerve fiber layer in glaucoma. Invest Ophthalmol Vis Sci. 2008;49(7):3018–3025. | ||
Firat PG, Ozsoy E, Demirel S, Cumurcu T, Gunduz A. Evaluation of peripapillary retinal nerve fiber layer, macula and ganglion cell thickness in amblyopia using spectral optical coherence tomography. Int J Ophthalmol. 2013;6(1):90–94. | ||
Bennet AG, Rudnicka AR, Edgar DF. Improvements on Littmann’s method of determining the size of retinal features by fundus photography. Graefes Arch Clin Exp Ophthalmol. 1994;232(6):361–367. | ||
Won JY, Kim SE, Park YH. Effect of age and sex on retinal layer thickness and volume in normal eyes. Medicine (Baltimore). 2016;95(46):e5441. | ||
Leung CK, Chan WM, Yung WH, et al. Comparison of macular and peripapillary measurements for the detection of glaucoma: an optical coherence tomography study. Ophthalmology. 2005;112(3):391–400. | ||
Yi K, Mujat M, Sun W, Park BH, de Boer JF, Chen TC. Peripapillary retinal thickness maps in the evaluation of glaucoma patients: a novel concept. ISRN Ophthalmol. 2011;2011:146813. | ||
Grover S, Murthy RK, Brar VS, Chalam KV. Comparison of retinal thickness in normal eyes using Stratus and Spectralis optical coherence tomography. Invest Ophthalmol Vis Sci. 2010;51(5):2644–2647. | ||
Alamouti B, Funk J. Retinal thickness decreases with age: an OCT study. Br J Ophthalmol. 2003;87(7):899–901. | ||
Mansoori T, Viswanath K, Balakrishna N. Quantification of retinal nerve fiber layer thickness using spectral domain optical coherence tomography in normal Indian population. Indian J Ophthalmol. 2012;60(6):555–558. | ||
Shin H, Cho BJ. Comparison of retinal nerve fiber layer thickness between Stratus and Spectralis OCT. Korean J Ophthalmol. 2011;25(3):166–173. | ||
Wu H, de Boer JF, Chen TC. Reproducibility of retinal nerve fiber layer thickness measurements using spectral domain optical coherence tomography. J Glaucoma. 2011;20(8):470–476. | ||
Alasil T, Wang K, Keane PA, et al. Analysis of normal retinal nerve fiber layer thickness by age, sex, and race using spectral domain optical coherence tomography. J Glaucoma. 2013;22(7):532–541. | ||
Sull AC, Vuong LN, Price LL, et al. Comparison of spectral/Fourier domain optical coherence tomography instruments for assessment of normal macular thickness. Retina. 2010;30(2):235–245. | ||
Grover S, Murthy RK, Brar VS, Chalam KV. Normative data for macular thickness by high-definition spectral-domain optical coherence tomography (spectralis). Am J Ophthalmol. 2009;148(2):266–271. | ||
Chan A, Duker JS, Ko TH, Fujimoto JG, Schuman JS. Normal macular thickness measurements in healthy eyes using stratus optical coherence tomography. Arch Ophthalmol. 2006;124(2):193–198. | ||
Kashani AH, Zimmer-Galler IE, Shah SM, et al. Retinal thickness analysis by race, gender, and age using stratus OCT. Am J Ophthalmol. 2010;149(3):496.e1–502.e1. | ||
Wagner-Schuman M, Dubis AM, Nordgren RN, et al. Race- and sex-related differences in retinal thickness and foveal pit morphology. Invest Ophthalmol Vis Sci. 2011;52(1):625–634. | ||
Adhi M, Aziz S, Muhammmad K, Adhi MI. Macular thickness by age and gender in healthy eyes using spectral domain optical coherence tomography. PLoS One. 2012;7(5):e37638. | ||
Pakravan M, Aramesh S, Yazdani S, Yaseri M, Sedigh-Rahimabadi M. Peripapillary retinal nerve fiber layer thickness measurement by three-dimensional optical coherence tomography in a normal population. J Ophthalmic Vis Res. 2009;4(4):220–227. | ||
Song WK, Lee SC, Lee ES, Kim CY, Kim SS. Macular thickness variations with sex, age, and axial length in healthy subjects: a spectral domain-optical coherence tomography study. Invest Ophthalmol Vis Sci. 2010;51(8):3913–3918. | ||
Sung KR, Wollstein G, Bilonick RA, et al. Effects of age on optical coherence tomography measurements of healthy retinal nerve fiber layer, macula, and optic nerve head. Ophthalmology. 2009;116(6):1119–1124. | ||
Kerrigan-Baumrind LA, Quigley HA, Pease ME, Kerrigan DF, Mitchell RS. Number of ganglion cells in glaucoma eyes compared with threshold visual field tests in the same persons. Invest Ophthalmol Vis Sci. 2000;41(3):741–748. | ||
Repka MX, Quigley HA. The effect of age on normal human optic nerve fiber number and diameter. Ophthalmology. 1989;96(1):26–32. | ||
Budenz DL, Anderson DR, Varma R, et al. Determinants of normal retinal nerve fiber layer thickness measured by Stratus OCT. Ophthalmology. 2007;114(6):1046–1052. | ||
Ooto S, Hangai M, Sakamoto A, et al. Three-dimensional profile of macular retinal thickness in normal Japanese eyes. Invest Ophthalmol Vis Sci. 2010;51(1):465–473. | ||
Gao H, Hollyfield JG. Aging of the human retina. Differential loss of neurons and retinal pigment epithelial cells. Invest Ophthalmol Vis Sci. 1992;33(1):1–17. | ||
Lam DS, Leung KS, Mohamed S, et al. Regional variations in the relationship between macular thickness measurements and myopia. Invest Ophthalmol Vis Sci. 2007;48(1):376–382. | ||
Lim MC, Hoh ST, Foster PJ, et al. Use of optical coherence tomography to assess variations in macular retinal thickness in myopia. Invest Ophthalmol Vis Sci. 2005;46(3):974–978. | ||
Quigley HA, Brown AE, Morrison JD, Drance SM. The size and shape of the optic disc in normal human eyes. Arch Ophthalmol. 1990;108(1):51–57. | ||
Ishikawa H, Stein DM, Wollstein G, Beaton S, Fujimoto JG, Schuman JS. Macular segmentation with optical coherence tomography. Invest Ophthalmol Vis Sci. 2005;46(6):2012–2017. |
 © 2017 The Author(s). This work is published and licensed by Dove Medical Press Limited. The
full terms of this license are available at https://www.dovepress.com/terms
and incorporate the Creative Commons Attribution
- Non Commercial (unported, 3.0) License.
By accessing the work you hereby accept the Terms. Non-commercial uses of the work are permitted
without any further permission from Dove Medical Press Limited, provided the work is properly
attributed. For permission for commercial use of this work, please see paragraphs 4.2 and 5 of our Terms.
© 2017 The Author(s). This work is published and licensed by Dove Medical Press Limited. The
full terms of this license are available at https://www.dovepress.com/terms
and incorporate the Creative Commons Attribution
- Non Commercial (unported, 3.0) License.
By accessing the work you hereby accept the Terms. Non-commercial uses of the work are permitted
without any further permission from Dove Medical Press Limited, provided the work is properly
attributed. For permission for commercial use of this work, please see paragraphs 4.2 and 5 of our Terms.