Back to Journals » Journal of Pain Research » Volume 12
Thermal and mechanical quantitative sensory testing values among healthy African American adults
Authors Powell-Roach KL ![]() , Yao Y, Rutherford JN, Schlaeger JM
, Yao Y, Rutherford JN, Schlaeger JM ![]() , Patil CL
, Patil CL ![]() , Suarez ML, Shuey D, Angulo V, Carrasco J, Ezenwa MO, Fillingim RB, Wang ZJ, Molokie RE, Wilkie DJ
, Suarez ML, Shuey D, Angulo V, Carrasco J, Ezenwa MO, Fillingim RB, Wang ZJ, Molokie RE, Wilkie DJ ![]()
Received 11 April 2019
Accepted for publication 9 July 2019
Published 9 August 2019 Volume 2019:12 Pages 2511—2527
DOI https://doi.org/10.2147/JPR.S211855
Checked for plagiarism Yes
Review by Single anonymous peer review
Peer reviewer comments 2
Editor who approved publication: Dr Katherine Hanlon
Keesha L Powell-Roach,1 Yingwei Yao,2 Julienne N Rutherford,3 Judith M Schlaeger,3 Crystal L Patil,3 Marie L Suarez,4 David Shuey,4 Veronica Angulo,4 Jesus Carrasco,4 Miriam O Ezenwa,2 Roger B Fillingim,1 Zaijie J Wang,5 Robert E Molokie,5–7 Diana J Wilkie1,2
1Department of Community Dentistry and Behavioral Science, College of Dentistry, University of Florida, Gainesville, FL, USA; 2Department of Biobehavioral Nursing Science, College of Nursing, University of Florida, Gainesville, FL, USA; 3Department of Women, Children and Family Health Science, College of Nursing, University of Illinois at Chicago, Chicago, IL, USA; 4Department of Biobehavioral Health Science, College of Nursing, University of Illinois at Chicago, Chicago, IL, USA; 5Department of Biopharmaceutical Sciences, College of Pharmacy, Cancer Center, University of Illinois at Chicago, Chicago, IL, USA; 6Division of Hematology/Oncology, University of Illinois at Chicago College of Medicine, Chicago, IL, USA; 7Department of Hematology/Oncology, Jessie Brown Veteran’s Administration Medical Center, Chicago, IL, USA
Purpose: Only a few studies have reported quantitative sensory testing (QST) reference values for healthy African Americans, and those studies are limited in sample size and age of participants. The study purpose was to characterize QST values in healthy, pain-free African American adults and older adults whose prior pain experiences and psychological status were also measured. We examined the QST values for differences by sex, age, and body test site.
Patients and methods: A cross-sectional sample of 124 pain-free African American adults (age 18–69 years, 49% female) completed demographic and self-reported pain, fatigue and psychosocial measures. QST was performed to obtain thermal and mechanical responses and associated pain intensity levels.
Results: We found thermal detection values at the anterior forearm were (29.2 °C±1.6) for cool detection (CD) and (34.5 °C±1.2) for warm detection (WD). At that site the sample had cold pain threshold (CPTh) (26.3 °C±5.0), heat pain threshold (HPTh) (37.8 °C±3.6), and mechanical pain thresholds (MPTH) (16.7±22.2 grams of force, gF). There was a significant between sex difference for WD, with women being more sensitive (q=0.027). Lower body sites were less sensitive than upper body sites across all thermal modalities (q<0.003), but not for the mechanical modality.
Conclusion: The QST values from this protocol at the anterior forearm indicate that the healthy African American adults had average thermal pain thresholds close to the temperature of adaptation and average MPTh under 20 gF. Differences in responses to thermal and mechanical stimuli for upper verses lower body were consistent with prior research.
Keywords: quantitative sensory testing, QST, PROMIS, pain, healthy, African Americans
Introduction
Studies of quantitative sensory testing (QST) in sickle cell disease (SCD) showed that adequate reference values for patients’ commonly reported pain sites are unavailable from healthy pain free African Americans, which limits interpretation of results.1–5 Most studies of healthy African Americans include QST values for the anterior forearm, but patients with SCD report pain at sites all over their bodies. Furthermore, in contrast to the demographics of patients with SCD,6–9 most previous QST studies of healthy African American adults were based on relatively small samples10 of primarily young adults2,5,11 and their past pain experiences or psychological status were not reported. Although a few studies included older adults,5,12–14 none included sampling plans balanced by age and sex. The lack of sufficient QST data for healthy African American adults, especially older adults, is a barrier to research needed to inform healthcare professionals who treat pain and other somatosensory disorders in this population. The purpose of our study was to address this gap by characterizing thermal and mechanical QST values in a sample of healthy African American adults whose prior pain experiences and psychological status were also documented.
Racial and ethnic disparities are pervasive in health care.15 Unrelieved pain among African Americans leads to unnecessary suffering, delayed healing, functional disability, increased length of hospital stays, and lost school and work days.16–18 Complicating the problem are the racial and ethnic differences in individual responses to pain.4,6,10,19–21 These differences are often misunderstood by health care providers because it is not known how healthy African American adults and older adults respond to standardized painful stimuli.15,17,22,23 To understand more fully the physiology of pain in African Americans and to develop personalized treatment plans, accurate QST values are needed from healthy African Americans whose past pain experiences and psychological status are documented.
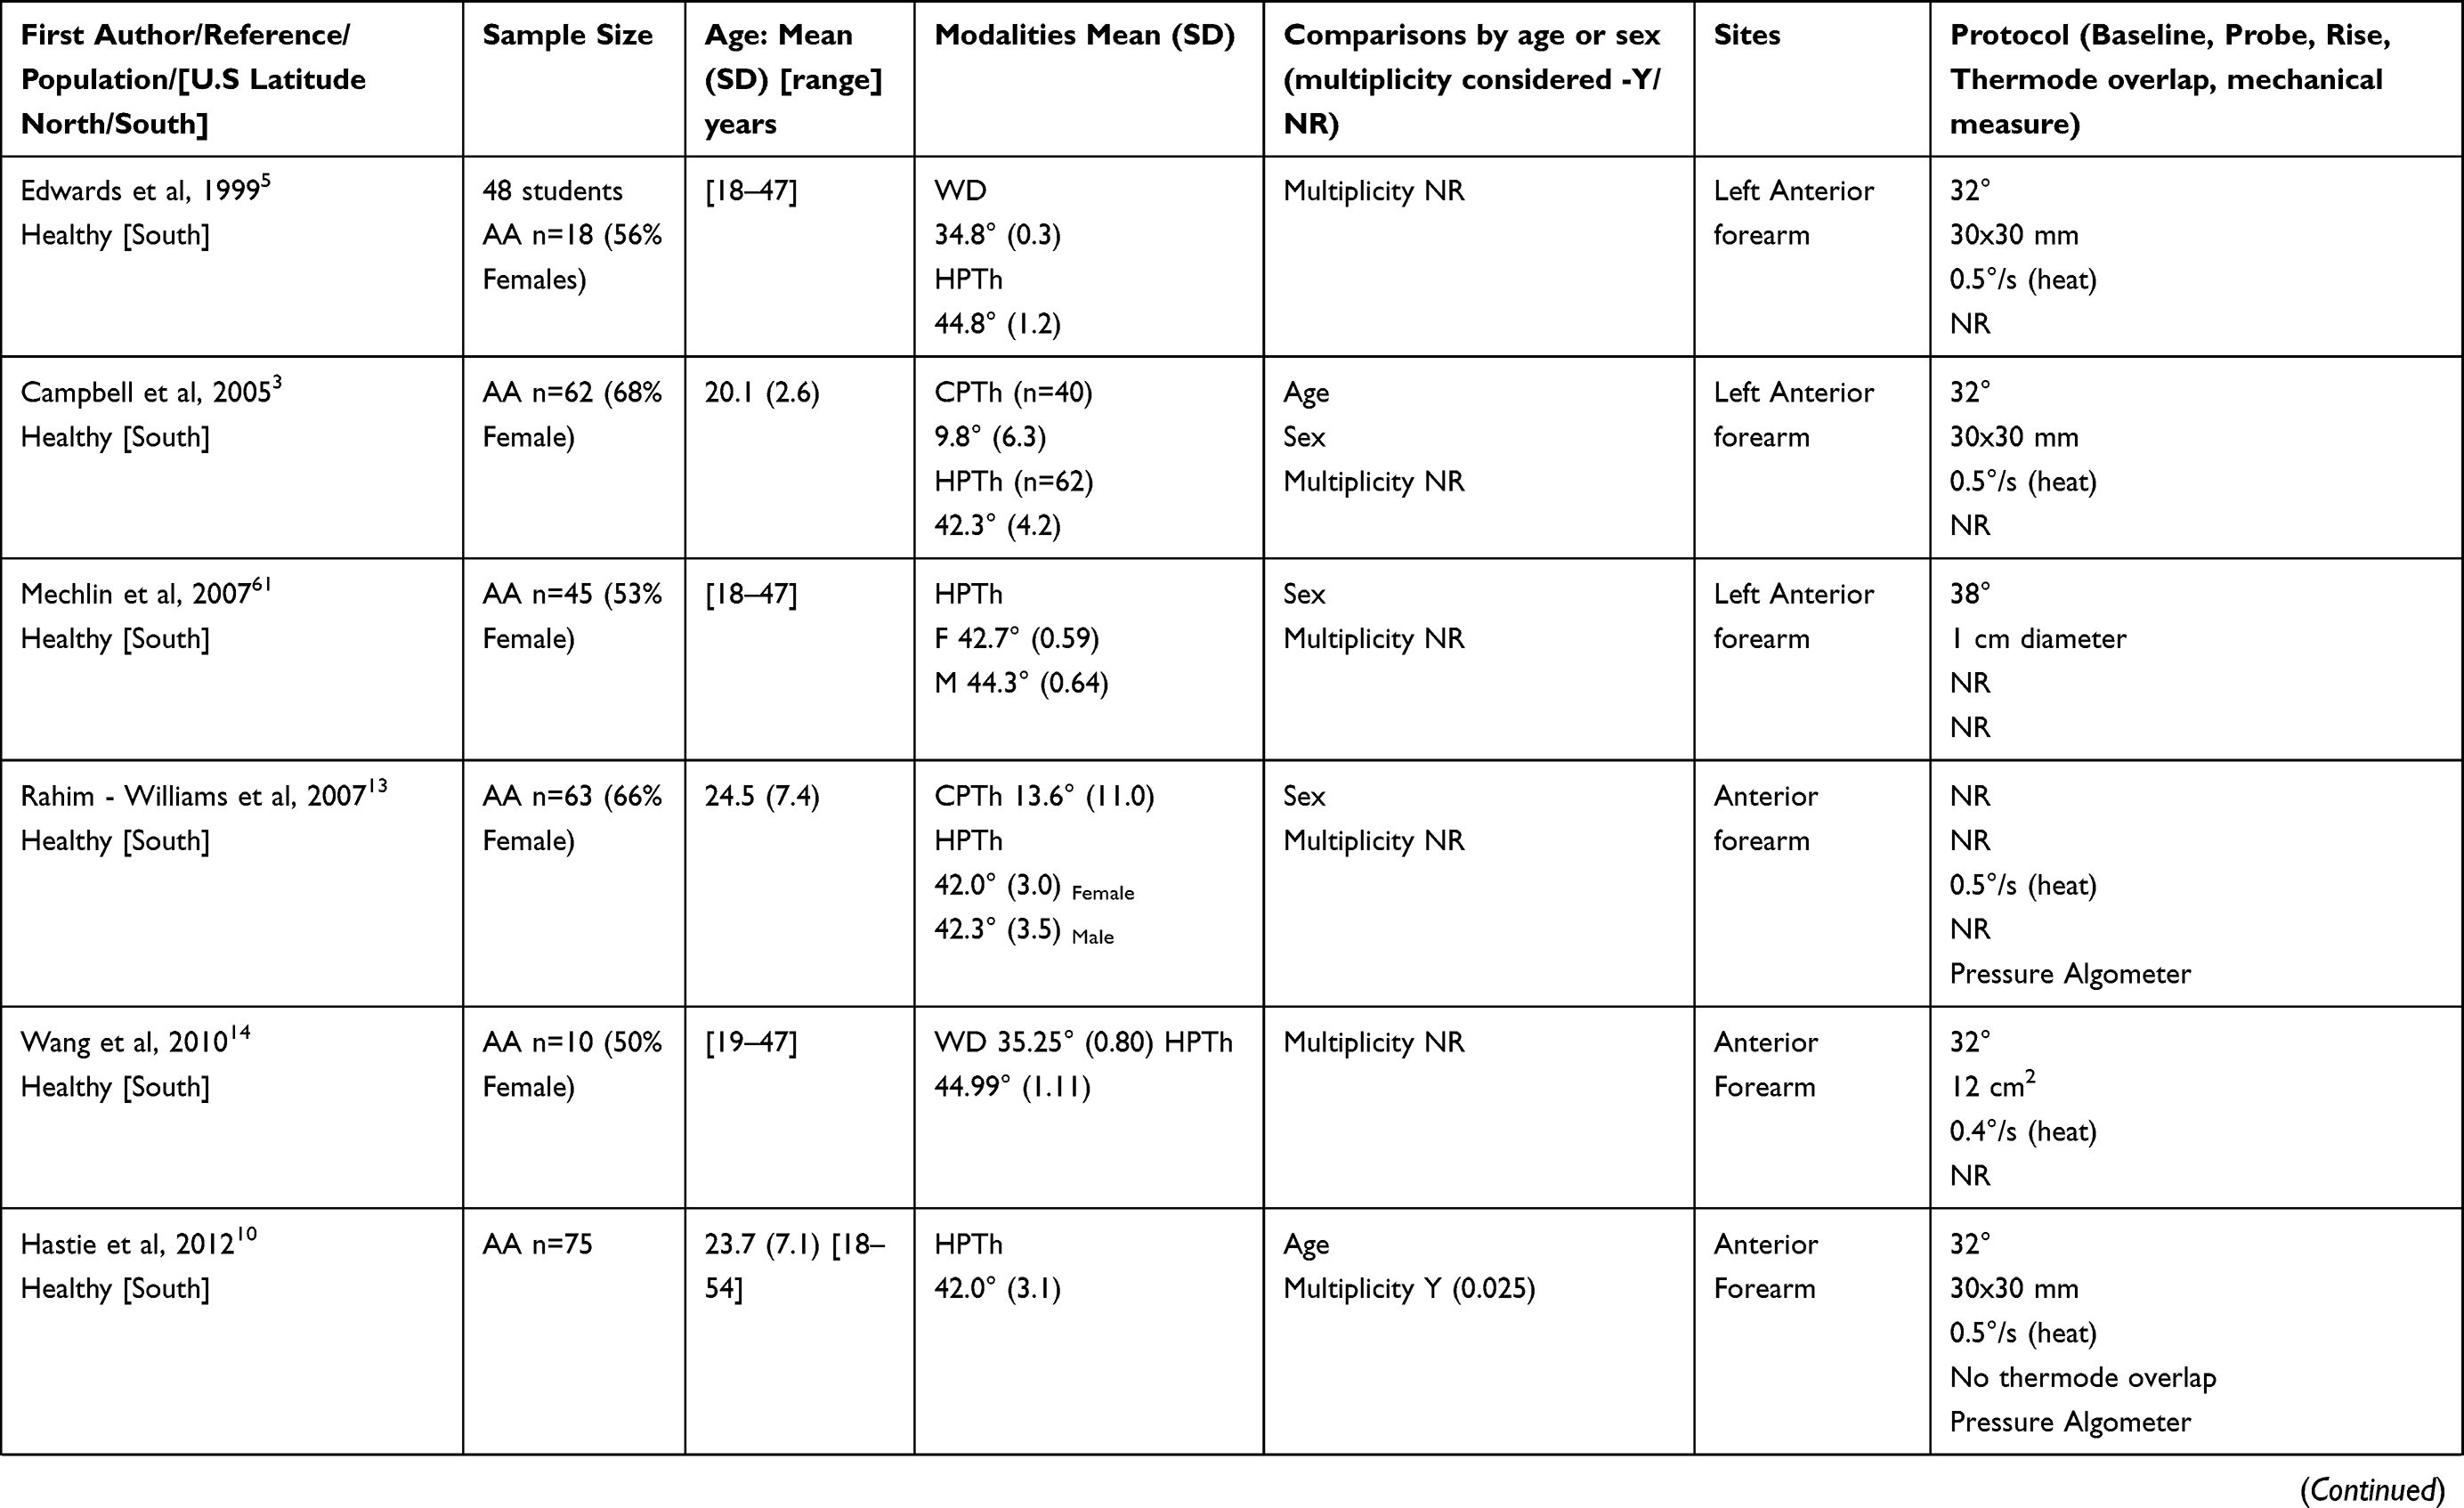
QST values for healthy adults differ among race, ethnic groups, age, sex, body location and psychological status.3,4,24 African Americans are generally more sensitive to thermal heat than Non-Hispanic Whites (NHW) and Asians.3,5,6,19,25–27 Older adults typically show decreased sensitivity to brief, cutaneous pain stimuli but increased sensitivity to tonic, deep pain stimuli.9,19,28–30 Men generally have a higher pain threshold than women.26,31–33 Compared to lower body sites, upper sites are more sensitive to thermal and mechanical stimuli.33,34 Fatigue, anxiety and depression typically are associated with increased reports of pain.35–38 Most studies of healthy African Americans included college students and siblings of SCD patients with unknown trait status. Table 1 shows that few were balanced by sex and age, and most tested only the anterior forearm. None of these studies included past pain experience or psychological status. Therefore, examination of these factors in a larger sample is needed to support QST research in pain conditions experienced by African Americans, such as SCD.
 |  |
 |
Table 1 QST thermal threshold values for African Americans (AA) using the limits protocol on the medoc TSA |
The intent of our study was to fill a gap in the literature regarding QST values for healthy African American adults that will contribute to understanding of pain and somatosensory function in African Americans. In a large cohort of pain-free, healthy African American adults whose past pain experiences and current psychological status were known, our study aim was to determine thermal and mechanical QST values and compare those values at the anterior forearm by age and sex. We also determined the values for 5 other body sites and compared the values for differences by testing site location (upper body versus lower body).
Materials and methods
Design and participants
This cross-sectional study was approved by the Institutional Review Boards at the University of Illinois at Chicago (UIC) and University of Florida. All participants provided written informed consent. This study was conducted in accordance with the Declaration of Helsinki. This sample was intended to serve as the age-, sex- and site-matched controls for a QST study in a sample of individuals with SCD, whose proclivity for acute vaso-occlusive episodes necessitated a protocol focused on stimuli that a pilot study demonstrated was safe.7
Recruitment efforts focused on obtaining equal numbers of males and females and equal numbers of younger adults and older adults. Once the quota was filled for an age/sex group, recruitment for that group ended. The participants were healthy, pain-free adults who self-identified their race as Black/African American at a screening interview and via the demographic questionnaire. All participants verbally reported their race during initial screening. They also reported race and ethnicity in the demographic questionnaire. If they reported Black/African American during screening and in the questionnaire, their data were used in the analysis. Per NIH guidelines, we documented both race and ethnicity. Therefore, individuals who reported race as Black/African American and ethnicity as Hispanic were included. Other inclusion criteria were: English fluency in speaking and reading and age ≥18 years. Exclusion criteria included: diabetes mellitus, polyneuropathy, hypertension, SCD, cancer, history of chronic pain, being legally blind, inability to complete study measures, use of prescription pain medications or recreational drugs, and report of acute pain within the past 48 hrs.
Volunteers were recruited from the UIC campus, surrounding communities, churches, local sororities, fraternities, community organizations, by word of mouth, flyers, and social media. The study was conducted at the UIC College of Nursing with 125 individuals who gave informed consent and completed the measures. One participant, who passed verbal screening criteria, was removed from the study because on the demographic questionnaire she electronically reported race as Asian and parents as being born in India.
Measures
Quantitative sensory testing
We used well-validated measures for the thermal and mechanical QST.3 The testing protocol was consistent with the EFNS (European Federation of Neurological Societies) recommendations for testing Aβ, A-delta, and C fiber function.39 We included QST measures for 6 modalities: cool detection (CD), warm detection (WD), mechanical sensation detection, cold pain threshold (CPTh), heat pain threshold (HPTh), and mechanical pain threshold (MPTh). The body sites, stimulus modalities, and QST measures used in this study were selected based upon common pain sites found in SCD samples and modalities that would, for ethical reasons, minimize risk of pain crisis.7 These values were intended to serve as comparators for studies with a similar protocol in pain conditions affecting African Americans such as SCD.
Thermal
The Medoc TSA-II sensory testing system is a precise, computer-controlled device capable of generating and documenting responses to highly repeatable thermal stimuli, such as cool detection, warm detection, cold-induced pain, and heat-induced pain. The TSA-II delivers quantitative assessment of small caliber sensory nerve function and was used to identify thermal detection and pain thresholds.40,41
We conducted the study in a private temperature-controlled room. We used the TSA-II thermode (30 × 30 mm) that was placed on the skin to deliver standardized stimuli for determination of CD, CPTh, WD, and HPTh.40 To avoid tissue damage, we used the limits protocol, which had a predetermined cutoff temperature for all trials, 50 ºC for heat and 0 ºC for cold. For WD and HPTh, the temperature increased from a baseline of 32 ºC (adaptation temperature) at a rate of 0.5 ºC per second until the participants pressed a button to indicate when they first detected warmth or heat pain, respectively at which time the stimulus returned to 32 °C. CD and CPTh were evaluated by decreasing the temperature from the baseline of 32 ºC at a 0.5 ºC per second rate until the participants pressed a button to indicate when they first detected a cool sensation or cold pain, respectively.40 There was a minimum of a 30-second inter-stimulus interval between test repetitions, which were conducted at non-overlapping sites. All tests included at least three repetitions, but additional trials were conducted if the initial three trials differed by more than 2 °C, up to a maximum of 5 trials.3 The value for a site was the average of the three closest readings. Participants verbally indicated the intensity of the pain they felt after the HPTh trials and again after the CPTh trials.
Mechanical
QST was conducted for mechanical detection and pain threshold using standardized calibrated von Frey monofilaments (Four D Rubber Co. Ltd). These filaments are measuring devices calibrated to bend at a set amount of force depending on the thickness of the filament. To ensure accurate testing of the detection threshold and pain threshold, the filament was placed perpendicular to the area being tested and pressure applied until the filament showed an “s-shaped” bending pattern.40 The contact time to the surface of the skin was approximately one second. Seven filaments were used in sequence, from lightest to heaviest, starting with 3.84 (0.6 grams, g) and ending with 5.88 (60.0 g). These filaments were selected based on previous studies that provided non-painful sensations in all patients and a painful sensation in some patients as per the EFNS protocol.39
Mechanical detection was defined as the lowest filament force at which the participant reported any sensation, and mechanical pain threshold was defined as the filament force at which the participant first reported pain. Three trials for each filament were conducted at non-overlapping sites, with the average of the three trials used for data analysis. The participants verbally indicated if they felt the filament and then reported if the sensation felt painful. If the participant reported pain as a result of a stimulus, the testing at that body site was stopped and the participants verbally indicated the intensity of the pain they felt.
Symptom and psychosocial measures
PAINReportIt
PAINReportIt is a computerized version of the McGill Pain Questionnaire (MPQ) items. The MPQ is a valid and reliable measure of pain.42 Equivalence between the computerized and the paper and pencil versions of the MPQ have been reported.43–45 It includes items for reporting previous pain experiences (eg, worst toothache, headache and stomachache). In this study we were examining the function of ascending neuronal pathways because findings from previous studies in patients with sickle cell disease (SCD) have shown that there may be a neuropathic component to SCD.46 Throughout the lifespan, individuals may experience different types of common painful conditions, like a toothache, headache or stomachache and the relative magnitudes of common pain can be recalled when individuals are asked to report their worst common pain in comparison to an acute or chronic painful condition, like SCD or cancer pain.47,48 Therefore, previous pain experiences from worst toothache, headache and stomachache may be used as a guide to show that individuals recognize when pain is severe in comparison to reports of pain from QST testing. This self-report pain assessment tool is used to examine pain outcome measures without any additional subject burden.49
Pain intensity number scale (PINS)
The PINS measure provides ratio level pain intensity data,50–52 scaled between 0 (“no pain”) and 10 (“pain as bad as it could be”), about the participant’s level of pain now and past common pain experiences (ie, worst toothache, headache, and stomachache).51,52 Concurrent and construct validity53 have been reported for the PINS tool that has standardized instructions.50
PROMIS fatigue, depression and anxiety
The Patient-Reported Outcomes Measurement Information Symptom Measures System (PROMIS) was designed to measure physical, mental and social health factors of individuals with chronic conditions.54 The PROMIS Fatigue short form is a 7-item tool used to measure the impact of fatigue in the past seven days. The PROMIS Depression bank is comprised of 8 items and the PROMIS Anxiety bank is comprised of 7 items.55 The Depression scale focuses on negative moods, views of self, social cognition, and somatic systems (rapid heartbeat, dizziness).56 The Anxiety scale focuses on fear, anxious misery, heightened arousal, and somatic symptoms.56 These tools have a 5-point Likert scale, where the responses range from 1= “never” to 5= “always”.57 Scores are obtained by summing the items with the mean normalized at 50 and a standard deviation of 10.57 Higher scores are consistent with increased fatigue, depression, or anxiety. Cronbach’s alphas for depression, anxiety, and fatigue were 0.96, 0.95, and 0.83, respectively.58
Demographics
Demographics were collected to provide sample characteristic information. Specifically, we captured the participant’s age, race, ethnicity, and sex.
Procedures
Using the TSA-II and von Frey filaments, an internationally recognized QST expert trained all staff members in the QST procedures. Staff members practiced the protocol until they performed it with high fidelity, and the project director observed them periodically for adherence to the study protocol.
Data collection was scheduled at times convenient to participants, including occasional evening and weekend appointments, and occurred in a temperature-controlled room, adequate for the QST protocol. After written consent was obtained, participants used PAINReportIt to provide demographic information, complete self-report pain questionnaires to verify that they did not have pain and report their previous pain experiences (worst toothache, headache, and stomachache). In addition, they completed the PROMIS measures (fatigue, depression, and anxiety). Then QST procedures occurred with the participant seated on a comfortable leather recliner, the seat back positioned at approximately 45º, for easy access to the anterior forearm.
Prior to QST procedures, each participant was trained on QST testing procedures at a practice site (anterior forearm). We emphasized to them that pain scale was from 0 to 10, where 0 is “no pain” and 10 was ”pain as bad as it could be”, and could be described as any number in between (therefore, on a continuum). During training, we instructed them to give their responses when they “FIRST” detected the sensation. They were instructed to press the button when the thermal sensation “FIRST” felt warm/cool, and press the button when the cold/hot sensation “FIRST” felt painful. They had visual cues for each response task with written instructions to maintain their focus on the specific task. They also indicated if they felt the von Frey filament and if the sensation was painful. We asked patients not only to verbalize and demonstrate understanding of the study procedures since their behavior was important to study validity.
Once the training and practice were completed, QST testing began at the other sites. QST values were obtained across the entire sample from a combination of six sites total: three upper extremity (left or right: anterior forearm, posterior forearm, and upper arm lateral) and three lower extremity lower leg sites (left or right: lateral, medial, posterior) (Figure 1). To reduce participant burden, each participant was tested at only three sites, no more than one site per limb. All participants were tested at the anterior forearm site and two other sites as determined by a random sampling list that was stratified by age, gender and included at least one lower extremity site. Thermal testing was completed first followed by mechanical testing. The same protocol was used for all participants.
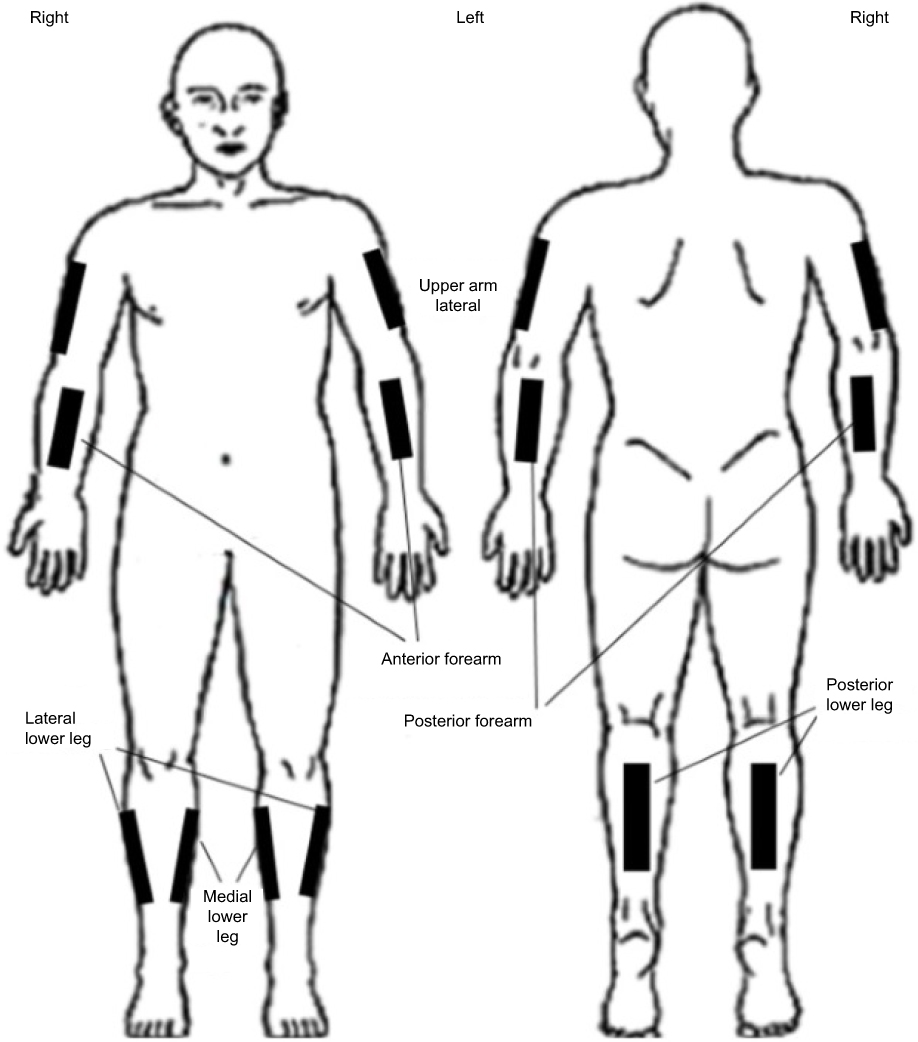 |
Figure 1 Body sited used for QST testing: three upper extremity (left or right: anterior forearm, posterior forearm, and upper arm lateral) and three lower extremity lower leg sites (left or right: lateral, medial, posterior). |
Using the von Frey filament, starting at 0.6 g of force, the participant was asked to report when they first felt a sensation and the strength of the filament was recorded. As with the EFNS protocol, each test site was tested with three repetitions for each filament. We tested the filaments in increasing order of force and testing stopped when the participant reported a force as being painful for any one of the repetitions.
After each QST thermal or mechanical pain threshold test, the participant used the PINS to rate the intensity of the perceived pain. Participants were compensated $50 to cover the cost of transportation, travel, and subjects’ time to complete the study measures. Payment was rendered once all testing was completed.
Statistical analysis
Relevant descriptive statistics for various measures, including mean, standard deviation, range, frequency, and percentage, were obtained. The data for the six modalities were examined by age groups 18–39 years (ie, younger adult) and ≥40 years (ie, older adult), sex, test site, and upper vs lower body sites. Independent t-tests were used to compare the means for each modality by age group and sex. We used paired t-tests to examine the means of upper compared to lower body values. Analysis was performed with the R statistical package. Benjamini-Hochberg procedure was used to adjust the p-values to account for multiple testing.59 Statistical significance was set at q < 0.05, where q is the adjusted p-value.
Results
A total of 124 participants were included in the study analysis. Table 2 shows the sample demographic information. Participants ranged in age from 18 to 69 years, mean age was 38.6±12.5 years; 64 (52%) were 18–39 years and 60 (48%) were ≥40 years of age. The sample included 61 (49%) women. The 124 participants identified their race as Black/African American, including those who also reported being Hispanic/Latino (n=5) or multi-ethnic (n=4). Fifty participants (40%) had an associate degree or higher degree.
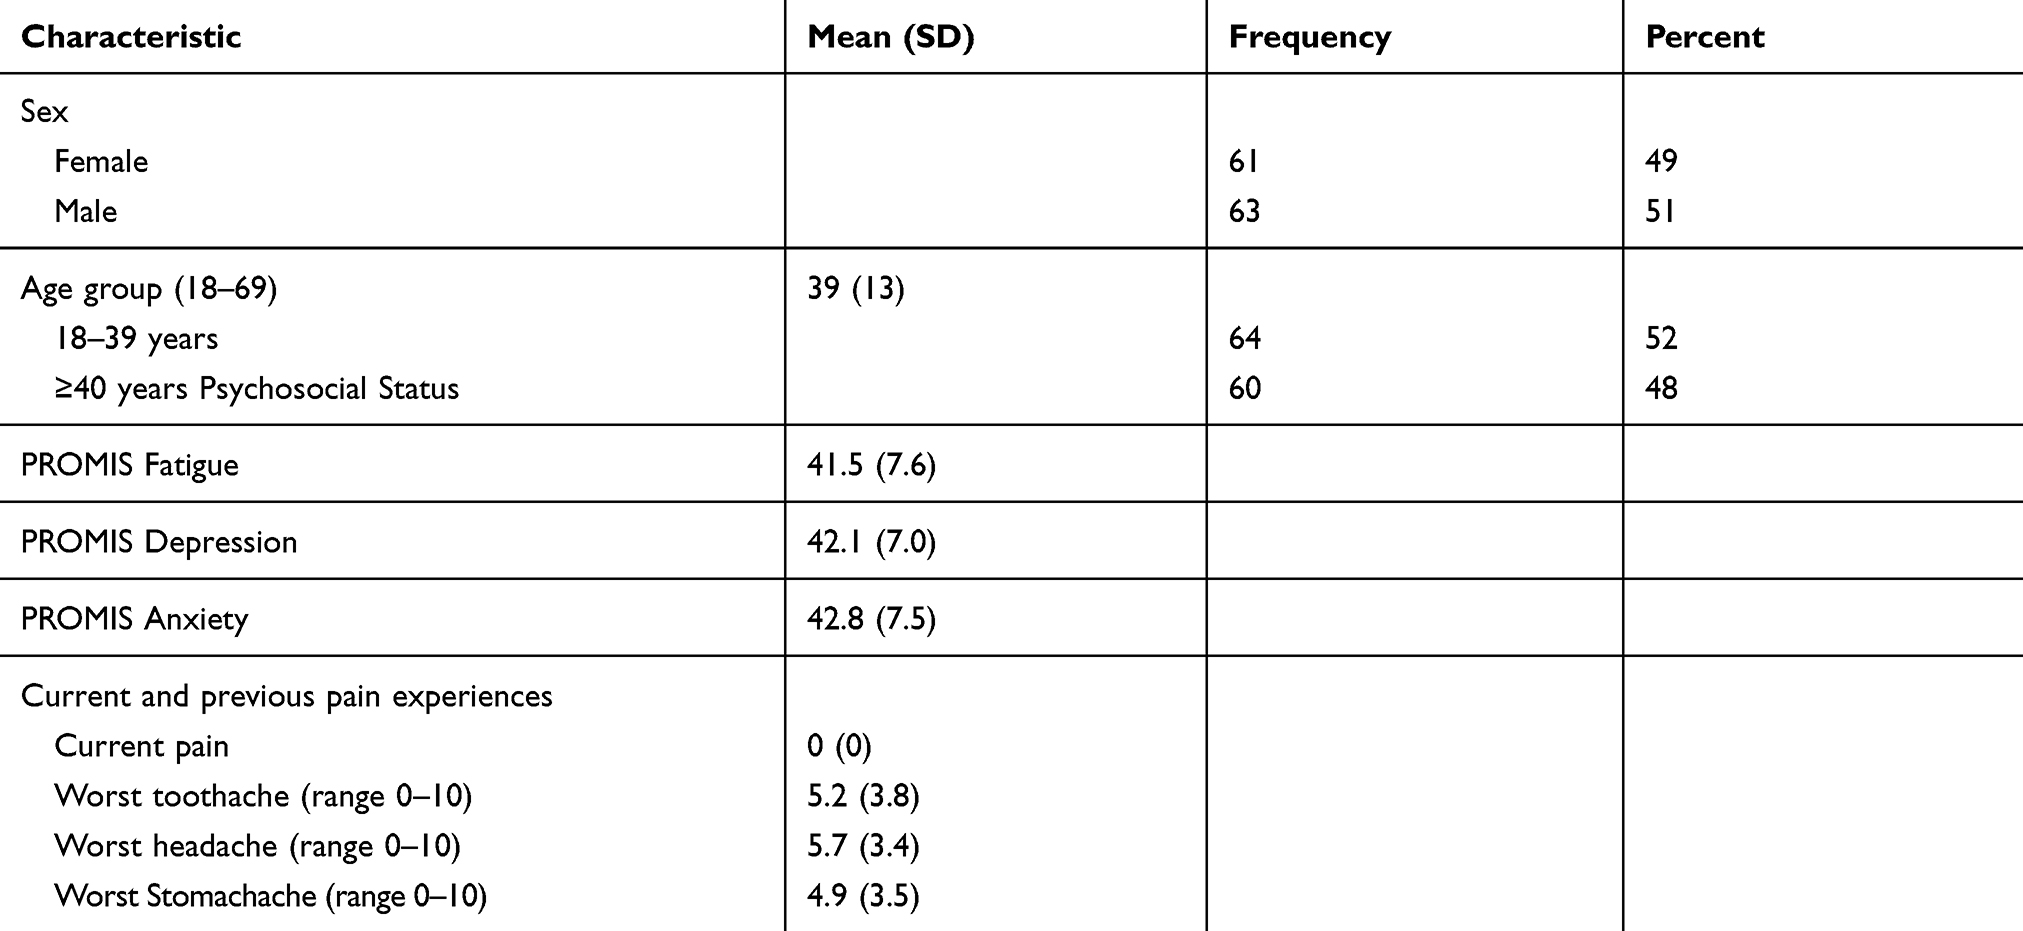 |
Table 2 Sample demographic information, intensity of previous pain experiences, and current fatigue, depression and anxiety |
Descriptive statistics for QST values are reported in Table 3 and Figure 2. All participants were sensate to the thermal stimuli and to mechanical stimuli above 10 g. There were 124 participants providing QST data for the anterior forearm, and 48–53 participants providing QST data for the other five site subgroups and 22–30 participants for the site/age or site/sex subgroups (Table 3). The QST values for each modality showed variability across sites, especially for pain threshold.
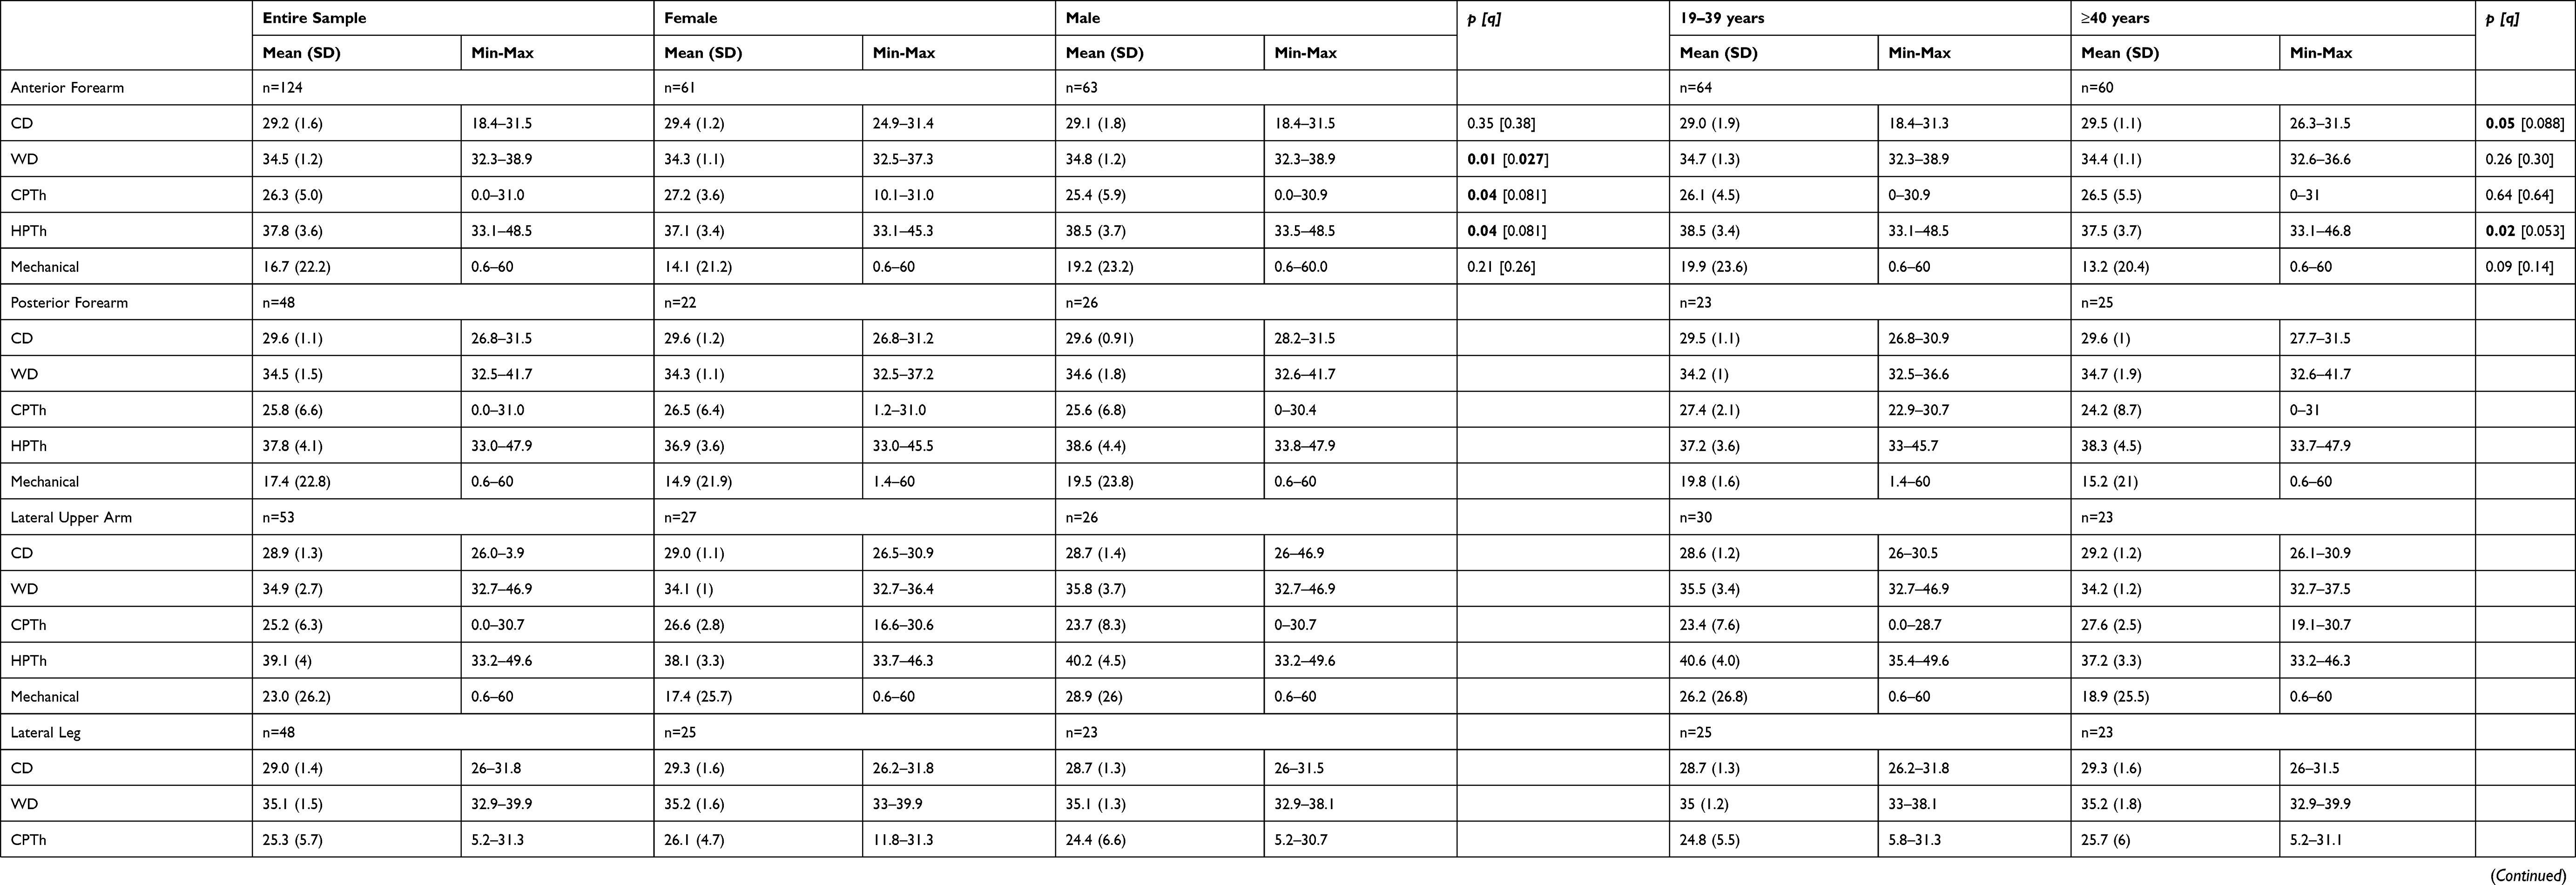 |
Table 3 QST values for cool detection (CD), warm detection (WD), cold pain threshold (CPTh), heat pain threshold (HPTh), and Mechanical detection at six test sites for the entire sample and by sex and age group. Thermal QST is reported in degrees Celsius (C) and mechanical QST is reported in grams of force |
 |
Figure 2 Box plots for thermal and mechanical modalities (CD, CPTh, WD, HPTh, and MPTh) at six test sites.Abbreviations: CD, cold detection; CPTh, cold pain threshold; WD, warm detection; HPTh, heat pain threshold; MPTh, mechanical pain threshold. |
Sex and age
At the anterior forearm, differences in CD values were not significantly different by sex, but mean WD values were significantly lower for females (34.3 °C ±1.1) than males (34.8 °C ±1.2, p= 0.009, q=0.027). (Table 3). Differences in mean CD, CPTh, HPTh, and MPTh values were not statistically significant by sex at the anterior forearm. Also, in Table 3, differences in CD, WD, CPTh, HPTh, MPTh values were not statistically significant by age at the anterior forearm.
Upper and lower body sites
The differences in QST values between upper and lower body sites were statistically significant across all thermal modalities but not for the mechanical modality (Table 4 and Figure 3). Thermal detection (CD, WD) and pain threshold (CPTh, HPTh) occurred closer to the temperature of adaptation in the upper body sites compared to the lower body sites.
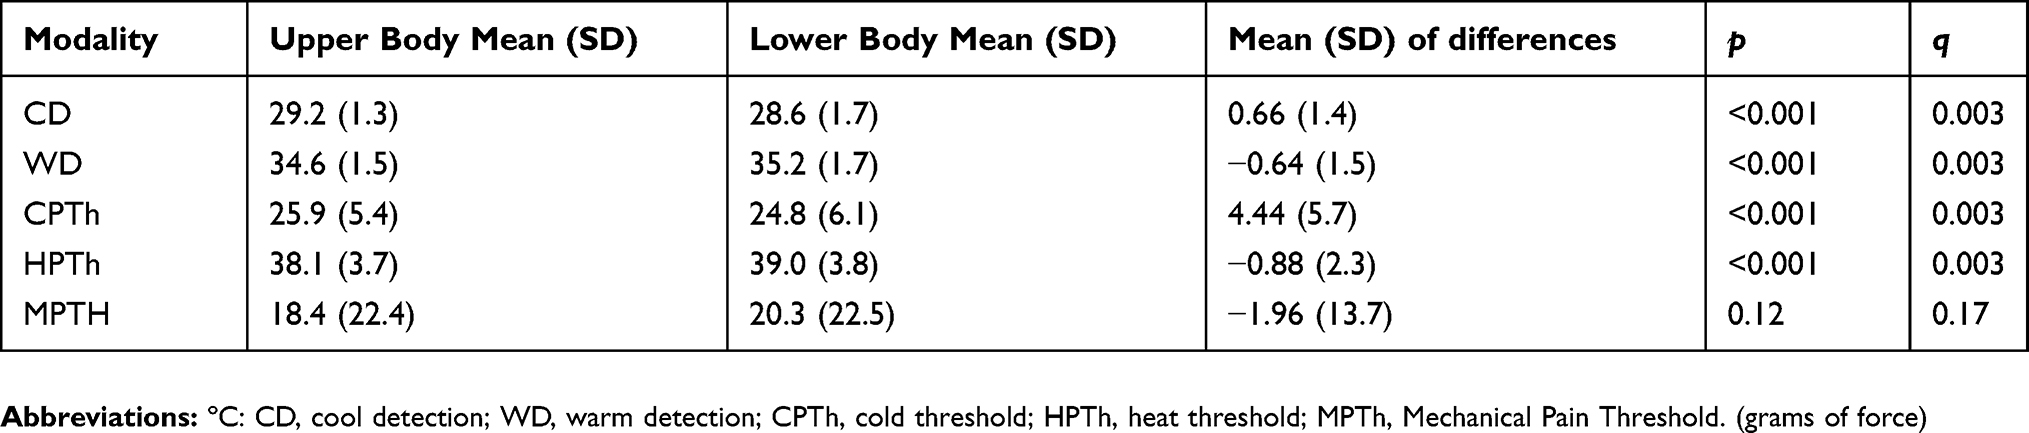 |
Table 4 Comparison of thermal and mechanical quantitative sensory testing in upper body verses lower body sites (N=124*) |
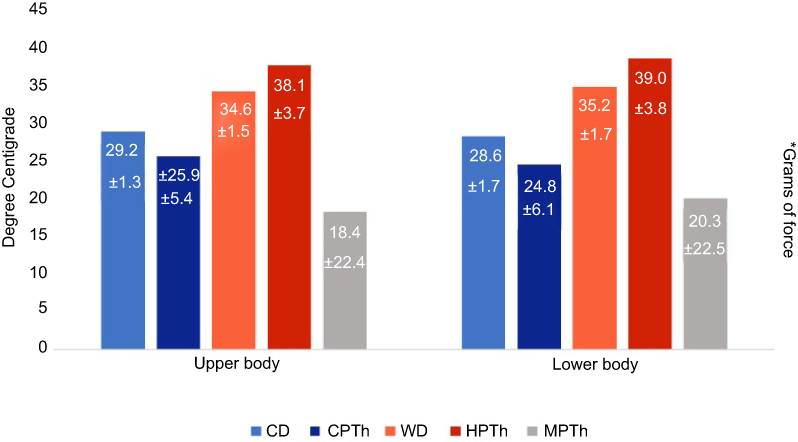 |
Figure 3 Comparison of upper body and lower body QST values by thermal and mechanical modalities.Note: *Mechanical pain threshold (MPTh) is reported in grams of force. |
Symptoms and psychosocial measures
As shown in Table 5, mean pain intensity scores rated immediately after the CPTh and HPTh were 1.9±1.3–2.2±1.2 on the 0–10 PINS. Similarly, after the MPTh tests the mean PINS scores were 0.5±0.5–0.8±0.6. These scores did not differ significantly by sex or age group and clearly indicate that the participants reported pain threshold at an appropriately low perceptual intensity and consistent with the instructions to report when they FIRST felt pain.
 |
Table 5 Pain intensity ratings (0–10 scale) for cold pain threshold (CPTh), heat pain threshold (HPTh), and mechanical pain threshold (MPTh) by sex and age group |
As shown in Table 2, the mean scores for worst toothache, headache, and stomachache are close to the middle of the scale with wide standard deviations (3.4–3.8). These findings indicate that participants chose the whole range of scores (0–10) to describe their pain experiences. Furthermore, these findings indicate that the sample of healthy, pain-free individuals had prior experiences with pain.
We also considered participants’ psychosocial status as another potential factor that may have affected their performance on the QST procedures. As shown in Table 2, the mean fatigue, depression and anxiety scores were lower than the population mean, indicating that the burden of fatigue, depression or anxiety status was low among these healthy volunteers.
Discussion
This study provides QST values for six modalities (CD, WD, CPTh, HPTh, MD, MPTh) among healthy, pain-free African American adults across multiple body sites in a sample characterized by a wide age range and equal distribution by sex. All participants were able to feel sensations for all modalities. Overall, our QST values showed that this sample of healthy African American adults indicated the stimuli were mildly painful on average at 5.7 °C above the temperature of adaptation for HPTh, 5.8 °C below the temperature of adaptation for CPTh, and on average below 20 gF for MPTh. At the anterior forearm, none of the QST pain threshold temperatures were different by sex or age, but women detected the warm stimulus at a significantly lower temperature than men. Thermal responses were significantly closer to the temperature of adaption for upper body sites compared to lower body sites. None of the mechanical responses differed significantly by sex, age, or upper vs lower body sites. Pain intensity values for current and past pain experiences showed that participants had an understanding of pain and the use of the tool for reporting pain intensity. In addition, their low ratings for fatigue, depression and anxiety indicated that these factors were unlikely contributors to their pain threshold reports.
In studies with similar testing methods, protocols, anatomic test sites and probe size, our QST values were similar to other African Americans,7 Asians27 and Hispanics,20,60 but Whites were further from the temperature of adaptation.3,5,14,61 Across the racial groups with reference to the temperature of adaptation, CD occurred at an average of 2.8 °C and WD at 2.5 °C.5,7,9,14,20,62 In our study, average HPTh and CPTh was reported within 6 °C from the temperature of adaptation. In contrast, the average CPTh in other studies was 22.2 °C from the temperature of adaptation and the average HPTh was 10.3 °C from the temperature of adaptation.2,3,5–10,13,14,20,27,62 Overall, our QST pain threshold values were much closer to the temperature of adaptation than published values for other African Americans and other ethnic/racial groups.2,3,5–10,13,14,20,27,62
Reasons for the discrepancy between our pain threshold values and those from other studies could be related to the protocol or the participants’ past pain experiences or psychological status. As a part of our protocol implementation, the participants were trained to indicate their pain threshold when they first felt pain, and we emphasized to them that pain scale was from 0 to 10, where 0 is “no pain” and 10 was ”pain as bad as it could be”, and pain could be described as any number in between (on a continuum). They had used this tool to report their current and past pain experiences. It may be that these instructions and recall of their previous pain experiences influenced our findings since we taught the participants to see pain on a continuum. Participants did not wait until the pain was moderate to severe to indicate they felt the stimulus as pain. As a result, pain intensity ratings reported after they indicated their pain threshold were quite low compared to other studies. Notably, a previous study in healthy adults from age 18–60 had substantially higher mean pain intensity ratings for CPTh (2.9–3.8, median 3.3) and HPTh (4.6–5.5, median 5.0) when they indicated their thermal pain thresholds.63 Thus, the lower perceptual intensity criterion of our sample is consistent with their pain thresholds being closer to the temperature of adaptation.
Sex and age
Our results showed a significant between sex difference only for WD at the anterior forearm, with women being more sensitive. Interestingly, this is the site where women commonly test milk temperature before feeding their babies. Previous investigators explored sex differences in QST responses using multiple modalities and test sites.26,29,31,32,64 Many investigators found that men and women differed significantly in their response to thermal stimuli, with women being more sensitive than men,27,33,64,65 but most studies did not include adjusted p-values for multiple testing. Results from previous studies have shown a consistent pattern of lower heat pain thresholds in females, but the magnitude of these differences has been quite variable.11,29,31,33,34,65,66 We adjusted for multiplicity and found that only WD differed.
In healthy individuals, age dependency for sensory pain thresholds has been observed. As age increases, CPTh decreases and HPTh increases,40 likely due to age-related declines in both pain detection and reaction times.19 The association of age with thermal sensation appears to be variable, but not all of the studies with multiple comparisons included adjusted p-values.12,13,67–70 Controlling for multiplicity, however, we did not see age differences. We grouped age with 40 years as the cut off between younger and older adults because this age grouping is highly relevant in the sickle cell population given their short life expectancy.7
In our study we examined Aβ, Aδ, and C fiber input using von Frey filaments. We found one study that included von Frey filaments in healthy African Americans with results only reported for the hand and foot instead of the anterior forearm as in our study.67 In other studies of healthy African Americans, investigators used the pressure algometer, which limits interpretation with our findings. MPTh values were not significantly different by sex, age, or upper and lower body sites, which is consistent with previous findings for sex,27,31,64,71 age,67,70,72 and upper and lower body sites.33,34
Although many body sites have been used in QST studies, upper versus lower body site comparisons have been consistent across studies and over time. Some investigators have reported no significant difference in thermal threshold differences between upper extremity and lower extremities after controlling for multiplicity.34 In our study, we adjusted for multiplicity and found thermal values for upper body sites that were closer to the adaptation temperature for all thermal modalities than the lower body sites, but the mechanical modality did not show a difference between upper and lower sites. Reasons for differences in thermal responses between the upper and lower body may be related to variations in skin characteristics, epidermal nerve fiber density or axonal length.11,27 Our findings that the QST values for the upper body sites were closer to the temperature of adaption than lower body sites are robust, valid, and consistent with what other researchers have found.11,20,34,69
Symptoms and psychosocial measures
Since thermal pain thresholds for QST stimuli were close to the temperature of adaptation in our sample, we considered participant characteristics that could have influenced their pain threshold responses. To verify that the participants understood what was meant by “pain”, we examined their reports of worst toothache, headache and stomachache. Their pain intensity values were similar to those in previous studies.57,58 In addition, Findings from previous studies have shown that as pain increases, fatigue, anxiety and depression also increase.54,57,58 Our results for fatigue, anxiety, and depression show that the participants were less than one SD lower than the average for the general population. Therefore, our findings demonstrate that the participants understood what pain is, and that their fatigue, depression, and anxiety levels were not likely contributors to the findings of this study. These results give us confidence that the QST pain intensity values for the pain thresholds were not a reporting problem.
Lack of random sample selection is a study limitation. Also, all participants were from the same region of the country and were obtained via advertisement and word of mouth. It is unknown if regional climate, seasonal, genetic, or epigenetic factors impact responses to the QST stimuli. All but two of the prior QST studies of healthy, pain-free African Americans were conducted with samples located in the Southern latitudes in the US, but ours was located in the Northern latitudes in the US and the impact of this difference on our findings is unknown. Also, we did not use biological measures (pain related genetic, epigenetic, inflammatory markers), that might help explain our pattern of results. Future studies should incorporate these biological measures to further characterize the determinants of QST responses in African American samples. Additionally, future studies should include replication of this study in the Southern region using the same protocol.
Study strengths include QST values for six test sites that were obtained from a relatively large sample of younger and older African American adults with balanced distribution by age and sex. In addition, we included current and previous pain, fatigue and psychological context of the sample to help interpret the results. In addition, we applied the Benjamini-Hochberg procedure59 to adjust the p-values to account for the multiple tests. The aim of the present study was to characterize QST values for healthy African American adults, thus, we did not attempt to compare thresholds between ethnic/racial groups. The study protocol was consistent with the EFNS protocol for testing Aβ, Aδ, and C fiber function.66 These QST values may be used for comparisons in studies where the same protocol is utilized.
Conclusion
Overall, this sample of healthy African American adults had average thermal pain thresholds within 6 °C of the temperature of adaptation that were not significantly different by age or sex. Differences in responses to thermal and mechanical stimuli for upper verses lower body sites were consistent with previous research. We believe that participant training established a low perceptual intensity criterion for pain threshold, which is a plausible explanation for our findings. Regardless of the cause for the thresholds being closer to the temperature of adaptation, these results can be used as controls for African Americans with SCD and tested with the same protocol. Additional research is needed to resolve differences in QST values observed with different protocols and to establish normative QST values for healthy, pain-free African Americans with consideration of geographic region within the US and genetic admixtures of the participants.
Acknowledgments
This publication was made possible by funds from Robert Wood Johnson Foundation and grants 1R01HL124945 and 1R01HL124945S1 from the National Institutes of Health, National Heart Lung & Blood Institute (NHLBI), T32AG049673 Integrative and Multidisciplinary Pain and Aging Research Training in conjunction with the Institute on Aging, and U54CA233444 Florida-California Cancer Research, Education and Engagement (CaRE2) Health Equity Center from the National Cancer Institute.
Disclosure
Molokie, Wang, Yao and Schlaeger reports grants from NIH, during the conduct of the study. Powell-Roach reports grants from NHLBI and Robert Wood Johnson Foundation, during the conduct of the study. Fillingim owns stock in Algynomics, a company which does not own any tools used for this research. Wilkie reports grants from NIH, during the conduct of the study and is co-founder and chair of eNursing llc, a company which does not own any tools used for this research. The authors report no other conflicts of interest in this work.
References
1. Brandow AM, Panepinto JA. Clinical interpretation of quantitative sensory testing as a measure of pain sensitivity in patients with sickle cell disease. J Pediatr Hematol Oncol. 2016;38(4):288–293. doi:10.1097/MPH.0000000000000532
2. Campbell CM, Carroll CP, Kiley K, et al. Quantitative sensory testing and pain-evoked cytokine reactivity: comparison of patients with sickle cell disease to healthy matched controls. Pain. 2016;157(4):949–56. doi:10.1097/j.pain.0000000000000473
3. Campbell CM, Edwards RR, Fillingim RB. Ethnic differences in responses to multiple experimental pain stimuli. Pain. 2005;113(1–2):20–26. doi:10.1016/j.pain.2004.08.013
4. Edwards CL, Fillingim RB, Keefe F. Race, ethnicity and pain. Pain. 2001;94(2):133–137. doi:10.1016/S0304-3959(01)00408-0
5. Edwards RR, Fillingim RB. Ethnic differences in thermal pain responses. Psychosom Med. 1999;61(3):346–354.
6. Cruz-Almeida Y, Sibille KT, Goodin BR, et al. Racial and ethnic differences in older adults with knee osteoarthritis. Arthritis Rheumatol. 2014;66(7):1800–1810. doi:10.1002/art.38620
7. Ezenwa MO, Molokie RE, Wang ZJ, et al. Safety and utility of quantitative sensory testing among adults with sickle cell disease: indicators of neuropathic pain? Pain Pract. 2016;16(3):282–293. doi:10.1111/papr.12279
8. Glover TL, Goodin BR, Horgas AL, et al. Vitamin D, race, and experimental pain sensitivity in older adults with knee osteoarthritis. Arthritis Rheum. 2012;64(12):3926–3935. doi:10.1002/art.37687
9. Riley JL, Cruz-Almeida Y, Glover TL, et al. Age and race effects on pain sensitivity and modulation among middle-aged and older adults. J Pain. 2014;15(3):272–282. doi:10.1016/j.jpain.2013.10.015
10. Hastie BA, Riley JL, Fillingim RB. Ethnic differences and responses to pain in healthy young adults. Pain Med. 2005;6(1):61–71. doi:10.1111/j.1526-4637.2005.05009.x
11. Yarnitsky D, Sprecher E, Zaslansky R, Hemli JA. Heat pain thresholds: normative data and repeatability. Pain. 1995;60(3):329–332.
12. Rahim‐Williams B, Riley JL, Williams AKK, Fillingim RB. a quantitative review of ethnic group differences in experimental pain response: do biology, psychology, and culture matter? Pain Med. 2012;13(4):522–540. doi:10.1111/j.1526-4637.2012.01336.x
13. Rahim-Williams FB, Riley JL, Herrera D, Campbell CM, Hastie BA, Fillingim RB. Ethnic identity predicts experimental pain sensitivity in African Americans and hispanics. Pain. 2007;129(1):177–184. doi:10.1016/j.pain.2006.12.016
14. Wang H, Papoiu AD, Coghill RC, Patel T, Wang N, Yosipovitch G. Ethnic differences in pain, itch and thermal detection in response to topical capsaicin: African Americans display a notably limited hyperalgesia and neurogenic inflammation. Br J Dermatol. 2010;162(5):1023–1029. doi:10.1111/j.1365-2133.2009.09628.x
15. Smedley BD, Stith AY, Nelson AR, Institute of Medicine. Committee on U, eliminating R, ethnic disparities in health C. In: Unequal Treatment: Confronting Racial and Ethnic Disparities in Health Care. Washington, D.C: National Academies Press; 2003:1(22);160–175.
16. Berry PH, Dahl JL. The new JCAHO pain standards: implications for pain management nurses. Pain Manag Nurs. 2000;1(1):3–12. doi:10.1053/jpmn.2000.5833
17. Ezenwa MO, Ameringer S, Ward SE, Serlin RC. Racial and ethnic disparities in pain management in the United States. J Nurs Scholarsh. 2006;38(3):225–233. doi:10.1111/j.1547-5069.2006.00107.x
18. Ezenwa MO, Fleming MF. Racial disparities in pain management in primary care. J Health Dispar Res Pract. 2012;5(3):12–26.
19. Chapman WP, Jones CM. Variations in cutaneous and visceral pain sensitivity in normal subjects. J Clin Invest. 1944;23(1):81–91. doi:10.1172/JCI101475
20. Gonzalez-Duarte A, Lem-Carrillo M, Guerrero-Torres L. Normative values of quantitative sensory testing in hispanic latino population. Brain Behav. 2016;6(7):e00466. doi:10.1002/brb3.466
21. Riley JL, Wade JB, Myers CD, Sheffield D, Papas RK, Price DD. Racial/ethnic differences in the experience of chronic pain. Pain. 2002;100(3):291–298.
22. Anderson KO, Green CR, Payne R. Racial and ethnic disparities in pain: causes and consequences of unequal care. J Pain. 2009;10(12):1187–1204. doi:10.1016/j.jpain.2009.10.002
23. Green CR, Anderson KO, Baker TA, et al. The unequal burden of pain: confronting racial and ethnic disparities in pain. Pain Med. 2003;4(3):277–294. doi:10.1046/j.1526-4637.2003.03034.x
24. Cruz-Almeida Y, Fillingim RB. Can quantitative sensory testing move us closer to mechanism-based pain management? Pain Med. 2014;15(1):61–72. doi:10.1111/pme.12230
25. Cruz-Almeida Y, Riley JL
26. Sheffield D, Biles PL, Orom H, Maixner W, Sheps DS. Race and sex differences in cutaneous pain perception. Psychosom Med. 2000;62(4):517–523.
27. Wang R, Cui L, Zhou W, et al. Reliability study of thermal quantitative sensory testing in healthy Chinese. Somatosens Mot Res. 2014;31(4):198–203. doi:10.3109/08990220.2014.914485
28. Gibson SJ, Farrell M. A review of age differences in the neurophysiology of nociception and the perceptual experience of pain. Clin J Pain. 2004;20(4):227–239.
29. Monroe TB, Gore JC, Bruehl SP, et al. Sex differences in psychophysical and neurophysiological responses to pain in older adults: a cross-sectional study. Biol Sex Differ. 2015;6:25. doi:10.1186/s13293-015-0041-y
30. Edwards RR, Fillingim RB. Age-associated differences in responses to noxious stimuli. J Gerontol A Biol Sci Med Sci. 2001;56(3):M180–M185. doi:10.1093/gerona/56.3.M180
31. Fillingim RB, King CD, Ribeiro-Dasilva MC, Rahim-Williams B, Riley JL
32. Kindler LL, Valencia C, Fillingim RB, George SZ. Sex differences in experimental and clinical pain sensitivity for patients with shoulder pain. Eur J Pain. 2011;15(2):118–123. doi:10.1016/j.ejpain.2010.06.001
33. Neziril AY, Scaramozzinol P, Andersenl OK, Dickensonl AH, Arendt‐Nielsenl L, Curatolol M. Reference values of mechanical and thermal pain tests in a pain‐free population. Eur J Pain. 2011;15(4):376–383. doi:10.1016/j.ejpain.2010.08.011
34. Hagander LG, Midani HA, Kuskowski MA, Parry GJ. Quantitative sensory testing: effect of site and skin temperature on thermal thresholds. Clin Neurophysiol. 2000;111(1):17–22.
35. Covington EC. Depression and chronic fatigue in the patient with chronic pain. Prim Care. 1991;18(2):341–358.
36. Gerrits MM, van Marwijk HW, van Oppen P, van der Horst H, Penninx BW. Longitudinal association between pain, and depression and anxiety over four years. J Psychosom Res. 2015;78(1):64–70. doi:10.1016/j.jpsychores.2014.10.011
37. Turk DC, Fillingim RB, Ohrbach R, Patel KV. Assessment of psychosocial and functional impact of chronic pain. J Pain. 2016;17(9 Suppl):T21–T49. doi:10.1016/j.jpain.2015.12.006
38. Van Damme S, Becker S, Van der Linden D. Tired of pain? Toward a better understanding of fatigue in chronic pain. Pain. 2018;159(1):7–10. doi:10.1097/j.pain.0000000000001054
39. Cruccu G, Anand P, Attal N, et al. EFNS guidelines on neuropathic pain assessment. Eur J Neurol. 2004;11(3):153–162.
40. Mucke M, Cuhls H, Radbruch L, et al. Quantitative Sensory Testing (QST). English Version. Schmerz(Berlin, Germany), 2016. doi:10.1007/s00482-015-0093-2
41. Rolke R, Baron R, Maier C, et al. Quantitative sensory testing in the German research network on neuropathic pain (DFNS): standardized protocol and reference values. Pain. 2006;123(3):231–243. doi:10.1016/j.pain.2006.01.041
42. Wilkie DJ, Savedra MC, Holzemer WL, Tesler MD, Paul SM. Use of the McGill pain questionnaire to measure pain: a meta-analysis. Nurs Res. 1990;39(1):36–41.
43. Ngamkham S, Holden JE, Wilkie DJ. Differences in pain location, intensity, and quality by pain pattern in outpatients with cancer. Cancer Nurs. 2011;34(3):228–237.
44. Huang HY, Wilkie DJ, Zong SP, et al. Developing a computerized data collection and decision support system for cancer pain management. Comput Inform Nurs. 2003;21(4):206–217.
45. Wilkie DJ, Judge MK, Berry DL, Dell J, Zong S, Gilespie R. Usability of a computerized PAINReportIt in the general public with pain and people with cancer pain. J Pain Symptom Manage. 2003;25(3):213–224.
46. Ezenwa MO, Molokie RE, Wang ZJ, et al. Outpatient pain predicts subsequent one-year acute health care utilization among adults with sickle cell disease. J Pain Symptom Manage. 2014;48(1):65–74. doi:10.1016/j.jpainsymman.2013.08.020
47. Berry DL, Wilkie DJ, Huang HY, Blumenstein BA. Cancer pain and common pain: a comparison of patient-reported intensities. Oncol Nurs Forum. 1999;26(4):721–726.
48. Wilkie DJ, Molokie R, Boyd-Seal D, et al. Patient-reported outcomes: descriptors of nociceptive and neuropathic pain and barriers to effective pain management in adult outpatients with sickle cell disease. J Natl Med Assoc. 2010;102(1):18–27. doi:10.1016/s0027-9684(15)30471-5
49. Ngamkham S, Vincent C, Finnegan L, Holden JE, Wang ZJ, Wilkie DJ. The McGill pain questionnaire as a multidimensional measure in people with cancer: an integrative review. Pain Manag Nurs. 2012;13(1):27–51. doi:10.1016/j.pmn.2010.12.003
50. Murphy DF, McDonald A, Power C, Unwin A, MacSullivan R. Measurement of pain: a comparison of the visual analogue with a nonvisual scale. Clin J Pain. 1987;3(4):197–199. doi:10.1097/00002508-198712000-00003
51. Wilkie D, Lovejoy N, Dodd M, Tesler M. Cancer pain intensity measurement: concurrent validity of three tools–finger dynamometer, pain intensity number scale, visual analogue scale. Hosp J. 1990;6(1):1–13.
52. Jha A, Suarez ML, Ferrans CE, Molokie R, Kim YO, Wilkie DJ. Cognitive testing of PAINReportIt in adult African Americans with sickle cell disease. Comput Inform Nurs. 2010;28(3):141–150. doi:10.1097/NCN.0b013e3181d7820b
53. Jensen MP, Karoly P, Huger R. The development and preliminary validation of an instrument to assess patients’ attitudes toward pain. J Psychosom Res. 1987;31(3):393–400.
54. Cella D, Yount S, Rothrock N, et al. The Patient-Reported Outcomes Measurement Information System (PROMIS): progress of an NIH roadmap cooperative group during its first two years. Med Care. 2007;45(5 Suppl 1):S3–s11. doi:10.1097/01.mlr.0000258615.42478.55
55. Schalet BD, Pilkonis PA, Yu L, et al. Clinical validity of PROMIS depression, anxiety, and anger across diverse clinical samples. J Clin Epidemiol. 2016;73:119–127. doi:10.1016/j.jclinepi.2015.08.036
56. National Institutes of Health. PROMIS domain framework/definitions; 2007. Available from: http://www.nihpromis.org/measures/domainframework1.
57. Ameringer S, Elswick RK
58. Ameringer S, Elswick RK
59. Benjamini Y, Hochbery Y. Controlling the false discovery rate: a practical and powerful approach to multiple testing. J R Stat Soc. 1975;57(1):289–300.
60. Kim HJ, Yang GS, Greenspan JD, et al. Racial and ethnic differences in experimental pain sensitivity: systematic review and meta-analysis. Pain. 2017;158(2):194–211. doi:10.1097/j.pain.0000000000000731
61. Mechlin MB, Maixner W, Light KC, Fisher JM, Girdler SS. African Americans show alterations in endogenous pain regulatory mechanisms and reduced pain tolerance to experimental pain procedures. Psychosom Med. 2005;67(6):948–956. doi:10.1097/01.psy.0000188466.14546.68
62. O’Leary JD, Crawford MW, Odame I, Shorten GD, McGrath PA. Thermal pain and sensory processing in children with sickle cell disease. Clin J Pain. 2014;30(3):244–250. doi:10.1097/AJP.0b013e318292a38e
63. Kelly KG, Cook T, Backonja MM. Pain ratings at the thresholds are necessary for interpretation of quantitative sensory testing. Muscle Nerve. 2005;32(2):179–184. doi:10.1002/mus.20355
64. Fillingim RB, Maixner W, Kincaid S, Silva S. Sex differences in temporal summation but not sensory-discriminative processing of thermal pain. Pain. 1998;75(1):121–127.
65. Pfau DB, Krumova EK, Treede RD, et al. Quantitative sensory testing in the German research network on neuropathic pain (DFNS): reference data for the trunk and application in patients with chronic postherpetic neuralgia. Pain. 2014;155(5):1002–1015. doi:10.1016/j.pain.2014.02.004
66. Siao P, Cros DP. Quantitative sensory testing. Phys Med Rehabil Clin N Am. 2003;14(2):261–286.
67. Brandow AM, Stucky CL, Hillery CA, Hoffmann RG, Panepinto JA. Patients with sickle cell disease have increased sensitivity to cold and heat. Am J Hematol. 2013;88(1):37–43. doi:10.1002/ajh.23341
68. Edwards RR, Fillingim RB, Ness TJ. Age-related differences in endogenous pain modulation: a comparison of diffuse noxious inhibitory controls in healthy older and younger adults. Pain. 2003;101(1–2):155–165.
69. Lin YH, Hsieh SC, Chao CC, Chang YC, Hsieh ST. Influence of aging on thermal and vibratory thresholds of quantitative sensory testing. J Peripher Nerv Syst. 2005;10(3):269–281. doi:10.1111/j.1085-9489.2005.10305.x
70. Lautenbacher S, Kunz M, Strate P, Nielsen J, Arendt-Nielsen L. Age effects on pain thresholds, temporal summation and spatial summation of heat and pressure pain. Pain. 2005;115(3):410–418. doi:10.1016/j.pain.2005.03.025
71. Sullivan MJ, Tripp DA, Santor D. Gender differences in pain and pain behavior: the role of catastrophizing. Cognit Ther Res. 2000;24(1):121–134. doi:10.1023/A:1005459110063
72. Magerl W, Krumova EK, Baron R, Tolle T, Treede RD, Maier C. Reference data for quantitative sensory testing (QST): refined stratification for age and a novel method for statistical comparison of group data. Pain. 2010;151(3):598–605. doi:10.1016/j.pain.2010.07.026
 © 2019 The Author(s). This work is published and licensed by Dove Medical Press Limited. The
full terms of this license are available at https://www.dovepress.com/terms
and incorporate the Creative Commons Attribution
- Non Commercial (unported, 3.0) License.
By accessing the work you hereby accept the Terms. Non-commercial uses of the work are permitted
without any further permission from Dove Medical Press Limited, provided the work is properly
attributed. For permission for commercial use of this work, please see paragraphs 4.2 and 5 of our Terms.
© 2019 The Author(s). This work is published and licensed by Dove Medical Press Limited. The
full terms of this license are available at https://www.dovepress.com/terms
and incorporate the Creative Commons Attribution
- Non Commercial (unported, 3.0) License.
By accessing the work you hereby accept the Terms. Non-commercial uses of the work are permitted
without any further permission from Dove Medical Press Limited, provided the work is properly
attributed. For permission for commercial use of this work, please see paragraphs 4.2 and 5 of our Terms.