Back to Journals » Clinical Interventions in Aging » Volume 15
The Tilburg Frailty Indicator (TFI): New Evidence for Its Validity
Authors Gobbens RJJ ![]() , Boersma P, Uchmanowicz I
, Boersma P, Uchmanowicz I ![]() , Santiago LM
, Santiago LM ![]()
Received 21 December 2019
Accepted for publication 31 January 2020
Published 21 February 2020 Volume 2020:15 Pages 265—274
DOI https://doi.org/10.2147/CIA.S243233
Checked for plagiarism Yes
Review by Single anonymous peer review
Peer reviewer comments 2
Editor who approved publication: Dr Richard Walker
Robbert JJ Gobbens, 1–3 Petra Boersma, 1 Izabella Uchmanowicz, 4 Livia Maria Santiago 5
1Faculty of Health, Sports and Social Work, Inholland University of Applied Sciences, Amsterdam, the Netherlands; 2Zonnehuisgroep Amstelland, Amstelveen, the Netherlands; 3Department of Primary and Interdisciplinary Care, Faculty of Medicine and Health Sciences, University of Antwerp, Antwerp, Belgium; 4Division of Nursing in Internal Medicine Procedures, Department of Clinical Nursing, The Faculty of Health Sciences, Wroclaw Medical University, Wrocław, Poland; 5Faculty of Medicine, Department of Speech and Language Pathology, Federal University of Rio de Janeiro, Rio de Janeiro, Brazil
Correspondence: Robbert JJ Gobbens
Faculty of Health, Sports and Social Work, Inholland University of Applied Sciences, De Boelelaan 1109, 1081 HV, Amsterdam, the Netherlands
Tel +31 6 21115578
Email [email protected]
Objective: The Tilburg Frailty Indicator (TFI) is a self-report user-friendly questionnaire for assessing multidimensional frailty among community-dwelling older people. The main aim of this study is to re-evaluate the validity of the TFI, both cross-sectionally and longitudinally, focusing on the predictive value of the total TFI and its physical, psychological, and social domains for adverse outcomes disability, indicators of healthcare utilization, and falls.
Methods: The validity of the TFI was determined in a sample of 180 Dutch community-dwelling older people aged 70 years and older. The participants completed questionnaires including the TFI, the Groningen Activity Restriction Scale (GARS) for assessing disability, and questions with regard to health care utilization and falls in 2016 and again one year later.
Results: The physical and psychological domains of the TFI were significantly correlated as expected with adverse outcomes disability, many indicators of healthcare utilization, and falls. Regression analyses showed that physical frailty was mostly responsible for the effect of frailty on the adverse outcomes. The cross-sectional and longitudinal predictive validity of total frailty with respect to disability and receiving personal care was excellent, evidenced by Areas Under the Curves (AUCs) > 0.8. In most cases, using the cut-off point 5 for total frailty ensured the best values for sensitivity and specificity.
Conclusion: The present study provided new, additional evidence for the validity of the TFI for assessing frailty in Dutch community-dwelling older people aiming to prevent or delay adverse outcomes, including disability.
Keywords: older people, frailty, disability, validity, Tilburg Frailty Indicator
Introduction
With the growing aging population worldwide,1 frailty is increasingly an important issue because frailty is closely related to older age.2 Many studies have shown that frail older people have an increased risk of disability,3 hospitalization,4 institutionalization,5 lower quality of life,6 and premature death.7 The importance of paying attention to frailty is hardly disputed by research and practice; however, opinions differ widely about what qualifies as frailty. Roughly speaking, two approaches can be distinguished. The first approach refers to frailty as a medical concept, focusing only on the physical problems that older people can experience.8 The second approach takes the whole functioning of an older person into consideration; physical, psychological as well as social problems are taken into account.9 The latter, so called multidimensional frailty, distinct from physical frailty, can be defined as: a dynamic state affecting an individual who experiences losses in one or more domains of human functioning (physical, psychological, and social) which is caused by the influence of a range of variables and which increases the risk of adverse outcomes.10
Today, many instruments have been developed to assess multidimensional frailty including the Frailty Index (FI),11 Easycare-TOS,12 the Edmonton Frail Scale,13 and the Tilburg Frailty Indicator (TFI).14 The TFI, a user-friendly self-report questionnaire, was developed on the basis of an integral model of frailty.9 The instrument distinguishes itself from other frailty instruments, including the FI,11 because it does not contain questions referring to disability and diseases. Although an overlap exists between frailty, disability, and diseases, these three concepts need to be separated from each other.15 According to Sutton et al,16 the TFI has the most robust evidence of reliability and validity among 38 frailty assessment instruments, including the FI and the Phenotype of frailty.8 However, the TFI is no gold standard instrument. Therefore, as with other frailty assessment instruments, further in-depth evaluations of the psychometric properties of the TFI are required.16 Its psychometric properties were established among Dutch community-dwelling older people aged 75 years and older.14,17 Since then, the TFI has been translated and validated in many other countries like Brazil,18 Poland,19 Italy,20 Portugal,21 and Denmark.22
The aim of this study was to re-evaluate the validity of the TFI, both cross-sectionally and longitudinally, largely using the same dependent and independent variables as in previous studies,14,17 focusing on the predictive value of the total TFI and its domains for adverse outcomes disability, indicators of healthcare utilization, and falls. Differences between the current study and previous studies exist in the age categories of the participants and in the provinces in the Netherlands where the studies were carried out. The previous Dutch studies included samples of community-dwelling people aged 75 years and older living in the province of North Brabant. The present study was carried out in the province of North Holland and included community-dwelling older people aged 70 years and older.
Methods
Design
A cross-sectional and longitudinal design was used.
Study Population and Data Collection
For this study, we used a sample composed by Renne and Gobbens.23 In October 2016 (Time 0 [T0]), Renne and Gobbens23 contacted 507 community-dwelling people, aged 70 years and older, who were affiliated with a general practice in an area of small villages close to Amsterdam, the capital of the Netherlands. From the contacted sample, 241 people completed a self-report questionnaire, referring to a response rate of 47.5%. This questionnaire contained the TFI and questions about chronic diseases and socio-demographic characteristics. A year later (October 2017) (Time 1 [T1]), the participants received a similar questionnaire that also contained questions about adverse outcomes of frailty. This second questionnaire was completed by 195 people, yielding a response rate of 80.9%. In the present study, we only used the sample comprising 195 people to assess the associations between frailty and its adverse outcomes cross-sectionally and longitudinally. Because we found differences between measurement 1 and measurement 2 with respect to gender and/or age in 15 respondents, we decided to exclude these respondents from the analyses; the final sample thus amounted to 180 participants.
Measures
Frailty
As mentioned in the introduction, we assessed multidimensional frailty with the Tilburg Frailty Indicator (TFI).14 The TFI contains a part A used to identify the determinants of frailty and a part B to determine whether a person is frail. For the purpose of this study, we asked the participants to only fill in part B. The TFI (part B) contains 15 questions referring to eight, four, and three components of physical, psychological, and social frailty, respectively. The score on total frailty ranges from 0 to 15, and the ranges of the scores on physical, psychological, and social frailty are 0 to 8, 0 to 4, and 0 to 3, respectively. The maximum scores refer to the highest level of frailty. An individual is considered frail if the total TFI-score is five or higher.14
Adverse Outcomes of Frailty
We used the same adverse outcomes and measures as in previous studies: disability and indicators of healthcare utilization (visit to a general practitioner, hospitalization, receiving personal care, receiving nursing, and contacts with health care professionals).14,17 To assess the indicators of healthcare utilization, we asked the participants whether they had made use of them in the past year. For assessing disability, referring to disability in carrying out activities of daily living and instrumental activities of daily living, we used the Groningen Activity Restriction Scale (GARS), a self-report questionnaire containing 18 items; the total score ranges from 18 to 72, with higher scores indicating being more disabled.24 The GARS has good psychometric properties.25 An individual with a GARS-score of 29 or higher is considered disabled.26 For the answer categories of the five indicators of healthcare utilization, we refer to Table 1 (Characteristics of the participants). In addition, we assessed falls by asking the participants: “Did you fall in the previous year?” (response categories “yes” and “no”).
 |
Table 1 Characteristics of the Participants (N=180) |
Socio-Demographic Characteristics
Socio-demographic characteristics of interest at both T0 and T1 were age, sex, marital status, and level of education. See Table 1 for the answer categories.
Disease(s)
Participants were asked at T0 as well as T1 whether they have or have had the following diseases or conditions diagnosed in the past year: diabetes mellitus, cerebrovascular accident, heart attack, another heart condition (such as heart failure or angina pectoris), cancer, chronic obstructive pulmonary disease, and arthrosis.
Statistical Analyses
First, descriptive statistics were used to determine the characteristics of the participants. Second, we examined the correlations between physical, psychological, and social frailty, assessed at T0 and T1, and the adverse outcomes of frailty, assessed at T1. Correlations were considered to be small, medium, or large with coefficients of 0.1, 0.3, or 0.5, respectively.27 Third, cross-sectional sequential linear regression analyses were conducted with the aim of examining the effect of each of the frailty types (physical, psychological, social) on adverse outcomes disability, visits general practitioner, and contacts with health care professionals. Furthermore, we carried out logistic regression analyses to examine the cross-sectional effects of the three frailty types on the other adverse outcomes (hospitalization, receiving personal care, receiving nursing, falls). To examine these associations we only used variables assessed at T1. Fourth, we did the same linear and logistic regression analyses with the aim of examining the longitudinal associations between the independent variables (frailty domains) and dependent variables (adverse outcomes of frailty). To determine these associations we used variables assessed at T0 (background characteristics, frailty domains, disease(s)) and at T1 (adverse outcomes). All regression analyses were conducted in three blocks. The effects of the socio-demographic characteristics of the participants were estimated in the first block. The second block contains disease(s), and the third block contains the three frailty domains; this third block enables testing the effect of an individual frailty domain on the adverse outcomes, after controlling for the other variables in the model (socio-demographic characteristics, disease(s), and the other frailty domains), aiming to determine the predictive value of the individual domains of the TFI.
Finally, we also assessed the predictive validity of total and physical frailty using receiver operating characteristics (ROC). The ROC analyses were applied to adverse outcomes disability and four indicators of healthcare utilization (hospitalization, receiving personal care, receiving nursing care, falls). Sensitivity and specificity were estimated for each outcome at each cut-off point of the total and physical frailty scores, and the area under the curve (UAC) with 95% confidence intervals was reported. Power analyses using GPower 3.1028 showed that the sequential linear regression analyses on 180 participants had a power of at least 80% to detect an effect of Cohen’s f2 = 0.087 which is a small to medium effect size.27
For statistical analyses, we used IBM SPSS Statistics 22.0 (IBM, Armonk, NY, USA). A p-value <0.05 was considered statistically significant.
Ethical Considerations
For this study, medical ethics approval was not necessary as particular treatments or interventions were not offered or withheld from respondents. The integrity of respondents was not encroached upon as a consequence of participating in this study which is the main criterion in medical-ethical procedures in the Netherlands.29 Informed consent in relation to detailing the study and maintaining confidentiality was observed.
Results
Participant Characteristics
At baseline (T0) the mean age of the participants was 76.3 years (SD = 5.1), 52.2% were male, and 72.8% were married or cohabiting. There were hardly any differences between the average number of diseases at T0 and T1. The average score on total frailty was 3.1 (SD = 3.0) at T0 and 3.5 (SD = 3.4) at T1. Using the cut-off point 5, the prevalence of frailty was higher at T1 compared to T0 (35.7% versus 29.4%). See Table 1 for a complete overview of the characteristics of the participants.
Correlations Between Frailty Domains and Adverse Outcomes
Table 2 presents the correlations between the three frailty domains (physical, psychological, social) assessed at T0 and T1 and the adverse outcomes (disability, healthcare utilization, falls). The correlations between physical frailty (T0) and four outcomes (T1) could be considered as medium (0.325–0.488); the correlations between physical frailty and adverse outcomes, both assessed at T1, were all stronger, including strong correlations concerning disability (0.639) and visits general practitioner (0.529). Psychological frailty assessed at T0 was only correlated with disability and psychological frailty assessed at T1 was correlated with both disability and visits general practitioner; all these correlations could be considered as medium (0.348 – 0.467). More than half of the correlations between social frailty and adverse outcomes are significant, with coefficients ranging from 0.150 (receiving personal care) to 0.257 (disability); the correlations of social frailty assessed at T0 are stronger than the correlations of social frailty assessed at T1.
 |
Table 2 Correlations Between Frailty Domains (T0, T1) and Adverse Outcomes of Frailty (T1) |
Five adverse outcomes were significantly correlated with at least four of six frailty variables; hospitalization is only significantly correlated with physical frailty assessed at T1.
The correlations between the frailty domains were 0.416 between physical and psychological, 0.392 between physical and social, and 0.398 between psychological and social, assessed at T0 (all p-values <0.001). At T1, the correlations between the three frailty domains were as follows: 0.538 between physical and psychological, 0.363 between physical and social, and 0.522 between psychological and social (all p-values <0.001).
Predictive Validity: Cross-Sectional Regression Analyses
Table 3 presents the cross-sectional effects of the frailty domains after controlling for background characteristics and disease(s) on the continuous adverse outcomes disability, visits general practitioner, and contacts with healthcare professionals. All frailty domains together explained a significant part of the scores on all three outcomes, in addition to the first and second block, with explained variances (R2; see the penultimate row) ranging from 9.2% (contacts with healthcare professionals) to 20.0% (disability), with p-values <0.001. Physical frailty was the only domain that had a significant effect on the three outcomes after controlling for background characteristics, disease(s), psychological and social frailty (all p-values <0.001), representing a medium to large effect size on disability (f2 = 0.20) and a small to medium effect size on visits general practitioner and contacts with healthcare professionals, f2 =0.13 and f2 =0.08, respectively.
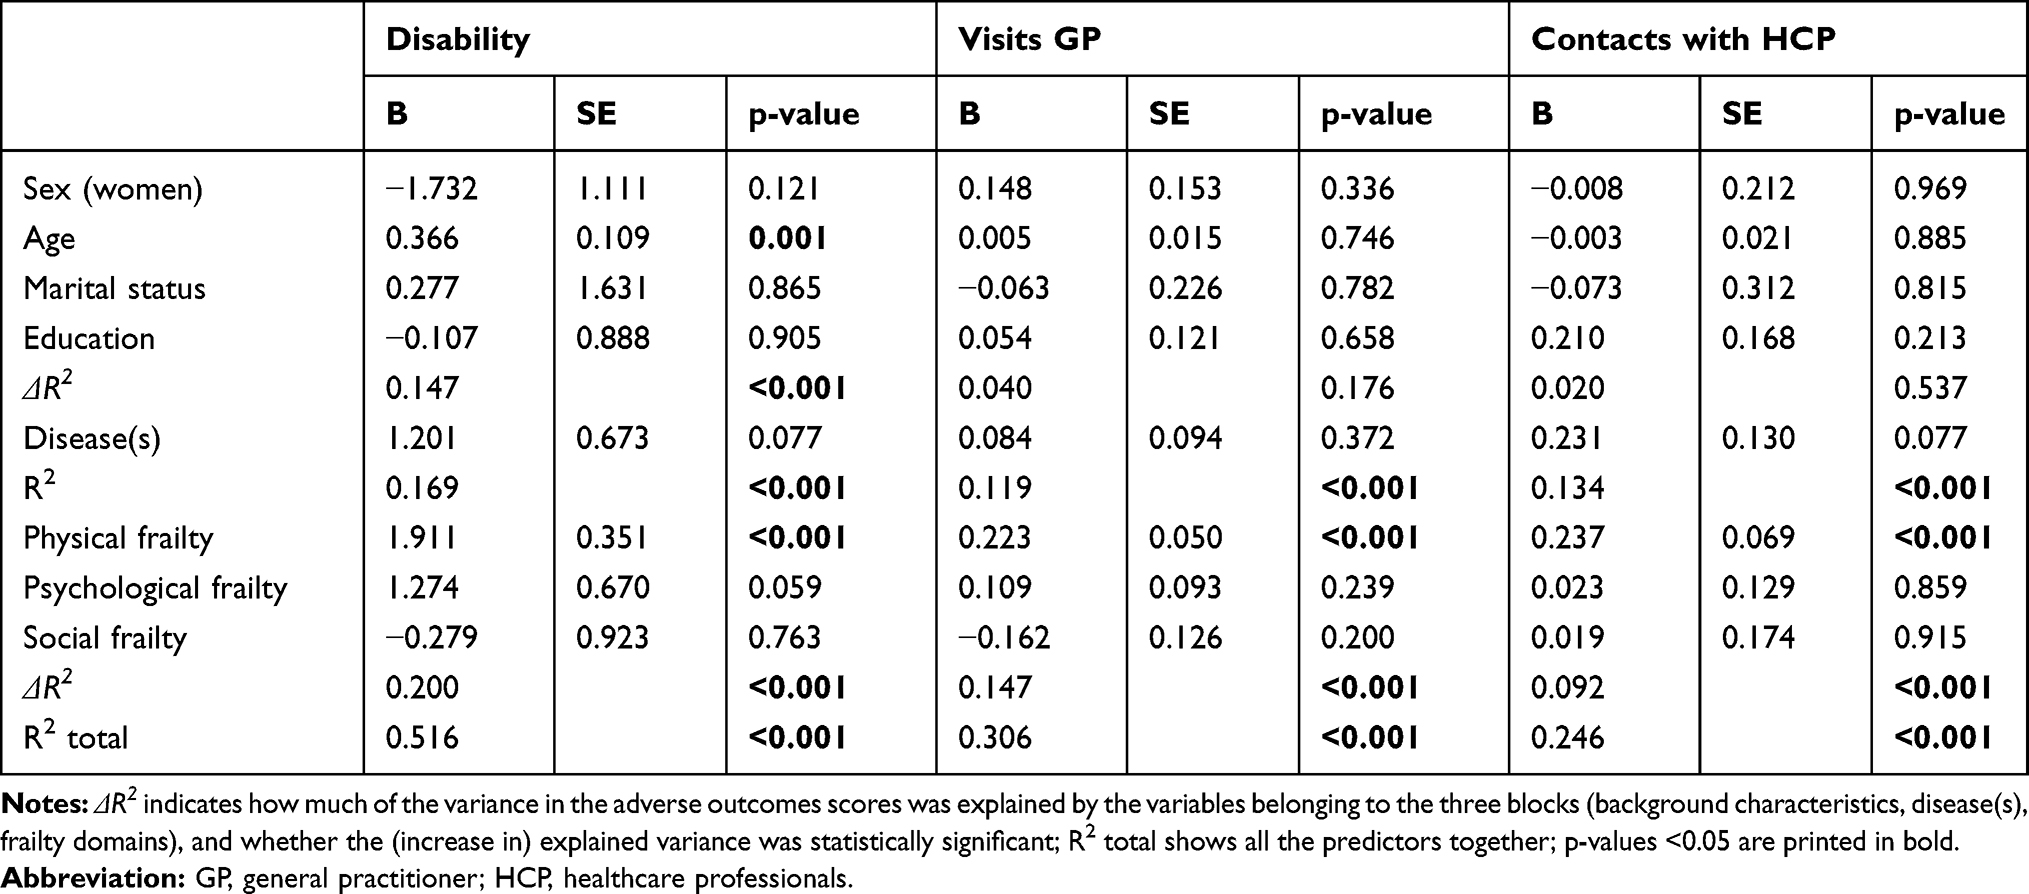 |
Table 3 Cross-Sectional Effects of Background Characteristics, Disease(s), and Frailty Domains on Adverse Outcomes: Linear Regression Analyses |
Table 4 shows the cross-sectional effects of the frailty domains after controlling for background characteristics and disease(s) on the adverse outcomes hospitalization, receiving personal care, receiving nursing, and falls. The logistic regression analyses demonstrated that all three frailty domains together significantly explained receiving personal care and receiving nursing, with p-values 0.039 and 0.021, respectively. Of the individual frailty domains, only physical frailty had a significant effect on one outcome (receiving nursing), after controlling for all the other variables in the model (p-value 0.004).
 |
Table 4 Cross-Sectional Effects of Background Characteristics, Disease(s), and Frailty Domains on Adverse Outcomes: Logistic Regression Analyses |
Predictive Validity: Longitudinal Regression Analyses
Tables 5 and 6 contain exactly the same variables as Tables 3 and 4. They differ because longitudinal effects are presented in Tables 5 and 6. Table 5 shows that all frailty domains together significantly explained the scores on disability (p <0.001), visits general practitioner (p = 0.003), as well as contacts with healthcare professionals (p = 0.020). The explained variance (R2) for disability, visits general practitioner, and contacts with healthcare professionals was 13.0%, 7.3%, and 4.7%, respectively.
 |
Table 5 Longitudinal Effects of Background Characteristics, Disease(s), and Frailty Domains on Adverse Outcomes: Linear Regression Analyses |
 |
Table 6 Longitudinal Effects of Background Characteristics, Disease(s), and Frailty Domains on Adverse Outcomes: Logistic Regression Analyses |
Physical frailty significantly predicted all three adverse outcomes of frailty, after controlling for all the variables in the model; psychological frailty only predicted disability. All effect sizes were small to medium (0.03 < f2 < 0.06). Table 6 demonstrates that all frailty domains together only significantly predicted receiving nursing (p= 0.015); physical frailty was responsible for this finding.
Predictive Validity: ROC (Cross-Sectional, Longitudinal)
To demonstrate the cross-sectional and longitudinal predictive validity of total frailty and the physical domain of frailty, assessed with the TFI, we also calculated the Area Under the Curve (AUC) with confidence interval for adverse disability, hospitalization, receiving personal care, receiving nursing, and falls, as well as the sensitivity and specificity for two cut-off points that provided the best results. The cross-sectional predictive validity of total frailty and physical frailty with respect to disability, receiving personal care, and receiving nursing was excellent, evidenced by AUCs >0.8. The longitudinal predictive validity of total frailty was excellent for disability and receiving personal care; for physical frailty, only the prediction of disability was excellent. In addition, with regard to total frailty and physical frailty the cross-sectional AUCs were good (between 0.7 and 0.8) for falls and mediocre (between 0.6 and 0.7) for hospitalization. The longitudinal predictive validity of total frailty and physical frailty was good for receiving nursing and receiving personal care, respectively, and mediocre for falls.
In most cases, using the cut-off point 5 for total frailty and using the cut-off point 3 for physical frailty ensured the best values for sensitivity and specificity (see Table 7).
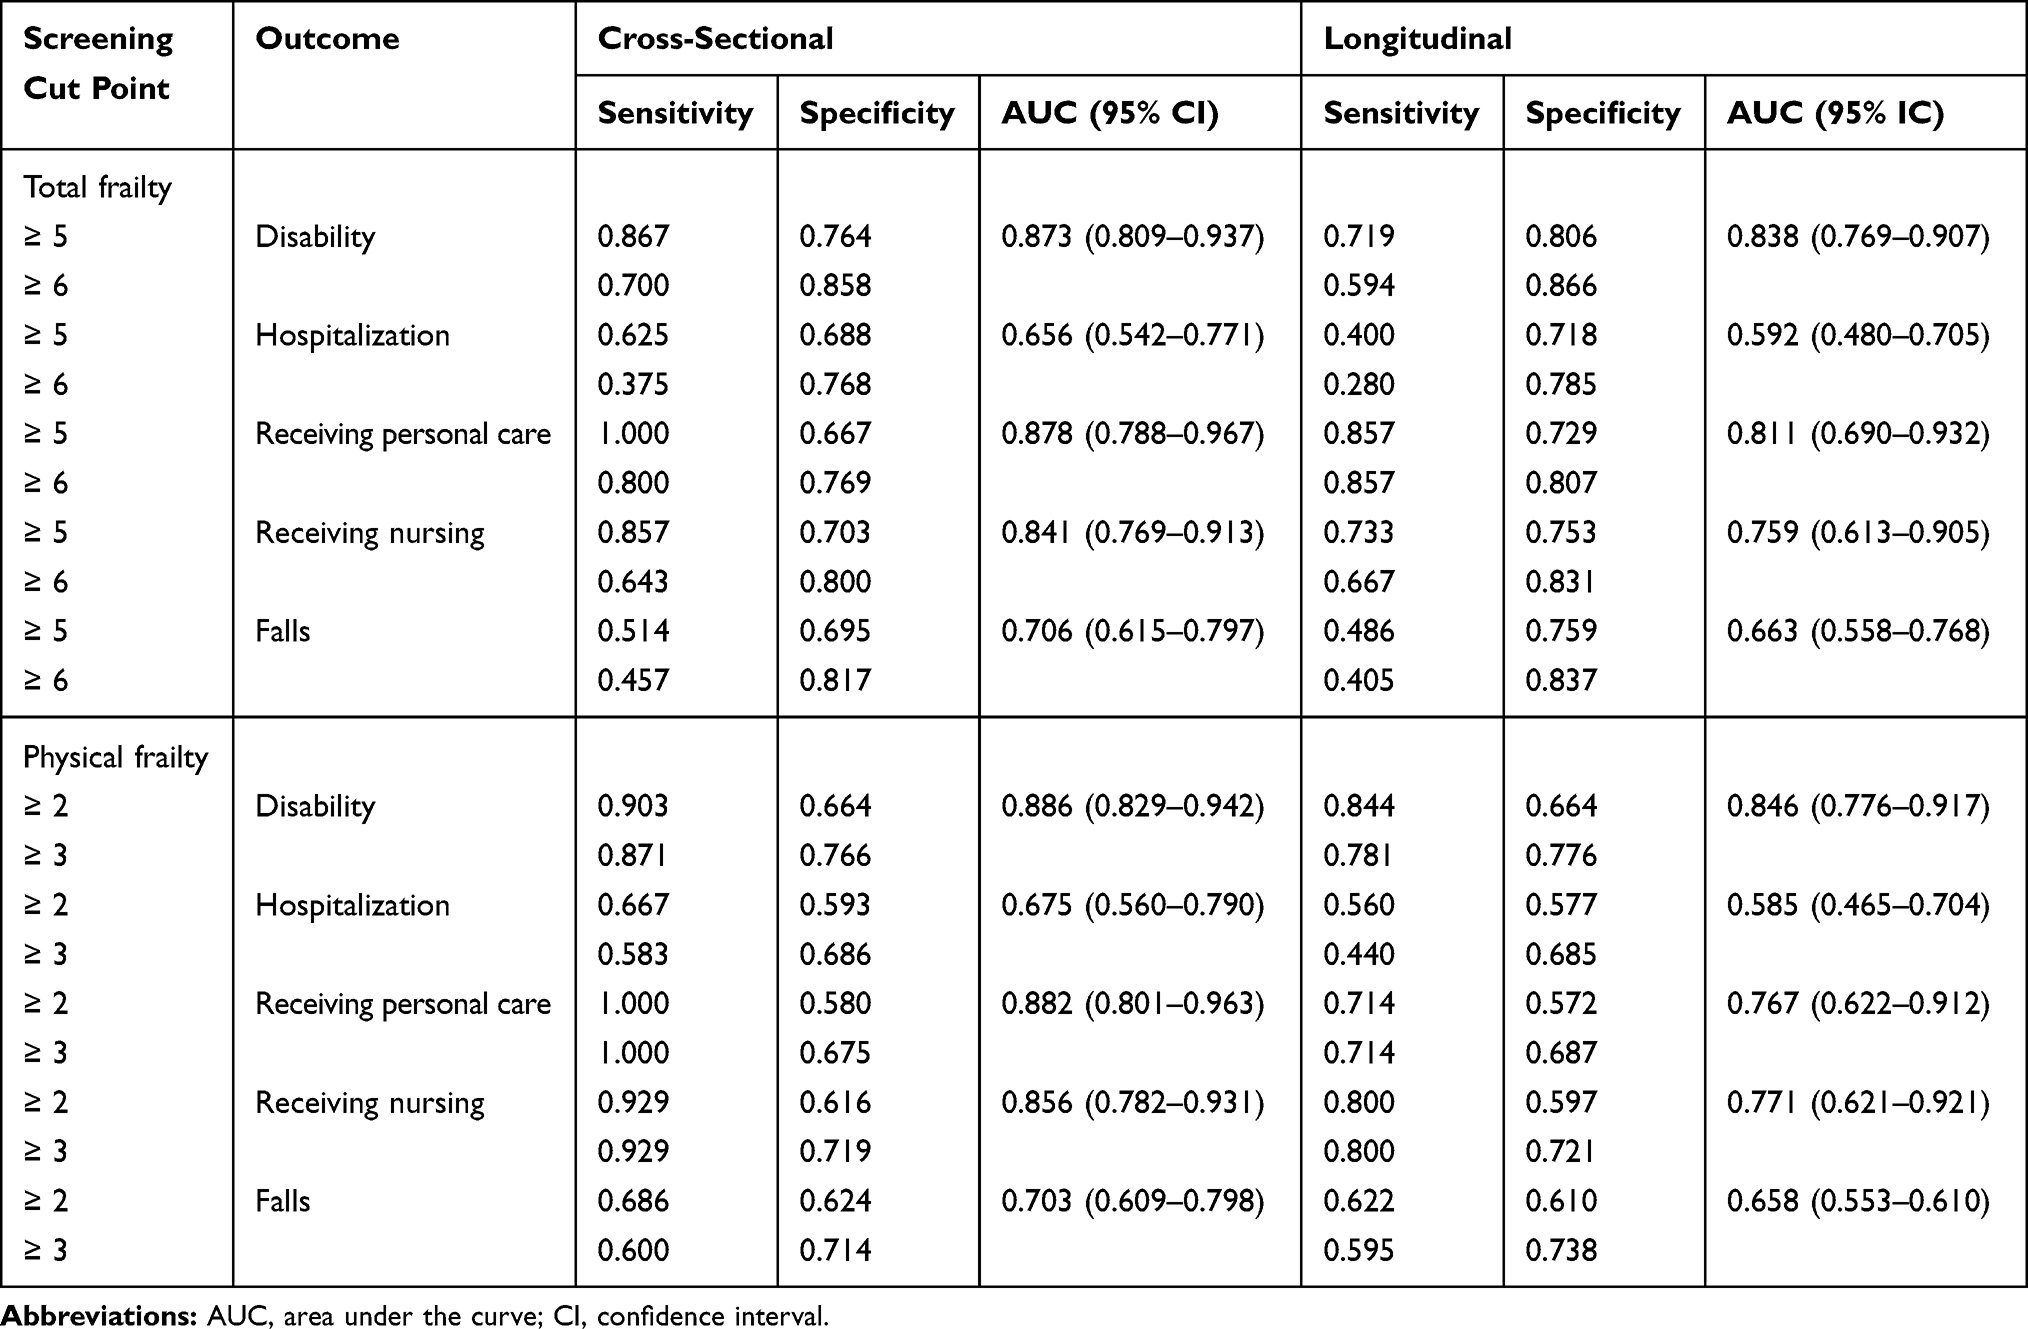 |
Table 7 Predictive Validity of Total Frailty and Physical Frailty Assessed with the TFI: Disability, Indicators of Healthcare Utilization, and Falls |
Discussion
In this study we re-evaluated the validity of the Tilburg Frailty Indicator (TFI), a self-report questionnaire developed for assessing frailty among community-dwelling older people.14 In particular, we focused on determining the predictive validity of the TFI. Therefore, we used a sample of Dutch people aged 70 years and older with a follow-up of one year. We analyzed the data cross-sectionally and longitudinally.
This study corroborates that the TFI is a valid instrument for measuring frailty among community-dwelling older people. The physical and psychological domains of the TFI were significantly correlated as expected with adverse outcomes disability, many indicators of healthcare utilization, and falls. In contrast, social frailty was only correlated with disability and falls. In addition, the regression analyses revealed that all three frailty domains together predicted continuous adverse outcomes disability, visits general practitioner, and contacts with healthcare professionals, in both cross-sectional and longitudinal analyses. However, concerning the dichotomous outcomes, the three frailty domains together predicted only receiving nursing (cross-sectional, longitudinal) and receiving personal care (cross-sectional).
The current study showed that physical frailty was mostly responsible for the effect of frailty on the adverse outcomes; psychological frailty was also responsible for the effect on disability (longitudinal). A previous study, using the physical subscale of the TFI, demonstrated that the individual physical frailty components low physical activity, slowness, and poor endurance predicted disability in a two and a half years follow-up, after controlling for disability at baseline, background characteristics, and the other physical frailty components,30 low physical activity, slowness, and poor endurance, together with unintentional weight loss and weakness, constitute the phenotype of frailty.8 In this study, we found that social frailty, assessed with the subscale of the TFI containing components living alone, lack of social relations referring to loneliness, and lack of social support, predicted none of the adverse outcomes. In other longitudinal studies, the predictive value of social frailty concerning the same outcomes of frailty was also more limited than that of the physical and psychological domains of frailty.17,31,32 As noted before by Gobbens et al,17 an explanation for this finding is that older people do not tend to apply for and use healthcare in the case of social problems. However, if we include lower quality of life as an adverse outcome of frailty than social frailty has an important predictive value among community-dwelling older people, in particular lack of social relations and lack of social support.23,33,34
Using logistic regression analyses, frailty, assessed with the TFI, did not predict hospitalization and falls, after controlling for all the other variables in the model (background characteristics, disease(s)). In a previous Dutch longitudinal study, in a sample of 484 people aged 75 years and older, hospitalization was predicted by the TFI.17 In a sample of 963 Brazilian people, aged 60 years and older, the TFI predicted both hospitalization and falls.35 Mulasso et al showed that the physical and psychological domains of the TFI were significant predictors of falls among 192 community-dwelling older people;36 the TFI was a stronger predictor of falls when compared with the One Leg Standing (OLS) test37 and the Timed Up and Go (TUG) test.38
The predictive validity of total frailty and physical frailty for disability, healthcare utilization, and falls was also confirmed by the AUCs. All AUCs for outcomes disability, receiving personal care, and receiving nursing were good to excellent. The AUCs were comparable with previous studies conducted in the Netherlands;14,17 the AUCs (cross-sectional) for disability were much better than the AUCs determined in Chinese people aged 60 years and older. For example, the AUCs for total frailty in our study was 0.873 versus 73 (ADL disability) and 0.68 (IADL disability) in the Chinese study.39 Moreover, the AUCs for ADL and IADL disability among Portuguese older people (≥65 years) were also lower, 0.72 and 0.63, respectively.21 The large differences in AUCs can be explained by the fact that, in our study, we assessed disability (ADL, IADL) by the GARS and the Chinese and Portuguese studies assessed ADL disability by the Katz Index40 and the Barthel Index,41 respectively, and IADL disability with the Lawton and Brody Scale.42
The present study provided additional evidence that 5 is the most optimal cut-off point for total frailty in Dutch community-dwelling older people. For most of the adverse outcomes, assessed cross-sectionally and longitudinally, sensitivity and specificity were better compared with the cut-off point 6. In Portugal, 6 proved to be the optimal cut-off point,21 while in China it was 4.39 For distinguishing non-physically frail people from physically frail people, the analyses again showed that 3 is the best cut-off point.
As expected, the prevalence of frailty was higher at T1 than at T0, 35.7% versus 29.4%; higher age is, after all, associated with more frailty.2 This immediately explains why both prevalence figures are much lower than in previous Dutch TFI validation studies, 47.1%;14,17 in these studies, the mean age of the participants was 80.3 years compared with 76.3 years (T0) in our study. Additional analyses conducted with people aged ≥75 years (mean age 80.3 years) demonstrated a prevalence figure of 42%.
Some limitations of the study should be noted. First, we used a smaller sample (n=180) than in the previous TFI studies in the Netherlands;14,17 moreover, 12 frailty cases were missing at T1. Second, the time period between T0 and T1 (one year) can be considered short; a future study, in which adverse outcomes are measured at a later stage is recommended. Third, some items belonging to chronic diseases were measured differently at T0 and T1, which explains the large difference in chronic disease “another heart condition”, 18.3% and 11.8%, respectively.
Conclusion
In conclusion, the present study provided new evidence for the validity of the TFI for assessing frailty in Dutch community-dwelling older people. Both cross-sectionally and longitudinally, frailty is associated with disability, indicators of health care utilization, and falls. Most studies concerning the validity of the TFI are focused on independently living older people. It is recommended to also establish the validity of the TFI in other settings including a hospital and a facility for people with psychiatric disorders. Moreover, the predictive validity of the TFI for mortality requires further research. So far, only one study used the original instrument for predicting death;43 this study was conducted among 2420 Dutch community-dwelling older people with a two-year follow-up. With the TFI, health care professionals have access to an extensively validated self-report questionnaire which can be used to identify frailty among community-dwelling older people aiming to prevent or delay adverse outcomes, including disability.
Acknowledgments
The authors would like to thank Inge Renne for her support with the data collection.
Disclosure
The authors report no conflict of interest in this work.
References
1. United Nations Department of Economic and Social Affairs. Population division. World population prospects. The 2015 revision. Key findings and advance tables. Working paper No. ESA/P/WP.241. New York;2015. Available from: https://www.un.org/development/desa/publications/world-population-prospects-2015-revision.html.
2. Collard RM, Boter H, Schoevers RA, Oude Voshaar RC. Prevalence of frailty in community-dwelling older persons: a systematic review. J Am Geriatr Soc. 2012;60(8):1487–1492. doi:10.1111/jgs.2012.60.issue-8
3. Liu HX, Ding G, Yu WJ, et al. Association between frailty and incident risk of disability in community-dwelling elder people: evidence from a meta-analysis. Public Health. 2019;175:90–100. doi:10.1016/j.puhe.2019.06.010
4. Chang SF, Lin HC, Cheng CL. The relationship of frailty and hospitalization among older people: evidence from a meta-analysis. J Nurs Scholarsh. 2018;50(4):383–391. doi:10.1111/jnu.12397
5. Kojima G. Frailty as a predictor of nursing home placement among community-dwelling older adults: a systematic review and meta-analysis. J Geriatr Phys Ther. 2018;41(1):42–48. doi:10.1519/JPT.0000000000000097
6. Kojima G, Iliffe S, Jivraj S, Walters K. Association between frailty and quality of life among community-dwelling older people: a systematic review and meta-analysis. J Epidemiol Community Health. 2016;70(7):716–721. doi:10.1136/jech-2015-206717
7. Shamliyan T, Talley KM, Ramakrishnan R, Kane RL. Association of frailty with survival: a systematic literature review. Ageing Res Rev. 2013;12(2):719–736. doi:10.1016/j.arr.2012.03.001
8. Fried LP, Tangen CM, Walston J, et al. Frailty in older adults: evidence for a phenotype. J Gerontol a Biol Sci Med Sci. 2001;56(3):M146–156. doi:10.1093/gerona/56.3.M146
9. Gobbens RJ, Luijkx KG, Wijnen-Sponselee MT, Schols JM. Towards an integral conceptual model of frailty. J Nutr Health Aging. 2010;14(3):175–181. doi:10.1007/s12603-010-0045-6
10. Gobbens RJ, Luijkx KG, Wijnen-Sponselee MT, Schols JM. Toward a conceptual definition of frail community dwelling older people. Nurs Outlook. 2010;58(2):76–86. doi:10.1016/j.outlook.2009.09.005
11. Mitnitski AB, Mogilner AJ, Rockwood K. Accumulation of deficits as a proxy measure of aging. Sci World J. 2001;1:323–336. doi:10.1100/tsw.2001.58
12. van Kempen JA, Schers HJ, Jacobs A, et al. Development of an instrument for the identification of frail older people as a target population for integrated care. Br J Gen Pract. 2013;63(608):e225–231. doi:10.3399/bjgp13X664289
13. Rolfson DB, Majumdar SR, Tsuyuki RT, Tahir A, Rockwood K. Validity and reliability of the edmonton frail scale. Age Ageing. 2006;35(5):526–529. doi:10.1093/ageing/afl041
14. Gobbens RJ, van Assen MA, Luijkx KG, Wijnen-Sponselee MT, Schols JM. The tilburg frailty indicator: psychometric properties. J Am Med Dir Assoc. 2010;11(5):344–355. doi:10.1016/j.jamda.2009.11.003
15. Fried LP, Ferrucci L, Darer J, Williamson JD, Anderson G. Untangling the concepts of disability, frailty, and comorbidity: implications for improved targeting and care. J Gerontol a Biol Sci Med Sci. 2004;59(3):255–263. doi:10.1093/gerona/59.3.M255
16. Sutton JL, Gould RL, Daley S, et al. Psychometric properties of multicomponent tools designed to assess frailty in older adults: a systematic review. BMC Geriatr. 2016;16(1):55. doi:10.1186/s12877-016-0225-2
17. Gobbens RJ, van Assen MA, Luijkx KG, Schols JM. The predictive validity of the tilburg frailty indicator: disability, health care utilization, and quality of life in a population at risk. Gerontologist. 2012;52(5):619–631. doi:10.1093/geront/gnr135
18. Santiago LM, Luz LL, Mattos IE, Gobbens RJ, van Assen MA. Psychometric properties of the Brazilian version of the tilburg frailty indicator (TFI). Arch Gerontol Geriatr. 2013;57(1):39–45. doi:10.1016/j.archger.2013.03.001
19. Uchmanowicz I, Jankowska-Polanska B, Loboz-Rudnicka M, Manulik S, Loboz-Grudzien K, Gobbens RJ. Cross-cultural adaptation and reliability testing of the tilburg frailty indicator for optimizing care of Polish patients with frailty syndrome. Clin Interv Aging. 2014;9:997–1001. doi:10.2147/CIA.S64853
20. Mulasso A, Roppolo M, Gobbens RJ, Rabaglietti E. The Italian version of the tilburg frailty indicator: analysis of psychometric properties. Res Aging. 2016;38(8):842–863. doi:10.1177/0164027515606192
21. Coelho T, Santos R, Paul C, Gobbens RJ, Fernandes L. Portuguese version of the tilburg frailty indicator: transcultural adaptation and psychometric validation. Geriatr Gerontol Int. 2015;15(8):951–960. doi:10.1111/ggi.12373
22. Andreasen J, Sorensen EE, Gobbens RJ, Lund H, Aadahl M. Danish version of the tilburg frailty indicator - translation, cross-cultural adaption and validity pretest by cognitive interviewing. Arch Gerontol Geriatr. 2014;59(1):32–38. doi:10.1016/j.archger.2014.02.007
23. Renne I, Gobbens RJJ. Effects of frailty and chronic diseases on quality of life in Dutch community-dwelling older adults: a cross-sectional study. Clin Interv Aging. 2018;13:325–334. doi:10.2147/CIA
24. Kempen GI, Suurmeijer TP. The development of a hierarchical polychotomous ADL-IADL scale for noninstitutionalized elders. Gerontologist. 1990;30(4):497–502. doi:10.1093/geront/30.4.497
25. Kempen GI, Miedema I, Ormel J, Molenaar W. The assessment of disability with the groningen activity restriction scale. conceptual framework and psychometric properties. Soc Sci Med. 1996;43(11):1601–1610. doi:10.1016/S0277-9536(96)00057-3
26. Kempen GI, Steverink N, Ormel J, Deeg DJ. The assessment of ADL among frail elderly in an interview survey: self-report versus performance-based tests and determinants of discrepancies. J Gerontol B Psychol Sci Soc Sci. 1996;51(5):P254–260. doi:10.1093/geronb/51B.5.P254
27. Cohen J. Statistical Power Analysis for the Behavioral Sciences.
28. Faul F, Erdfelder E, Lang AG, Buchner A. G*Power3: a flexible statistical power analysis program for the social, behavioral, and biomedical sciences. Behav Res Methods. 2007;39(2):175–191. doi:10.3758/BF03193146
29. Central Committee on Research Involving Human Subjects. Available from: http://www.ccmo.nl/en/your-research-does-it-fall-under-the-wmo.
30. Gobbens RJ, van Assen MA, Schalk MJ. The prediction of disability by self-reported physical frailty components of the Tilburg Frailty Indicator (TFI). Arch Gerontol Geriatr. 2014;59(2):280–287. doi:10.1016/j.archger.2014.06.008
31. Gobbens RJ, van Assen MA. Frailty and its prediction of disability and health care utilization: the added value of interviews and physical measures following a self-report questionnaire. Arch Gerontol Geriatr. 2012;55(2):369–379. doi:10.1016/j.archger.2012.04.008
32. Coelho T, Paul C, Gobbens RJ, Fernandes L. Frailty as a predictor of short-term adverse outcomes. PeerJ. 2015;3:e1121. doi:10.7717/peerj.1121
33. Gobbens RJ, van Assen MA. The prediction of quality of life by physical, psychological and social components of frailty in community-dwelling older people. Qual Life Res. 2014;23(8):2289–2300. doi:10.1007/s11136-014-0672-1
34. Gobbens RJ, Luijkx KG, van Assen MA. Explaining quality of life of older people in the Netherlands using a multidimensional assessment of frailty. Qual Life Res. 2013;22(8):2051–2061. doi:10.1007/s11136-012-0341-1
35. Santiago LM, Gobbens RJJ, van Assen M, Carmo CN, Ferreira DB, Mattos IE. Predictive validity of the Brazilian version of the Tilburg Frailty Indicator for adverse health outcomes in older adults. Arch Gerontol Geriatr. 2018;76:114–119. doi:10.1016/j.archger.2018.02.013
36. Mulasso A, Roppolo M, Gobbens RJ, Rabaglietti E. Mobility, balance and frailty in community-dwelling older adults: what is the best 1-year predictor of falls? Geriatr Gerontol Int. 2016. doi:10.1111/ggi.12893
37. Bohannon RW. Single limb stance times: a decriptive meta-analysis of data from individuals at least 60 years of age. Top Geriatr Rehabil. 2006;22(1):70–77. doi:10.1097/00013614-200601000-00010
38. Podsiadlo D, Richardson S. The timed “Up & Go”: a test of basic functional mobility for frail elderly persons. J Am Geriatr Soc. 1991;39(2):142–148. doi:10.1111/j.1532-5415.1991.tb01616.x
39. Dong L, Liu N, Tian X, et al. Reliability and validity of the Tilburg Frailty Indicator (TFI) among Chinese community-dwelling older people. Arch Gerontol Geriatr. 2017;73:21–28. doi:10.1016/j.archger.2017.07.001
40. Katz S, Ford AB, Moskowitz RW, Jackson BA, Jaffe MW. Studies of illness in the aged. The index of adl: a standardized measure of biological and psychosocial function. JAMA. 1963;185:914–919. doi:10.1001/jama.1963.03060120024016
41. Mahoney FI, Barthel DW. Functional evaluation: the barthel index. Md Med J. 1965;14:61–65.
42. Lawton MP, Brody EM. Assessment of older people: self-maintaining and instrumental activities of daily living. Gerontologist. 1969;9(3):179–186. doi:10.1093/geront/9.3_Part_1.179
43. Op Het Veld LPM, Beurskens A, de Vet HCW, et al. The ability of four frailty screening instruments to predict mortality, hospitalization and dependency in (instrumental) activities of daily living. Eur J Ageing. 2019;16(3):387–394. doi:10.1007/s10433-019-00502-4
 © 2020 The Author(s). This work is published and licensed by Dove Medical Press Limited. The
full terms of this license are available at https://www.dovepress.com/terms
and incorporate the Creative Commons Attribution
- Non Commercial (unported, 3.0) License.
By accessing the work you hereby accept the Terms. Non-commercial uses of the work are permitted
without any further permission from Dove Medical Press Limited, provided the work is properly
attributed. For permission for commercial use of this work, please see paragraphs 4.2 and 5 of our Terms.
© 2020 The Author(s). This work is published and licensed by Dove Medical Press Limited. The
full terms of this license are available at https://www.dovepress.com/terms
and incorporate the Creative Commons Attribution
- Non Commercial (unported, 3.0) License.
By accessing the work you hereby accept the Terms. Non-commercial uses of the work are permitted
without any further permission from Dove Medical Press Limited, provided the work is properly
attributed. For permission for commercial use of this work, please see paragraphs 4.2 and 5 of our Terms.