Back to Journals » International Journal of Nanomedicine » Volume 12
The response of human osteoblasts, epithelial cells, fibroblasts, macrophages and oral bacteria to nanostructured titanium surfaces: a systematic study
Authors Miao X ![]() , Wang D, Xu L, Wang J, Zeng D, Lin S, Huang C
, Wang D, Xu L, Wang J, Zeng D, Lin S, Huang C ![]() , Liu X, Jiang X
, Liu X, Jiang X
Received 5 November 2016
Accepted for publication 2 January 2017
Published 20 February 2017 Volume 2017:12 Pages 1415—1430
DOI https://doi.org/10.2147/IJN.S126760
Checked for plagiarism Yes
Review by Single anonymous peer review
Peer reviewer comments 2
Editor who approved publication: Professor Lei Yang
Xinchao Miao, 1,2,* Donghui Wang, 3,4,* Lianyi Xu, 1,2 Jie Wang, 1,2 Deliang Zeng, 1,2 Shuxian Lin, 1,2 Cui Huang, 5 Xuanyong Liu, 3 Xinquan Jiang 1,2
1Department of Prosthodontics, 2Oral Bioengineering Lab, Shanghai Research Institute of Stomatology, Ninth People’s Hospital Affiliated to Shanghai Jiao Tong University, School of Medicine, Shanghai Key Laboratory of Stomatology, 3State Key Laboratory of High Performance Ceramics and Superfine Microstructure, Shanghai Institute of Ceramics, Chinese Academy of Sciences, 4University of Chinese Academy of Sciences, Beijing, 5The State Key Laboratory Breeding Base of Basic Science of Stomatology (Hubei-MOST) & Key Laboratory of Oral Biomedicine Ministry of Education (KLOBM), School & Hospital of Stomatology, Wuhan University, Wuhan, Hubei, People’s Republic of China
*These authors contributed equally to this work
Abstract: Nanotopography modification is a major focus of interest in current titanium surface design; however, the influence of the nanostructured surface on human cell/bacterium behavior has rarely been systematically evaluated. In this study, a homogeneous nanofiber structure was prepared on a titanium surface (Nano) by alkali-hydrothermal treatment, and the effects of this Nano surface on the behaviors of human MG-63 osteoblasts, human gingival epithelial cells (HGECs) and human gingival fibroblasts (HGFs) were evaluated in comparison with a smooth titanium surface (Smooth) by polishing and a micro-rough titanium surface (Micro) by sandblasting and acid etching. In addition, the impacts of these different surface morphologies on human THP-1 macrophage polarization and Streptococcus mutans attachment were also assessed. Our findings showed that the nanostructured surface enhanced the osteogenic activity of MG-63 cells (Nano=Micro>Smooth) at the same time that it improved the attachment of HGECs (Nano>Smooth>Micro) and HGFs (Nano=Micro>Smooth). Furthermore, the surface with nanotexture did not affect macrophage polarization (Nano=Micro=Smooth), but did reduce initial bacterial adhesion (Nano<Smooth<Micro). These results suggest that the nanostructured titanium surface may promote bone and soft tissue healing, and thereby increase the success and survival of dental implants.
Keywords: nanotopography, osteogenic differentiation, soft tissue barrier, macrophage polarization, antimicrobial effect
Corrigendum for this paper has been published
Introduction
Titanium implants, due to their predictable performance in the clinic, have been widely used in the dental field for the replacement of missing teeth.1 Upon its placement in the jaw, an implant must interface successfully with three types of cells, including osteoblasts from the bone and epithelial cells plus the underlying fibroblasts from the soft tissue.2,3 Among these cells, osteoblasts secrete matrix proteins and deposit bone mineral for osteogenesis and osseointegration to withstand occlusal loading, whereas epithelial cells and fibroblasts adhere to the transmucosal component to form a barrier to protect the underlying bone tissues.3,4 Moreover, implant surfaces are exposed to a bacteria-rich environment and rapidly become colonized by oral bacteria that can compete with epithelial and connective tissues and cells for binding to the implant surface.5 Bacterial accumulation may result in infection, destruction of the tissue-implant integration or even implant failure; accordingly, inhibiting bacterial adhesion would be conducive to the success and survival of implants.6–8
Furthermore, advanced studies have addressed the crucial role of macrophages in regulating early tissue healing.9,10 Macrophages are a heterogeneous population, as they can be activated to either a classical M1 phenotype for promoting the inflammatory response or an alternative M2 phenotype for the resolution of inflammation and subsequent wound healing.10–12 Although rapid physiological resolution of inflammation is conducive to tissue healing, continued chronic inflammation would result in the hyperplasia of fibrotic scar tissue, ultimately leading to implant failure.13,14 Therefore, it would also be beneficial for early tissue healing and implant success to control the inflammatory process through macrophage polarization.
It is well known that surface properties, including topography and chemistry, are primarily important in establishing the response of tissues to implants.15,16 Persistent efforts have been made in recent decades to promote tissue healing for early loading via modifying the implant surface. It has been recognized that microrough titanium surfaces (eg, surfaces treated by sandblasting and acid etching [SLA]) could improve osteoblastic activity and osseointegration. However, roughened surfaces are also associated with increased bacterial accumulation and inadequate epithelial cell adhesion, which may increase the chances of infection, with subsequent risk of implant failure.17–20 Recently, nanotopography modification of titanium substrates for accelerating tissue healing has become a major focus of interest.21,22 Several methods have been developed to produce nanotopography, among which chemical treatment (eg, alkali treatment) is widely used due to its good operability and flexibility.23,24 In our previous work, a homogeneous nanofiber structure was prepared by alkali-hydrothermal treatment (NaOH and H2O2), and this method showed enhanced osteogenic activity of osteoblasts in comparison to implants with a smooth surface.25 In addition, this nanotopography could also act as a delivery platform for the sustained and controlled release of bioactive ions, thus further improving the biocompatibility. However, the advantage of this nanostructured surface over the widely used microrough surface in practice is unclear, especially in terms of osteogenic capability.26 Furthermore, knowledge of how the nanotopography influences the soft tissue cells, macrophages and early-colonizing bacteria is currently limited.
In this study, we systematically evaluated the effects of the nanotopography prepared by alkali-hydrothermal treatment on the behaviors of human MG-63 osteoblasts, human gingival epithelial cells (HGECs), human gingival fibroblasts (HGFs), human THP-1 macrophages and early bacterial attachment using Streptococcus mutans in comparison to smooth surfaces by polishing and microrough surfaces by SLA. Our work provides an overview of the relative merits of the promising nanotopography and would also provide guidelines for subsequent surface bioactive ion modification that overcomes its potential drawbacks for better tissue integration.
Materials and methods
Specimen fabrication and characterization
Pure titanium plates with dimensions of 10×10×1 mm and 20×20×1 mm were machined and divided into three groups as follows: 1) Smooth sample: samples were polished using multiple sandpapers, cleaned ultrasonically in ethanol, deionized water and ultrapure water, sequentially, and dried in an ambient atmosphere (ie, 0.1 MPa at 25°C and relative humidity between 40% and 50%). 2) Micro sample: smooth samples were sandblasted with alumina particles 100 μm in size under air pressure of 0.6 MPa and then acid etched with a mixed solution of acid (18% HCl: 48% H2SO4, v:v=1:1) at 60°C for 4 hours. 3) Nano sample: Smooth samples were subjected to alkali-hydrothermal treatment to construct the nanostructure.27 Briefly, Smooth samples were immersed in a mixed solution of 7.5 mL H2O2 (30%) and 2.5 mL NaOH (5 M) aqueous solution in a reaction vessel with a teflon lining at 80°C for 24 hours. After cooling to room temperature (RT; 25°C) naturally, the samples were gently rinsed with deionized water and then immersed in 0.1 M HCl aqueous solution for 2 hours to dissolve the NaOH left on the sample surfaces. Finally, the samples were washed to neutral pH with deionized water, dried in an ambient atmosphere and annealed at 450°C for 1 hour to obtain the nanostructure. Prior to use, all groups were ultrasonically cleaned in acetone, anhydrous ethanol and distilled water, sequentially.
The surface topographies were examined using field-emission scanning electron microscopy (FE-SEM; Magellan 400, FEI, Hillsboro, OR, USA) with an acceleration voltage of 15 kV. The crystallinity of the films was characterized using an X-ray diffractometer (XRD; Rigaku, Tokyo, Japan) fitted with a Cu-Kα (λ=1.541 Å) source at 40 kV and 100 mA. The scans were conducted in the range of 2θ=15°–80° with a step size of 0.02°, and the glancing angle of the incident beam against the surface of the specimen was fixed at 1°. The chemical composition of the titanium surfaces was determined by X-ray photoelectron spectroscopy (XPS; PHI 5802 system, Physical Electronics Inc, Eden Prairie, MN, USA) with an Al Kα (1,486.6 eV) source. The roughness measurements were performed using a surface profiler (HOMMEL TESTER T8000, Hommel, Villingen-Schwenningen, Germany) with a scan distance of 5.0 mm and a scan speed of 0.1 mm/s. The surface wettability was examined using a surface-contact angle machine (Automatic Contact Angle Meter Model SL200B, Solon Information Technology Co., Ltd., Shanghai, People’s Republic of China) and was performed in an ambient environment using 2 μL of sessile distilled water droplets.28
Behavior of human osteoblasts on different samples
Human MG-63 osteoblasts (Institute of Biochemistry and Cell Biology, Chinese Academy of Science, Shanghai, People’s Republic of China) were cultured in Dulbecco’s Modified Eagle’s Medium (DMEM; HyClone, South Logan, UT, USA) supplemented with 10% fetal bovine serum (FBS; Thermo Fisher Scientific, Waltham, MA, USA) and 1% penicillin/streptomycin (Thermo Fisher Scientific) at standard culture conditions (37°C and 5% CO2), with the culture media changed every 2 days. MG-63 cells were subcultured using trypsin-ethylenediaminetetraacetic acid (EDTA; Thermo Fisher Scientific), and cells at passages 3–6 were used in this study.
MG63 cells (2.0×10⁴ cells/well) were seeded onto different samples in 24-well plates, with culture media replaced every 2 days. The cell morphology was inspected after culturing for 24 hours. The cell proliferation was evaluated after 1, 3 and 5 days. The intracellular alkaline phosphatase (ALP) activity and the immunofluorescence staining of osteocalcin (OCN; Abcam, Cambridge, MA, USA) were examined at 14 days. For quantitative real-time polymerase chain reaction (qRT-PCR) to assess osteogenesis-related gene expression, 8.0×10⁴ cells/well were seeded onto the specimens in 6-well plates and cultured for 7 days and 14 days.
Behaviors of HGECs and HGFs on different samples
Healthy human gingival tissues were obtained from tissues overlying the affected third molar teeth of adult subjects during the course of surgery. The research protocol was approved by the Independent Ethics Committee of Shanghai Ninth People’s Hospital affiliated to Shanghai JiaoTong University, School of Medicine, and written informed consent was obtained from each donator. The explants were submerged in dispase II solution (2.0 U/mL; Roche, Basel, Switzerland) overnight at 4°C to separate the epithelium layer from the underlying connective tissue. After mincing 1–2 mm2 pieces, the epithelium fragments were incubated in trypsin-EDTA at 37°C for 10 minutes to isolate HGECs.29,30 Then, the cells were collected and fed with defined keratinocyte–serum-free medium (Thermo Fisher Scientific) supplemented with 1% penicillin/streptomycin, with culture media refreshed every 2 days. The remaining gingival connective tissues were placed in DMEM containing 10% FBS and 1% penicillin/streptomycin, where they were cut into 2–3 mm2-sized pieces. HGFs were cultured from these connective tissue pieces in DMEM with culture media changed every 3 days.31 Both HGECs and HGFs were subcultured using trypsin-EDTA, and cells from passages 2–4 were used.
HGECs (5.0×10⁴ cells/well) or HGFs (2.0×10⁴ cells/well) were seeded onto the samples in 24-well plates with culture media replaced every 2 days. The cell morphology was evaluated after 24 hours. The cell proliferation was measured after 1, 3 and 5 days. After incubation for 24 hours, the immunofluorescence staining of integrin β4 (Abcam) was performed for HGECs, whereas the staining of vinculin (KeyGen Biotech, Nanjing, People’s Republic of China) was performed with HGFs. For evaluating the adhesion-related gene expression, HGECs (4.0×10⁵ cells/well) or HGFs (3.0×10⁵ cells/well) were seeded onto the Ti specimens in 6-well plates and incubated for 24 hours.
Behavior of human macrophage polarization on different samples
Cells from the human monocytic cell line THP-1 (Institute of Biochemistry and Cell Chinese Academy of Science) were maintained in Roswell Park Memorial Institute (RPMI) 1640 medium (Thermo Fisher Scientific) containing 10% FBS and 1% penicillin/streptomycin. Cells were subcultured every 3 days.
For the differentiation of THP-1 monocytes to macrophages, cells at passages 3–6 were seeded onto the samples in 24-well plates (1.0×10⁵ cells/well) or 6-well plates (1.0×10⁶ cells/well) in RPMI/10% FBS containing 100 ng/mL phorbol 12-myristate 13-acetate (PMA; Thermo Fisher Scientific) and allowed to attach to the samples overnight. Then, adherent M0-differentiated cells were treated with random phase multiple access RPMI/10% FBS alone (M0 control), or with RPMI/10% FBS containing 20 ng/mL interferon gamma (IFN-γ; PeproTech, Rocky Hill, NJ, USA), plus 100 ng/mL lipopolysaccharide (LPS; Sigma-Aldrich, St Louis, MO, USA) for M1 polarization or containing 20 ng/mL interleukin-4 (IL-4; PeproTech) for M2 polarization. After 24 hours of incubation, the cell morphology, gene expression and protein level for C–C chemokine receptor type 7 (CCR7; Abcam) and cluster of differentiation 206 (CD206; Abcam) of M0, M1 and M2 were analyzed to evaluate the effects of different surface morphologies on the behavior of the macrophage polarization.
Protocol for cell experiment
For cell morphology characterization, the samples were fixed in 2.5% glutaraldehyde and dehydrated in a graded ethanol series. After lyophilization, desiccation and gold sputter coating, the cells on samples were visualized by scanning electron microscope (SEM; Hitachi S-3400, Tokyo, Japan).
The cell proliferation on samples was examined using a colorimetric assay using the WST-8 kit (Dojindo; Kumamoto, Japan) and 4′,6-diamidino-2-phenylindole (DAPI) staining (Sigma-Aldrich) following the manufacturer’s instructions.
For qRT-PCR, total ribonucleic acid from the samples was isolated using Trizol reagent (TaKaRa, Tokyo, Japan), and cDNAs were generated using Transcriptor First Strand cDNA Synthesis Kit (Roche). qRT-PCR was conducted using FastStart Essential DNA Green Master (Roche) on a real-time PCR system (LightCycler 480, Roche). Data were analyzed using the 2−ΔΔCT method.32 Glyceraldehyde 3-phosphate dehydrogenase was used as a loading control, and the Smooth sample was used as control. The primers used are shown in Table 1.
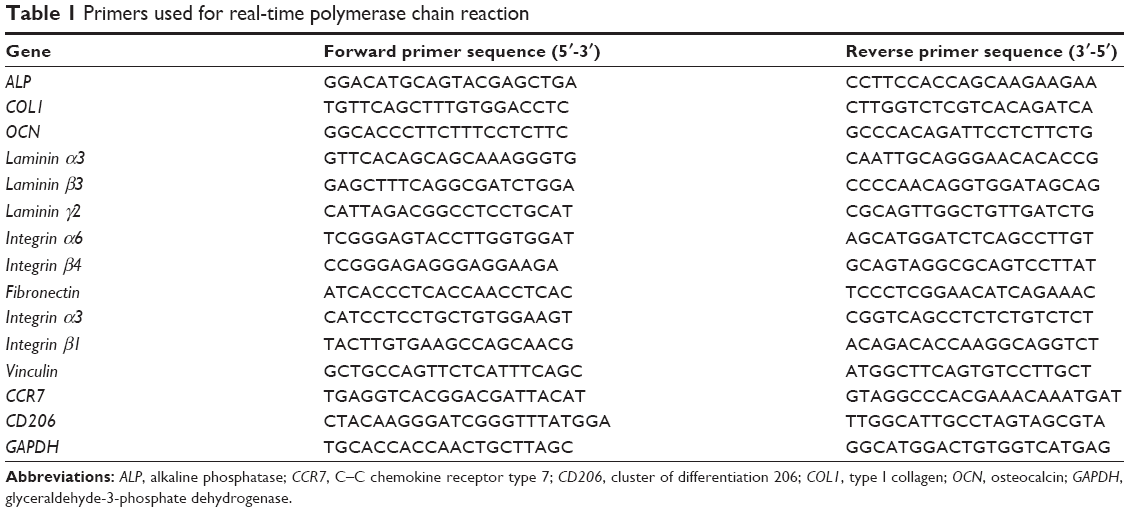 | Table 1 Primers used for real-time polymerase chain reaction |
The intracellular ALP activity was quantified by detecting optical density values at 405 nm using a SpectraMax M5 plate reader (Molecular Devices, Sunnyvale, CA, USA) after samples were incubated with p-nitrophenyl phosphate (Sigma-Aldrich) at 37°C for 30 minutes. The results were normalized using the total protein amounts, which were calculated using a bicinchoninic acid protein assay kit (Beyotime, Jiangsu, People’s Republic of China).
For immunofluorescence staining, the samples were fixed in 4% paraformaldehyde for 15 minutes, permeabilized with 0.2% Triton X-100 for 10 minutes and blocked in 1% bovine serum albumin (Sigma-Aldrich) for 1 hour at RT. Then, the samples were incubated with primary antibody at a 1/100 dilution for 1 hour at RT. Cyanine Cy™3-conjugated secondary antibodies (Jackson Immunoresearch Laboratories, West Grove, PA, USA) diluted 1/200 was used for another 1 hour at RT. The cytoskeleton and nucleus were stained with fluorescein isothiocyanate-phalloidin (Sigma-Aldrich) and DAPI, respectively. The samples were observed using a confocal laser scanning microscope (Leica, Hamburg, Germany).
Behavior of S. mutans on different samples
S. mutans UA159 (American Type Culture Collection) was maintained in tryptic soy (Sigma-Aldrich) agar and cultured in tryptic soy broth for 24 hours at 37°C and 5% CO2. For bacterial adhesion, a solution containing the bacteria at a concentration of 108 colony forming units (CFU)/mL was seeded on each sample to a density of 0.06 mL/cm2. The samples with bacterial solution were incubated for 1 hour. The dissociated bacterial solution was collected and inoculated into a standard agar culture medium. After 24 hours of incubation at 37°C, the active bacteria were counted according to the National Standard of China GB/T 4789.2 protocol. In the SEM examination, a solution containing the bacteria at a concentration of 108 CFU/mL was introduced onto each sample to a density of 0.06 mL/cm2, incubated at 37°C for 1 hour, fixed, and dehydrated according to the same protocol for cells.
For biofilm formation, a solution containing the bacteria at a concentration of 107 CFU/mL was seeded on each sample to a density of 0.06 mL/cm2. The samples with bacterial solution were incubated for 24 hours. The biofilm formation on each sample was evaluated using the bacteria counting method and SEM as described above.
Statistical analysis
Experiments were performed in triplicate. For continuous results, the data were expressed as the mean ± standard deviation. Statistically significant differences (P<0.05) among the three groups were identified by one-way analysis of variance and Student Newman–Keuls post hoc analysis using Statistical Package for the Social Sciences (SPSS) software (version 19.0; Chicago, IL, USA) and GraphPad Prism (version 5; La Jolla, CA, USA).
Results
Characterization of samples
Surface morphology and composition
The surface topographies of the Smooth, Micro and Nano samples were investigated with FE-SEM. There were clear differences among the specimens (Figure 1A). After the polishing procedure, the majority of the Smooth sample appeared flat and smooth, although some visible scratches and irregular pits could also be observed. The Micro sample prepared by SLA exhibited a typical rough surface with microporous morphology, which showed round micropits distributed over the surface. In addition, numerous secondary micropores, inhabiting the rough macrotexture, could also be observed. After alkali-hydrothermal treatment, the Nano sample displayed a gradual peak-to-valley morphology at a low magnification. At a high magnification, a homogeneous unique nanofiber texture was formed on the Nano surface, nearly perpendicular to the substrate. XRD and XPS tests were conducted to examine the crystalline phase and chemical compositions, respectively. On the basis of the results presented in Figure S1 and Table S1, all of the sample surfaces were composed of the crystalline phase of TiO2 and Ti with a similar Ti/O ratio.
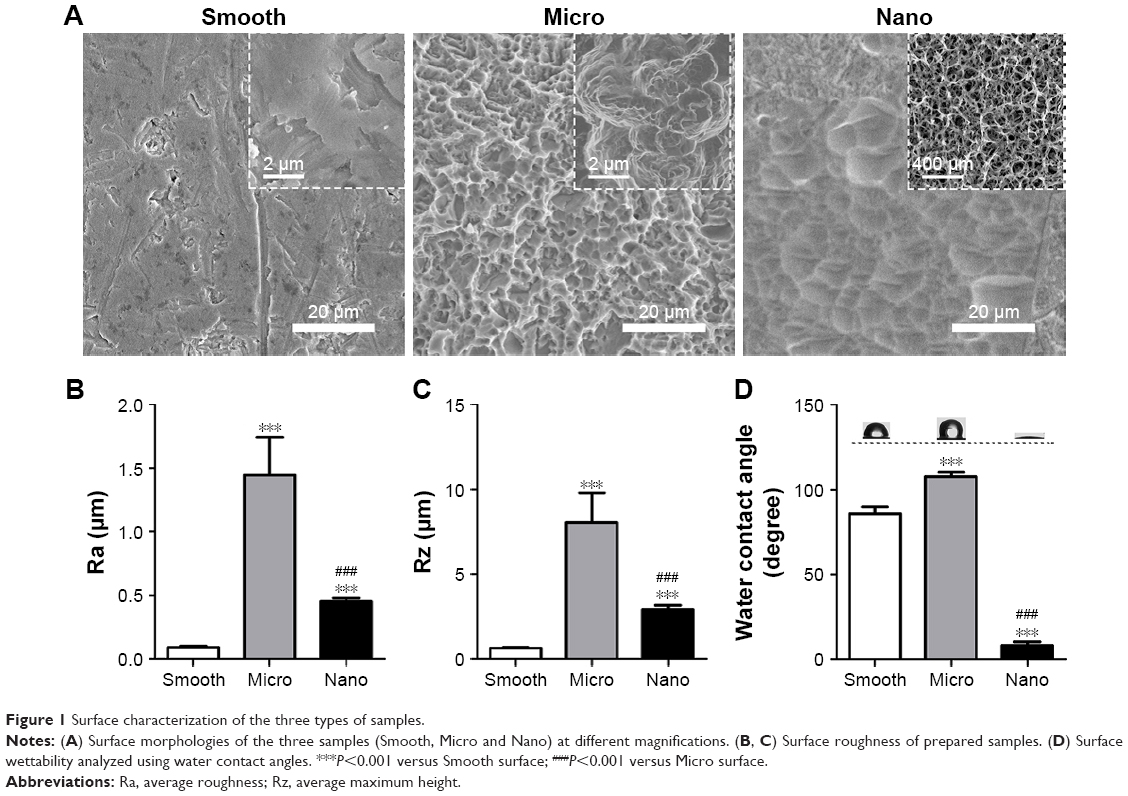 | Figure 1 Surface characterization of the three types of samples. |
Surface roughness
The surface roughness is graphically shown as the values of Ra (average roughness) and Rz (average maximum height; Figure 1B and C). The Ra of the Smooth sample was 0.09±0.01 μm, whereas the Nano sample exhibited a slightly rougher surface (Ra =0.45±0.03 μm). A much rougher surface was observed on the Micro sample, with an Ra value of 1.44±0.30 μm. In addition to the Ra value, the Rz of the Smooth, Nano and Micro samples we measured were 0.63±0.05 μm, 2.92±0.25 μm and 8.05±1.72 μm, respectively. The large differences between the Ra and Rz in the Micro and Nano samples revealed that these two surfaces were mainly composed of high peak and valley types of structures.
Surface wettability
Wetting angle measurements are presented in Figure 1D. The contact angles of the water droplets on Smooth, Micro and Nano samples were 85.57°±4.45°, 107.46°±2.90° and 8.10°±2.22°, respectively, indicating that the Nano surface had excellent hydrophilicity.
Behavior of human MG-63 osteoblasts on different samples
Cell morphology, proliferation and osteogenesis activity were monitored to evaluate the impacts of different surfaces on the behavior of human MG-63 osteoblasts (Figures 2 and S2).
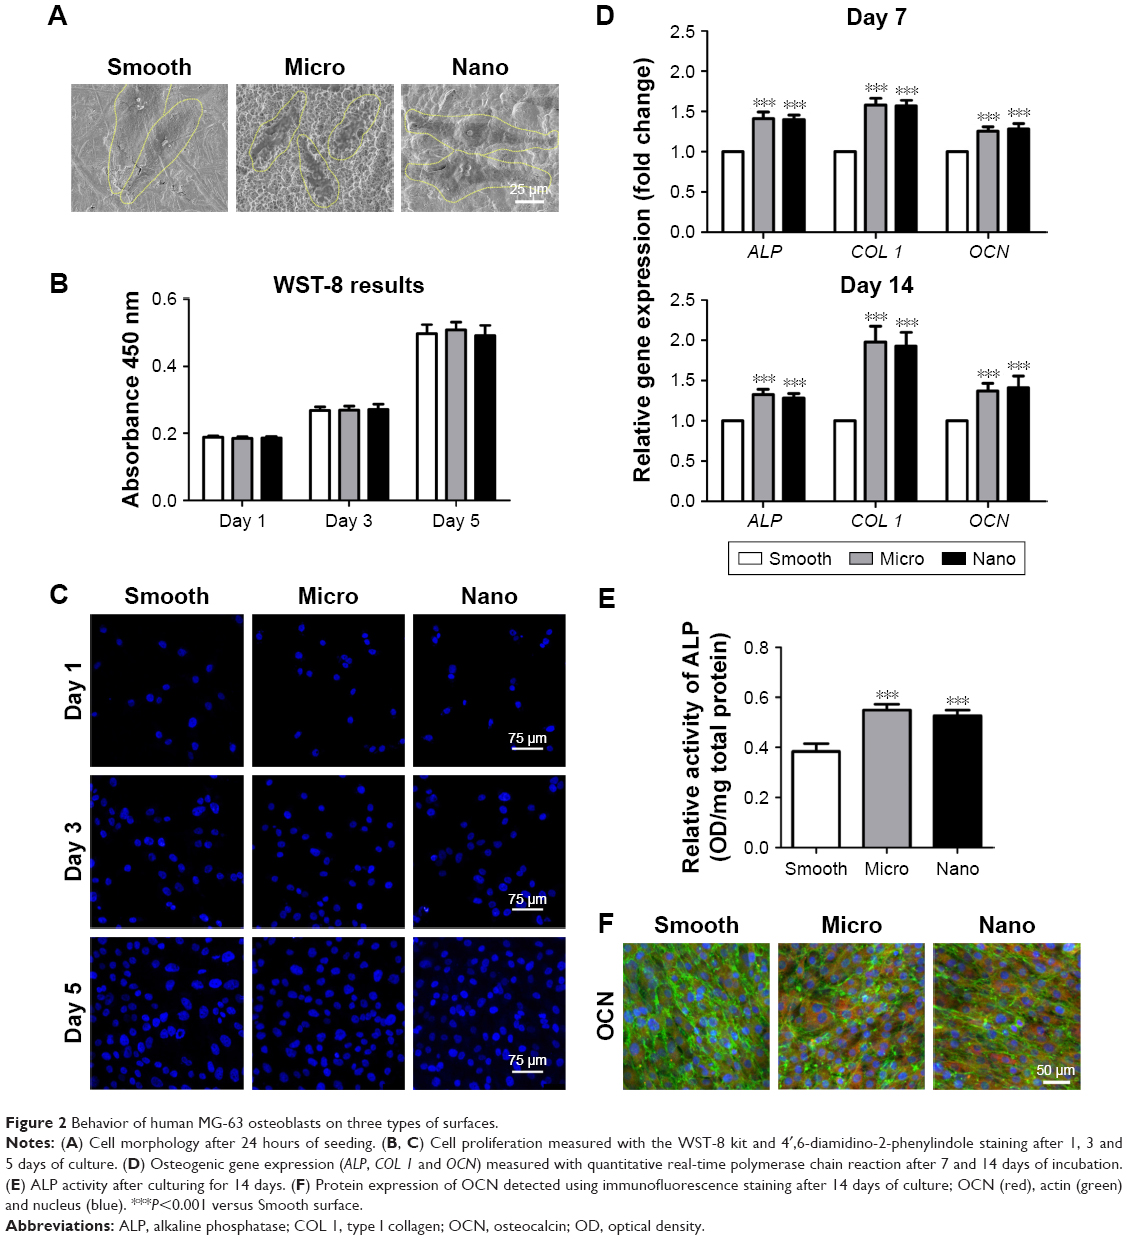 | Figure 2 Behavior of human MG-63 osteoblasts on three types of surfaces. |
Cell morphology
The morphology of the MG-63 cells on samples was observed using SEM. After 24 hours of incubation, MG-63 cells on the Smooth sample displayed a spindle shape, whereas on Micro and Nano samples, the cells exhibited polygonal morphology with lamellipodia extension (Figure 2A).
Cell proliferation
The cell proliferation activity was assessed using the WST-8 assay (Figure 2B) and DAPI staining (Figure 2C) after 1, 3 and 5 days of incubation on these three types of surfaces. In all groups, the cell numbers increased rapidly with time, and no significant differences were observed among the different surfaces through all these three culture times, indicating that the cell proliferation was clearly not related to the surface morphology.
Osteogenesis activity
The relative gene expression of osteogenic markers, including ALP, type I collagen (COL 1) and OCN, was detected by qRT-PCR after incubation on different samples for 7 days and 14 days. Meanwhile, the intracellular ALP activity and immunofluorescence staining of OCN were also evaluated after 14 days. As presented in Figure 2D and E, the gene expression levels of osteogenesis-related factors (ALP, COL 1 and OCN) and the intracellular ALP activity on different samples generally followed the ranking of Nano sample=Micro sample>Smooth sample. In addition, immunofluorescence staining revealed that the protein expression level of OCN in osteoblasts on the Nano sample was similar to those on the Micro sample, whereas cells on the Nano and Micro surfaces showed stronger expression of OCN when compared with those on the Smooth sample (Figures 2F and S2).
Behavior of HGECs on different samples
Cell morphology, adhesion activity and proliferation ability were detected to assess the influence of different morphologies on the behavior of HGECs (Figures 3 and S3).
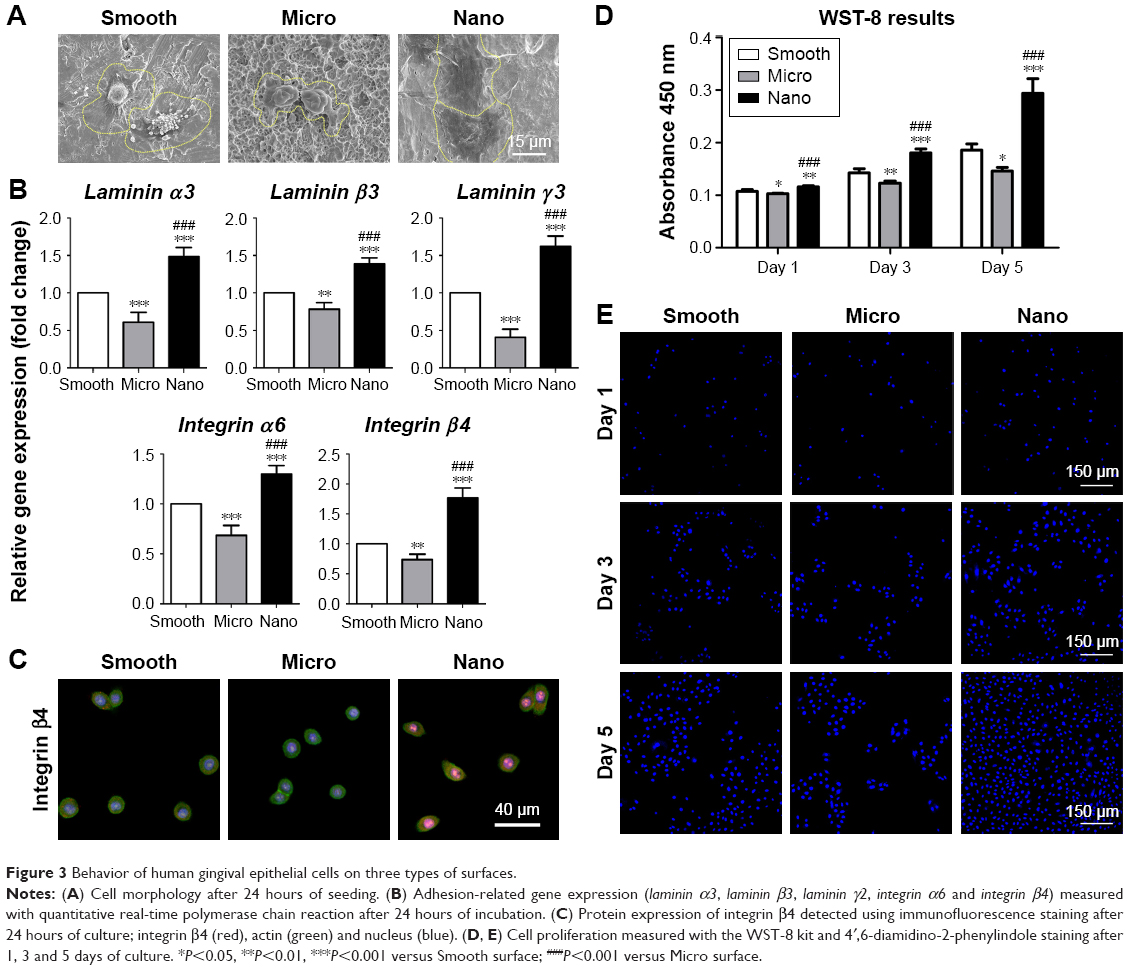 | Figure 3 Behavior of human gingival epithelial cells on three types of surfaces. |
Cell morphology
After culturing for 24 hours, HGECs on the Nano sample spread out evenly and showed a polygonal shape with abundant filopodia and lamellipodia, whereas cells on the Smooth and Micro samples exhibited a hemispherical shape with less filopodia and lamellipodia extension (Figure 3A).
Adhesion activity
The relative gene expression levels of adhesion molecules (laminin α3, laminin β3, laminin γ2, integrin α6 and integrin β4) in HGECs after 24 hours of incubation on different samples followed the ranking of Nano sample>Smooth sample>Micro sample (Figure 3B). Immunofluorescence staining of integrin β4 exhibited granular multiform patches throughout the cytoplasm of HGECs (Figures 3C and S3). Similar to its gene expression pattern, the protein expression level of integrin β4 was strongest on the Nano sample and weakest on the Micro sample.
Cell proliferation
The cell number after culturing on the different samples for 1, 3 and 5 days followed the ranking of Nano sample>Smooth sample>Micro sample (Figure 3D and E). In other words, HGECs on the Nano sample proliferated fastest with time, followed by the Smooth sample, whereas cells on the Micro sample showed the weakest proliferation activity.
Behavior of HGFs on different samples
Cell morphology, adhesion activity and proliferation ability were tested to investigate the effects of different surfaces on the behavior of HGFs (Figures 4 and S4).
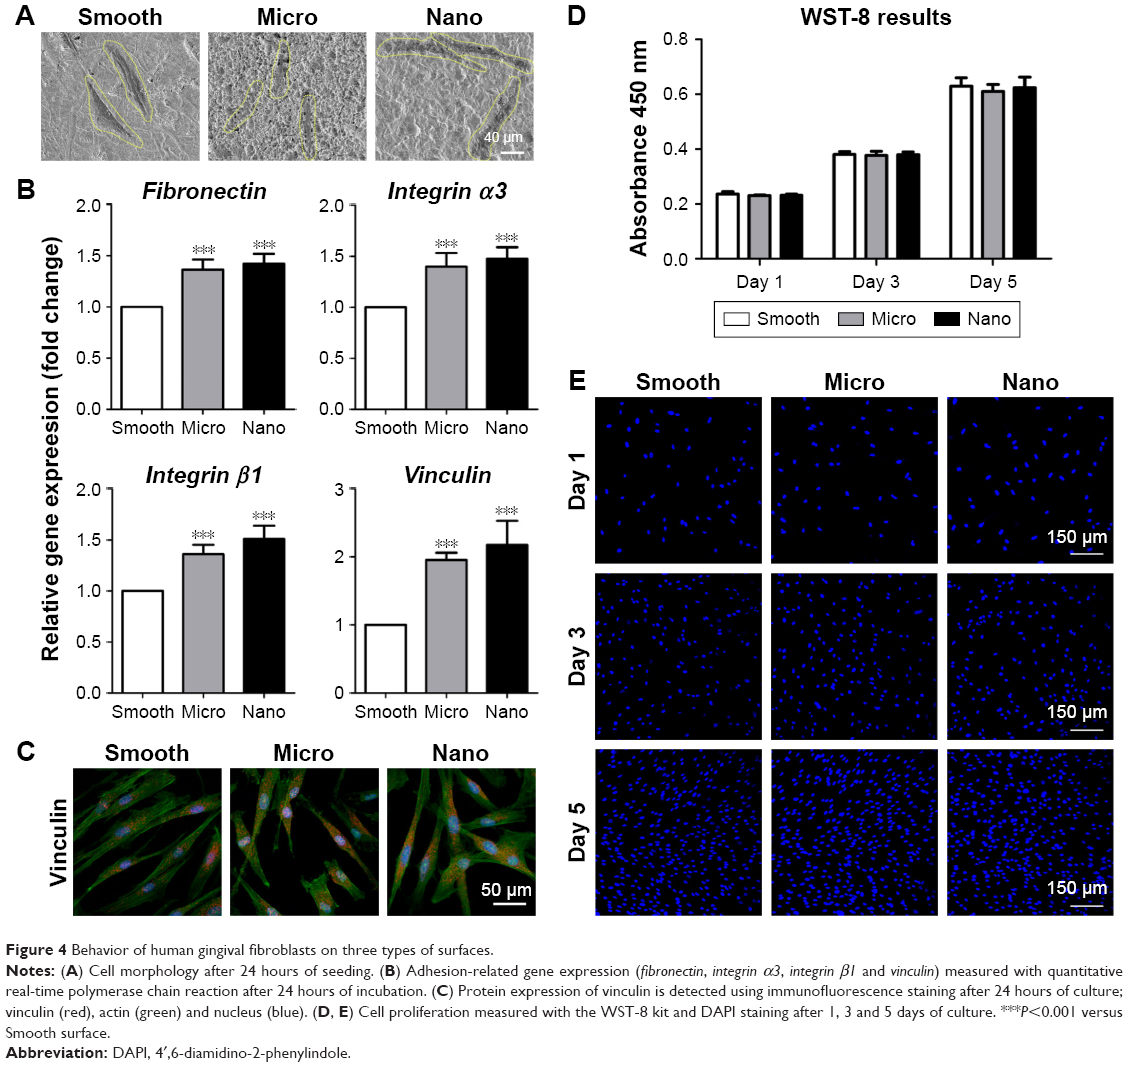 | Figure 4 Behavior of human gingival fibroblasts on three types of surfaces. |
Cell morphology
After 24 hours of incubation, the HGFs on the three samples were elongated in shape with long filamentous extensions (Figure 4A).
Adhesion activity
After culturing for 24 hours, the relative expression levels of adhesion-related genes (fibronectin, integrin α3, integrin β1 and vinculin) in HGFs on different samples followed the ranking of Nano sample=Micro sample>Smooth sample (Figure 4B). Immunofluorescence staining of vinculin showed elongated spots located diffusely in the cytoplasm of HGFs (Figures 4C and S4). Furthermore, cells on the Nano and Micro samples displayed stronger expression of vinculin than those on the Smooth sample, whereas no obvious differences were observed between the Nano and Micro samples.
Cell proliferation
HGFs proliferated rapidly with time on all samples and showed similar numbers of cells after culturing for 1, 3 and 5 days, without any significant differences (Figure 4D and E).
Behavior of human macrophage polarization on different samples
Cell morphology and macrophage phenotype were analyzed to assess the effects of surface morphologies on the behavior of human THP-1 macrophages in the presence or absence of biological agents (Figures 5 and S5).
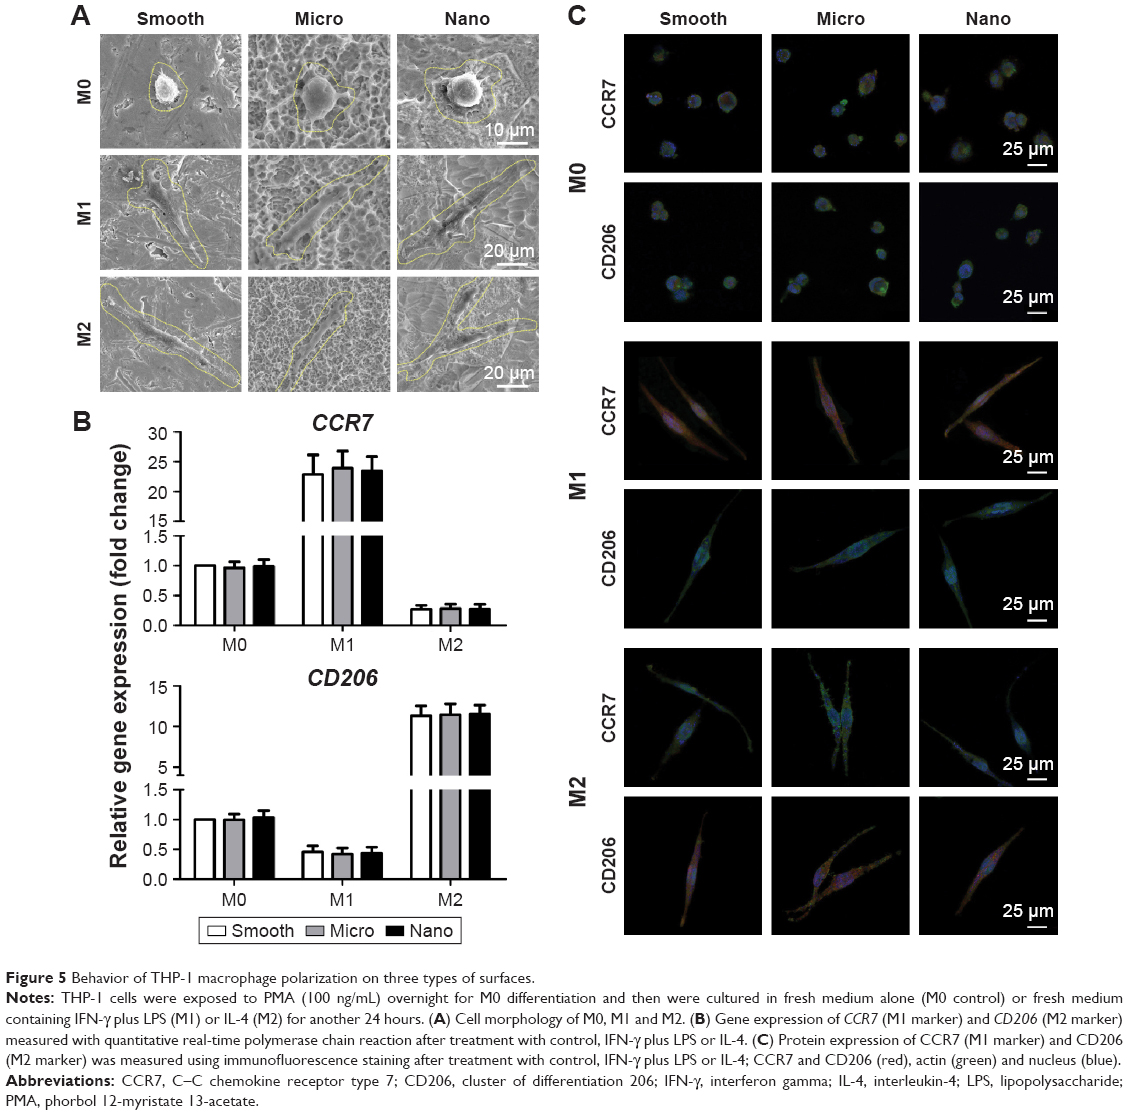 | Figure 5 Behavior of THP-1 macrophage polarization on three types of surfaces. |
Cell morphology
Cells with the same phenotype (M0, M1 or M2) appeared similar in shape on the different types of samples. In detail, M0 macrophages on all the samples showed a spherical shape, whereas M1 and M2 macrophages were elongated in shape (Figure 5A).
Macrophage polarization
To evaluate cell polarization, qRT-PCR of M1 phenotype markers (CCR7) and M2 phenotype markers (CD206) was performed, with the M0 macrophages on the Smooth sample as control (Figure 5B).33 For M0 macrophages, both the expression of CCR7 and CD206 could be detected, with no marked differences among samples. Compared to M0 macrophages, the M1 phenotype induced by IFN-γ plus LPS displayed prominent upregulation of CCR7 and reduction of CD206, with no differences across the groups. Conversely, M2 macrophages treated with IL-4 exhibited enhanced expression of CD206 and decreased CCR7 expression, with no differences among surfaces. Furthermore, immunofluorescence staining for CCR7 and CD206 was conducted for M0, M1 and M2 macrophages (Figures 5C and S5). Both the expression of CCR7 and CD206 in the M0 phenotype could be observed on all samples, with similar protein levels across the groups. For M1 macrophages, the cells showed strong expression of CCR7 and little CD206 expression, with no foundational differences among samples. For M2 macrophages, the cells showed abundant CD206 expression and low expression of CCR7, with similar protein expression among surfaces.
Behavior of S. mutans on different samples
Bacterial adhesion and biofilm formation were analyzed to test the effects of different surfaces on the behavior of S. mutans (Figure 6).
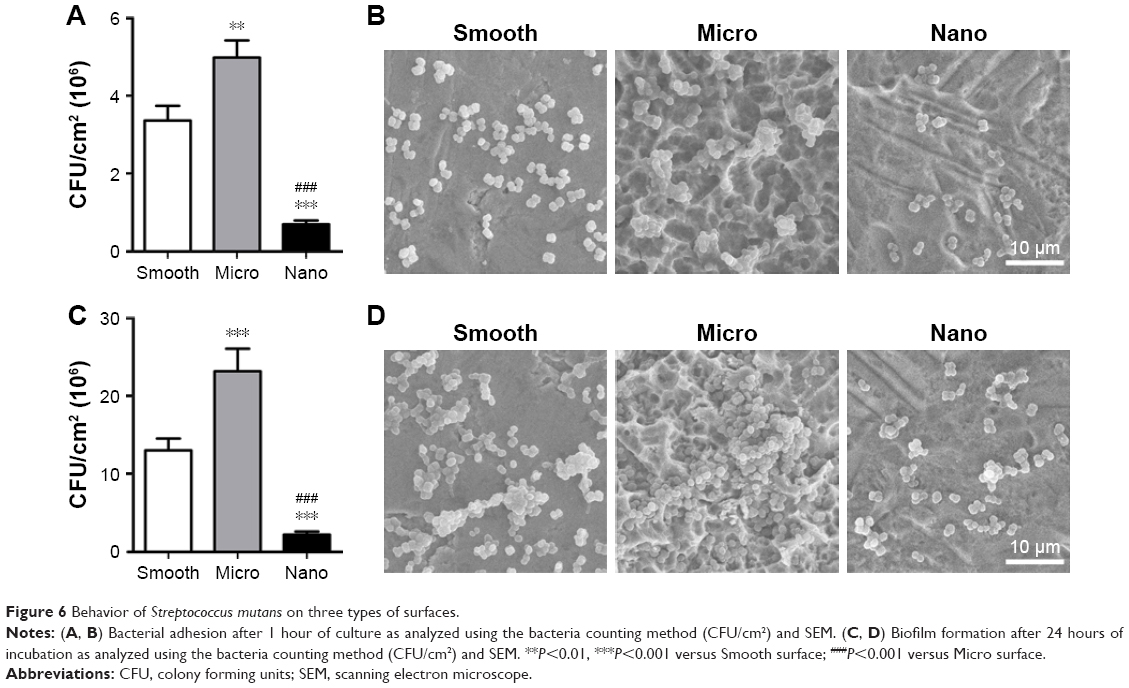 | Figure 6 Behavior of Streptococcus mutans on three types of surfaces. |
Bacterial adhesion
After seeding for 1 hour, the number of bacteria adhered to the samples was detected using the bacteria count method and SEM (Figure 6A and B). The attached bacteria number followed the ranking of Nano sample<Smooth sample<Micro sample.
Biofilm formation
After culturing for 24 hours, the biofilm formation on the samples followed the ranking of Nano sample<Smooth sample<Micro sample, as evaluated using the bacteria count method and SEM (Figure 6C and D).
Discussion
A main consideration in developing dental implant surfaces is to promote tissue integration around the peri-implant bone and soft tissue and at the same time diminishing bacterial adherence.5,34 Nanoscale topography is currently regarded as a promising approach to surface design; however, the effects of nanotopography have rarely been systematically evaluated. In this study, a Nano surface with homogeneous nanofiber texture was prepared by alkali-hydrothermal treatment, and its effects on tissue healing and antimicrobial property were evaluated in vitro and compared to Smooth surface by polishing and Micro surface by SLA. Our results showed that the Nano surface not only enhanced the osteogenic differentiation of human MG-63 osteoblasts (Nano=Micro>Smooth) but also promoted the early attachment of both HGECs (Nano>Smooth>Micro) and HGFs (Nano=Micro>Smooth). Moreover, the Nano surface did not alter macrophage polarization (Nano=Micro=Smooth), but decreased initial biofilm formation of S. mutans (Nano<Smooth<Micro). These findings suggest that implant surfaces with nanotopography may enhance early tissue integration and increase implant survival.
The establishment of osseointegration is the undisputed pre-condition for clinical success of an implant, and enhanced osteogenic activity of osteoblasts by surface modification could result in an increased osseointegration.35,36 In this study, MG-63 cells, obtained from a human osteosarcoma, were used to model the response of human osteoblasts on the three different titanium surfaces. Despite being a tumor cell line, MG-63 cells exhibit numerous osteoblastic traits that are typical of a relatively immature osteoblast, including the stimulation of ALP activity and OCN synthesis.37 As a result, they are a good model for the examination of the early stages of osteogenic differentiation on biomaterial surfaces.38,39 Our results revealed that MG-63 osteoblasts grew well on all surfaces. However, MG-63 cells on the Nano surface exhibited increased osteogenic differentiation, shown as enhanced ALP activity and upregulated expression of OCN when compared with the Smooth surface.38 More importantly, the osteogenic activity on the Nano surface was similar to that on the Micro surface prepared by SLA. As the microrough surface by SLA is generally known to enhance osteogenic differentiation of osteoblasts and is commonly used in practice to improve osseointegration,26,40 the similar osteogenic activity between the Nano surface and the Micro surface may indicate that implants with a Nano surface could achieve favorable osseointegration comparable with SLA surfaces.
In addition to bone-implant integration, early attachment and accelerated proliferation of epithelial cells and fibroblasts surrounding the implant neck to form a biological seal are of critical importance for the success and survival of implants.41 In this study, to figure out the roles of surface morphology during the soft tissue integration, both HGECs and HGFs from human gingival tissue were cultured on different titanium surfaces for systemic analysis. The data showed that after 24 hours of incubation, HGECs on the Nano surface spread readily and exhibited upregulated gene expression of integrin α6β4, the major component of the hemidesmosome, and laminin α3β3γ2 (laminin-5), the major component of the basement membrane, compared to the Smooth and Micro surfaces.42 Immunofluorescence staining of integrin β4 also revealed stronger expression of the hemidesmosome on the Nano surface compared with the others. Because hemidesmosomes and basement membrane ensure efficient attachment of epithelial cells to the implant surface, these results predict that HGECs on Nano surfaces could achieve better attachment to the implant than the others.42,43 In addition, the Nano surface also markedly promoted the proliferation activity of HGECs compared to Smooth and Micro surfaces. Thus, implants with Nano surfaces may achieve earlier epithelial sealing around the transmucosal component than that with a Smooth surface or Micro surface. Unlike the response of HGECs, HGFs spread well and grew rapidly on all surfaces; however, on the Nano and Micro surfaces, these cells expressed higher amounts of vinculin than on the Smooth surface. It is known that fibroblasts adhere to implant surfaces by focal adhesion.44 Vinculin is a focal adhesion linker protein, and increased vinculin expression is associated with enhanced adhesion strength.45 Therefore, both the Nano and Micro surfaces could result in a stronger adhesion of HGFs to the implant than Smooth surface, which is beneficial for the stability of connective tissue integration. Taken together, the Nano surface promoted the attachment of both HGECs and HGFs when compared with other surfaces. Thus, implants with Nano surfaces may result in an early and effective formation of soft tissue barrier, which would be beneficial for the long-term maintenance of osseointegration.
Moreover, the tissue healing around peri-implant bone and soft tissue was affected by the host inflammatory response, in which macrophages play a major regulatory role due to different polarization conditions (ie, pro-inflammatory M1 and anti-inflammatory pro-healing M2). After installation of dental implants, an acute inflammatory response (M1) is initiated by tissue injury, followed by the resolution of inflammation and tissue repair (M2).9,33 In this study, THP-1 macrophages treated with PMA (M0) were used to act as a model of human peripheral blood monocyte-derived macrophages and were further polarized into M1 by IFN-γ plus LPS or M2 by IL-4 for evaluating the effects of different surface morphologies on macrophage polarization.46 As indicated by the similar expression of CCR7 (M1 marker) and CD206 (M2 marker), our data suggested that macrophages exhibited similar phenotypes among these three types of surfaces in M0, M1 or M2. These results may indicate that surface morphologies have little influence on the activity of macrophage polarization under the same stimulus. In other words, with equal degrees of tissue injury, the three different types of surfaces may undergo the same progress of inflammation and have similar microenvironments for the beginning of bone and soft tissue healing. Because tissues are injured after surgical trauma or during infection, it would be beneficial for the resolution of inflammation and early tissue repair to lessen surgical trauma and prevent infection. As surgical traumas were mainly associated with the surgical procedures, for morphology modification of implant surface to reduce tissue damage, one feasible approach is to prevent infection caused by bacteria.
To be fully functional, the dental implants protrude through the soft tissue and are exposed to a bacteria-rich environment at all times. The colonization of bacteria (dental plaque formation) on implant surfaces may trigger the inflammatory process, contributing to the early and late stages of implant failure.7 Among oral microbial flora, S. mutans is one of the best-known early colonizers and biofilm-forming organisms during dental plaque formation, and this biofilm provides a suitable environment for the late colonizers to form mature plaque.7,47 We found that Nano surfaces inhibited the initial attachment and biofilm formation of S. mutans compared to Smooth surfaces, whereas Micro surfaces exhibited contrary behavior. The antimicrobial outcome, together with early and favorable attachment of HGEC and HGF on the Nano surface, may lead to less bacterial infection caused by plaque accumulation compared to Smooth and Micro surfaces and thus facilitate the early tissue healing and long-term success and survival of implants.
Overall, the Nano surfaces interfaced well simultaneously with MG-63 cells, HGECs and HGFs, along with reduced bacterial accumulation. In detail, the attachment activity of HGECs and antibacterial efficacy on the Nano surface were better than that on the Smooth and Micro surfaces. In addition, when considering the osteogenic activity of MG-63 cells and adhesion activity of HGFs, the Nano surface exhibited beneficial effects that were similar to those of the Micro surface but better than those of the Smooth surface. There were few differences among these three types of surface morphologies in regulating the activity of macrophage polarization. On the basis of these results, the Nano surface may be a better option for designing transmucosal components or abutment of an implant and an alternative to the SLA surface for designing bone-contacting regions of the implant. Because the nanotopography used in this study could also act as a delivery platform for the sustained and controlled release of bioactive ions that further improves the biological activity, it is first necessary to improve the biocompatibility of the nanostructured surface with the osteoblasts, fibroblasts and macrophages (ie, M2 polarization). Thus, further studies will be conducted to perform chemical modification on the present nanostructured surfaces for better tissue healing, especially for osseointegration and connective tissue barrier formation.
Conclusion
Titanium surfaces with homogeneous nanofiber textures prepared with alkali-hydrothermal treatment enhanced the osteogenic activity of MG-63 osteoblasts at the same time that they promoted the adhesion activity of HGECs and HGFs when compared with smooth surfaces by polishing and micro-rough surfaces by SLA. Moreover, the nanostructured surfaces did not alter macrophage polarization, but reduced initial bacterial adhesion. From a clinical perspective, the nanostructured titanium surface may promote the healing of both peri-implant bone and soft tissue as well as reduce bacterial infection, which would be beneficial for early loading and the long-term success and survival of dental implants. More research is needed to further improve the biocompatibility of the nanostructured surfaces with the osteoblasts, fibroblasts and macrophages (ie, M2) through modification of the surface chemistry.
Acknowledgments
This work was jointly supported by the National Key Research and Development Program of China (2016YFC1102900), the National Natural Science Foundation of China (81620108006), the National Natural Science Foundation of China (81430012), the Science and Technology Commission of Shanghai Municipality (15XD1502500, 15410722700) and the Medicine and Engineering Cross Research Foundation of Shanghai Jiao Tong University (YG2015ZD06).
Disclosure
The authors report no conflicts of interest in this work.
References
Gaviria L, Salcido JP, Guda T, Ong JL. Current trends in dental implants. J Korean Assoc Oral Maxillofac Surg. 2014;40(2):50–60. | ||
Werner S, Huck O, Frisch B, et al. The effect of microstructured surfaces and laminin-derived peptide coatings on soft tissue interactions with titanium dental implants. Biomaterials. 2009;30(12):2291–2301. | ||
Hamilton DW, Chehroudi B, Brunette DM. Comparative response of epithelial cells and osteoblasts to microfabricated tapered pit topographies in vitro and in vivo. Biomaterials. 2007;28(14):2281–2293. | ||
Kunzler TP, Drobek T, Schuler M, Spencer ND. Systematic study of osteoblast and fibroblast response to roughness by means of surface-morphology gradients. Biomaterials. 2007;28(13):2175–2182. | ||
Dorkhan M, Yucel-Lindberg T, Hall J, Svensater G, Davies JR. Adherence of human oral keratinocytes and gingival fibroblasts to nano-structured titanium surfaces. BMC Oral Health. 2014;14:75. | ||
Liao J, Anchun M, Zhu Z, Quan Y. Antibacterial titanium plate deposited by silver nanoparticles exhibits cell compatibility. Int J Nanomedicine. 2010;5:337–342. | ||
Sridhar S, Wilson TG Jr, Palmer KL, et al. In vitro investigation of the effect of oral bacteria in the surface oxidation of dental implants. Clin Implant Dent Relat Res. 2015;17(Suppl 2):e562–e575. | ||
Klinge B, Meyle J, Working Group 2. Soft-tissue integration of implants. Clin Oral Implants Res. 2006;17(Suppl 2):93–96. | ||
Kzhyshkowska J, Gudima A, Riabov V, Dollinger C, Lavalle P, Vrana NE. Macrophage responses to implants: prospects for personalized medicine. J Leukoc Biol. 2015;98(6):953–962. | ||
Lee CH, Kim YJ, Jang JH, Park JW. Modulating macrophage polarization with divalent cations in nanostructured titanium implant surfaces. Nanotechnology. 2016;27(8):085101. | ||
Biswas SK, Mantovani A. Macrophage plasticity and interaction with lymphocyte subsets: cancer as a paradigm. Nat Immunol. 2010;11(10):889–896. | ||
Hotchkiss KM, Reddy GB, Hyzy SL, Schwartz Z, Boyan BD, Olivares-Navarrete R. Titanium surface characteristics, including topography and wettability, alter macrophage activation. Acta Biomater. 2016;31:425–434. | ||
Wynn TA, Vannella KM. Macrophages in tissue repair, regeneration, and fibrosis. Immunity. 2016;44(3):450–462. | ||
Ma QL, Zhao LZ, Liu RR, et al. Improved implant osseointegration of a nanostructured titanium surface via mediation of macrophage polarization. Biomaterials. 2014;35(37):9853–9867. | ||
Brunette DM, Chehroudi B. The effects of the surface topography of micromachined titanium substrata on cell behavior in vitro and in vivo. J Biomech Eng. 1999;121(1):49–57. | ||
Dohan Ehrenfest DM, Coelho PG, Kang BS, Sul YT, Albrektsson T. Classification of osseointegrated implant surfaces: materials, chemistry and topography. Trends Biotechnol. 2010;28(4):198–206. | ||
Baharloo B, Textor M, Brunette DM. Substratum roughness alters the growth, area, and focal adhesions of epithelial cells, and their proximity to titanium surfaces. J Biomed Mater Res A. 2005;74(1):12–22. | ||
Hormia M, Kononen M, Kivilahti J, Virtanen I. Immunolocalization of proteins specific for adhaerens junctions in human gingival epithelial cells grown on differently processed titanium surfaces. J Periodontal Res. 1991;26(6):491–497. | ||
Burgers R, Gerlach T, Hahnel S, Schwarz F, Handel G, Gosau M. In vivo and in vitro biofilm formation on two different titanium implant surfaces. Clin Oral Implants Res. 2010;21(2):156–164. | ||
Elter C, Heuer W, Demling A, et al. Supra- and subgingival biofilm formation on implant abutments with different surface characteristics. Int J Oral Maxillofac Implants. 2008;23(2):327–334. | ||
Tomisa AP, Launey ME, Lee JS, Mankani MH, Wegst UGK, Saiz E. Nanotechnology approaches to improve dental implants. Int J Oral Maxillofac Implants. 2011;26(Suppl):25–44; discussion 45–29. | ||
Tomsia AP, Lee JS, Wegst UG, Saiz E. Nanotechnology for dental implants. Int J Oral Maxillofac Implants. 2013;28(6):e535–e546. | ||
Divya Rani VV, Manzoor K, Menon D, Selvamurugan N, Nair SV. The design of novel nanostructures on titanium by solution chemistry for an improved osteoblast response. Nanotechnology. 2009;20(19):195101. | ||
Mendonca G, Mendonca DB, Aragao FJ, Cooper LF. Advancing dental implant surface technology – from micron-to nanotopography. Biomaterials. 2008;29(28):3822–3835. | ||
Li J, Zhang W, Qiao Y, et al. Chemically regulated bioactive ion delivery platform on a titanium surface for sustained controlled release. J Mater Chem B. 2014;2(3):283–294. | ||
Jemat A, Ghazali MJ, Razali M, Otsuka Y. Surface modifications and their effects on titanium dental implants. BioMed Res Int. 2015;2015:791725. | ||
Li JH, Zhang WJ, Qiao YQ, et al. Chemically regulated bioactive ion delivery platform on a titanium surface for sustained controlled release. J Mater Chem B. 2014;2(3):283–294. | ||
Wang G, Li J, Lv K, et al. Surface thermal oxidation on titanium implants to enhance osteogenic activity and in vivo osseointegration. Sci Rep. 2016;6:31769. | ||
Oda D, Watson E. Human oral epithelial cell culture I. Improved conditions for reproducible culture in serum-free medium. In Vitro Cell Dev Biol. 1990;26(6):589–595. | ||
Abiko Y, Hiratsuka K, Kiyama-Kishikawa M, Tsushima K, Ohta M, Sasahara H. Profiling of differentially expressed genes in human gingival epithelial cells and fibroblasts by DNA microarray. J Oral Sci. 2004;46(1):19–24. | ||
Wang X, Lu T, Wen J, et al. Selective responses of human gingival fibroblasts and bacteria on carbon fiber reinforced polyetheretherketone with multilevel nanostructured TiO2. Biomaterials. 2016;83:207–218. | ||
Livak KJ, Schmittgen TD. Analysis of relative gene expression data using real-time quantitative PCR and the 2(-Delta Delta C(T)) method. Methods (San Diego, Calif). 2001;25(4):402–408. | ||
Reeves AR, Spiller KL, Freytes DO, Vunjak-Novakovic G, Kaplan DL. Controlled release of cytokines using silk-biomaterials for macrophage polarization. Biomaterials. 2015;73:272–283. | ||
Gomez-Florit M, Pacha-Olivenza MA, Fernandez-Calderon MC, et al. Quercitrin-nanocoated titanium surfaces favour gingival cells against oral bacteria. Sci Rep. 2016;6:22444. | ||
Jeong SJ, Jeong MJ. Effect of Thymosin beta4 on the differentiation and mineralization of MC3T3-E1 cell on a titanium surface. J Nanosci Nanotechnol. 2016;16(2):1979–1983. | ||
Stadlinger B, Pourmand P, Locher MC, Schulz MC. Systematic review of animal models for the study of implant integration, assessing the influence of material, surface and design. J Clin Periodontol. 2012;39(Suppl 12):28–36. | ||
Lincks J, Boyan BD, Blanchard CR, et al. Response of MG63 osteoblast-like cells to titanium and titanium alloy is dependent on surface roughness and composition. Biomaterials. 1998;19(23):2219–2232. | ||
Schwartz Z, Lohmann CH, Oefinger J, Bonewald LF, Dean DD, Boyan BD. Implant surface characteristics modulate differentiation behavior of cells in the osteoblastic lineage. Adv Dent Res. 1999;13:38–48. | ||
Liu X, Tian A, You J, et al. Antibacterial abilities and biocompatibilities of Ti-Ag alloys with nanotubular coatings. Int J Nanomedicine. 2016;11:5743–5755. | ||
Zinger O, Zhao G, Schwartz Z, et al. Differential regulation of osteoblasts by substrate microstructural features. Biomaterials. 2005;26(14):1837–1847. | ||
Sculean A, Gruber R, Bosshardt DD. Soft tissue wound healing around teeth and dental implants. J Clin Periodontol. 2014;41(Suppl 15):S6–S22. | ||
Pendegrass CJ, Lancashire HT, Fontaine C, Chan G, Hosseini P, Blunn GW. Intraosseous transcutaneous amputation prostheses versus dental implants: a comparison between keratinocyte and gingival epithelial cell adhesion in vitro. European cell Mater. 2015;29:237–249. | ||
El-Ghannam A, Starr L, Jones J. Laminin-5 coating enhances epithelial cell attachment, spreading, and hemidesmosome assembly on Ti-6A1-4V implant material in vitro. J Biomed Mater Res. 1998;41(1):30–40. | ||
Pendegrass CJ, Middleton CA, Gordon D, Jacob J, Blunn GW. Measuring the strength of dermal fibroblast attachment to functionalized titanium alloys in vitro. J Biomed Mater Res A. 2010;92(3):1028–1037. | ||
Moon YH, Yoon MK, Moon JS, et al. Focal adhesion linker proteins expression of fibroblast related to adhesion in response to different transmucosal abutment surfaces. J Adv Prosthodont. 2013;5(3):341–350. | ||
Chanput W, Mes JJ, Wichers HJ. THP-1 cell line: an in vitro cell model for immune modulation approach. Int Immunopharmacol. 2014;23(1):37–45. | ||
Levesque CM, Voronejskaia E, Huang YC, Mair RW, Ellen RP, Cvitkovitch DG. Involvement of sortase anchoring of cell wall proteins in biofilm formation by Streptococcus mutans. Infect Immun. 2005;73(6):3773–3777. |
Supplementary materials
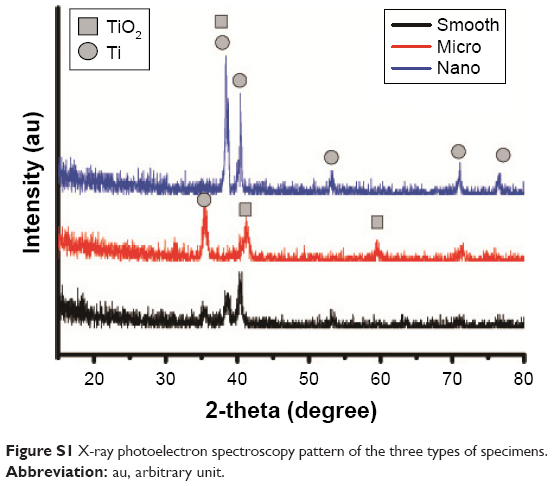 | Figure S1 X-ray photoelectron spectroscopy pattern of the three types of specimens. |
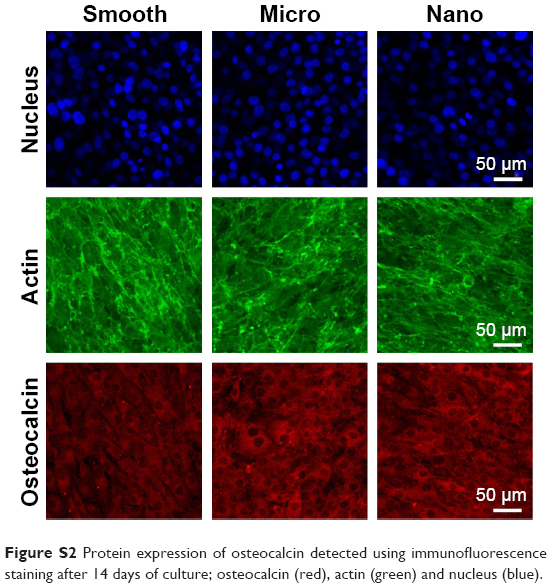 | Figure S2 Protein expression of osteocalcin detected using immunofluorescence staining after 14 days of culture; osteocalcin (red), actin (green) and nucleus (blue). |
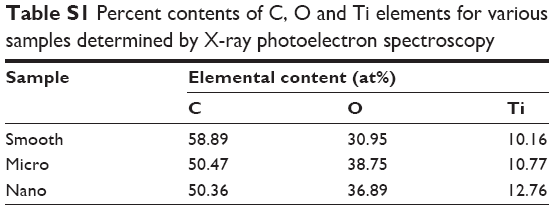 | Table S1 Percent contents of C, O and Ti elements for various samples determined by X-ray photoelectron spectroscopy |
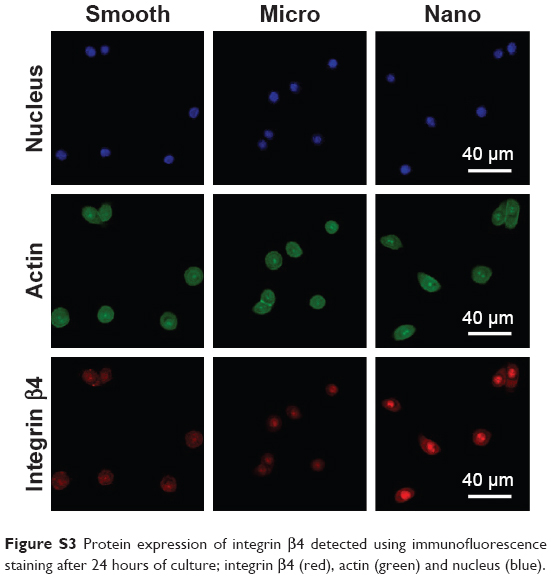 | Figure S3 Protein expression of integrin β4 detected using immunofluorescence staining after 24 hours of culture; integrin β4 (red), actin (green) and nucleus (blue). |
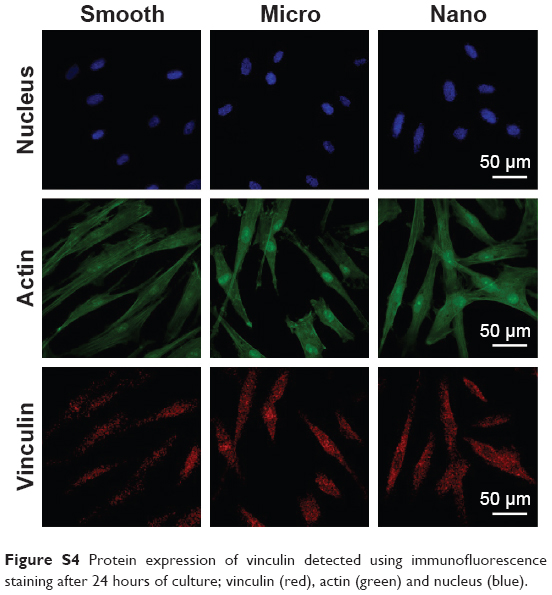 | Figure S4 Protein expression of vinculin detected using immunofluorescence staining after 24 hours of culture; vinculin (red), actin (green) and nucleus (blue). |
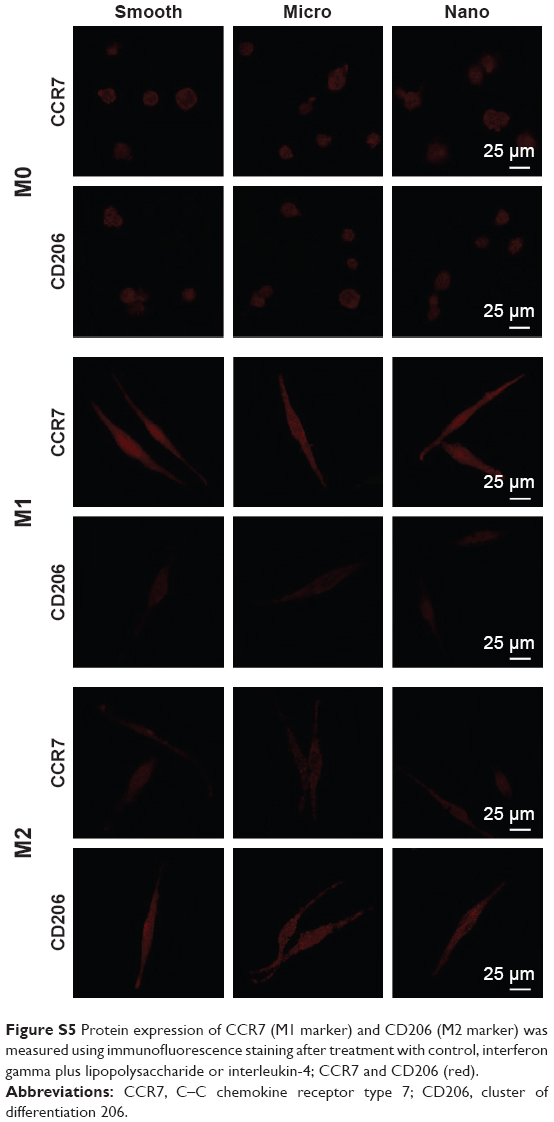 | Figure S5 Protein expression of CCR7 (M1 marker) and CD206 (M2 marker) was measured using immunofluorescence staining after treatment with control, interferon gamma plus lipopolysaccharide or interleukin-4; CCR7 and CD206 (red). |
 © 2017 The Author(s). This work is published and licensed by Dove Medical Press Limited. The
full terms of this license are available at https://www.dovepress.com/terms
and incorporate the Creative Commons Attribution
- Non Commercial (unported, 3.0) License.
By accessing the work you hereby accept the Terms. Non-commercial uses of the work are permitted
without any further permission from Dove Medical Press Limited, provided the work is properly
attributed. For permission for commercial use of this work, please see paragraphs 4.2 and 5 of our Terms.
© 2017 The Author(s). This work is published and licensed by Dove Medical Press Limited. The
full terms of this license are available at https://www.dovepress.com/terms
and incorporate the Creative Commons Attribution
- Non Commercial (unported, 3.0) License.
By accessing the work you hereby accept the Terms. Non-commercial uses of the work are permitted
without any further permission from Dove Medical Press Limited, provided the work is properly
attributed. For permission for commercial use of this work, please see paragraphs 4.2 and 5 of our Terms.