Back to Journals » Journal of Blood Medicine » Volume 5
The relationship between red blood cell distribution width and blood pressure in patients with type 2 diabetes mellitus in Lagos, Nigeria
Authors Dada OA, Uche E ![]() , Akinbami A, Odesanya M, John-Olabode S
, Akinbami A, Odesanya M, John-Olabode S ![]() , Adediran A, Oshinaike O, Ogbera A, Okunoye O, Arogundade O, Aile K
, Adediran A, Oshinaike O, Ogbera A, Okunoye O, Arogundade O, Aile K ![]() , Ekwere T
, Ekwere T
Received 20 May 2014
Accepted for publication 8 July 2014
Published 19 September 2014 Volume 2014:5 Pages 185—189
DOI https://doi.org/10.2147/JBM.S67989
Checked for plagiarism Yes
Review by Single anonymous peer review
Peer reviewer comments 2
Olusola Akinola Dada,1 Ebele Uche,2 Akinsegun Akinbami,2 Majeed Odesanya,3 Sarah John-Olabode,4 Adewumi Adediran,5 Olajumoke Oshinaike,1 Anthonia Okeoghene Ogbera,1 Olaitan Okunoye,6 Olanrewaju Arogundade,2 Kingsley Aile,7 Timothy Ekwere8
1Department of Medicine, Lagos State University, 2Department of Haematology and Blood Transfusion, Lagos State University, College of Medicine, Ikeja, Nigeria; 3Oak Hospitals, Ikorodu, Lagos, Nigeria; 4Department of Haematology, Ben Carson School of Medicine, Babcock University, Ilisan-Remo, Ogun State, 5Department of Haematology, Faculty of Clinical Sciences, College of Medicine, University of Lagos, Idiaraba, 6Department of Medicine, University of Port Harcourt, River State, 7Department of Haematology and Blood Transfusion, Lagos State University Teaching Hospital, Ikeja, Nigeria; 8Department of Haematology and Blood Transfusion, University of Uyo, Akwa Ibom, Nigeria
Background: High red blood cell distribution width (RDW) is related to impairment of erythropoiesis, reflecting chronic inflammation and increased levels of oxidative stress, both of which are telltale signs of type 2 diabetics. The aim of this study was to evaluate the relationship between the RDW and fasting blood sugar/blood pressure, and compare the results from diabetics with nondiabetic controls.
Methods: This was an unmatched case-control study involving 200 participants consisting of 100 diabetics and 100 nondiabetic controls. Blood (4.5 mL) was collected from all of the diabetics and nondiabetic controls, and placed into EDTA anticoagulant tubes. A full blood count was performed using the Sysmex KX-21N, a three-part auto analyzer able to run 19 parameters per sample, including RDW. Blood pressure was measured during sample collection and in a sitting position.
Results: The mean fasting blood sugar level was 95.20±30.10 mg/dL in the controls, and 147.85±72.54 mg/dL in the diabetics. The mean blood pressures for diabetics was 138/90 mmHg and for non-diabetics 120/80 mmHg. The mean RDW-SD (RDW standard deviation) was 46.44±4.64 fl in the controls, and 46.84±3.18 in the diabetics. The mean RDW-CV (RDW coefficient of variation) was 14.74%±1.94% in controls, and 14.80±0.71 for diabetics. No statistically significant correlation was found between the RDW-SD and fasting blood sugar/blood pressure in the diabetics. A statistically significant positive correlation was found between the RDW-CV and blood pressure in the diabetics.
Conclusion: A positive correlation between the RDW-CV and blood pressure was established in the diabetics in this study.
Keywords: RDW, fasting blood sugar, type 2 DM
Background
Diabetes mellitus (DM) is a chronic metabolic disorder characterized by hyperglycemia, and resulting from defects in insulin secretion, insulin action, or both.1 The chronic hyperglycemia occurring in DM is associated with long-term damage, as well as dysfunction and failure of different organs, especially in the eyes, kidneys, nerves, heart and blood vessels.1 The World Health Organization (WHO) estimates that about 347 million people worldwide are presently living with DM.2 Of this figure, approximately 80% are from low and medium income countries.3 WHO also projects that by 2030, DM will be the seventh leading cause of death worldwide.4 There are two main types of DM: type 1 which usually develops in childhood and adolescence, and is insulin dependent; and type 2 which develops in adulthood and represents more than 90% of cases worldwide. Risk factors for type 2 DM include sedentary lifestyle, obesity, and old age.
Diagnosis of DM can be made with a simple fasting plasma glucose test with values ≥126 mg/dL (7.0 mmol/L) being diagnostic of DM (fasting is defined as no caloric intake for at least 8 hours).5 In the presence of symptoms of hyperglycemia (polyuria, polydipsia, polyphagia, weight loss), a casual plasma glucose level of >200 mg/dL (11.1 mmol/L) is diagnostic.5
Recently, various researchers have proposed that type 2 DM is connected to a state of subclinical chronic inflammation.6,7 It may be that abnormal levels of chemokines released by the expanded adipose tissue in obesity activates monocytes, and increases the secretion of proinflammatory adipokines. Such cytokines in turn enhance insulin resistance in adipose and other tissues, thereby increasing the risk of type 2 DM.8,9
The red blood cell distribution width (RDW) is a measure of variation in size of the circulating erythrocytes (anisocytosis)10 which is routinely obtained from a standard automated complete blood count. High RDW indicates the presence of anisocytosis which is related to impairment of erythropoiesis and degradation of erythrocytes,10 reflecting chronic inflammation and increased levels of oxidative stress, both of which are telltale signs in type 2 diabetics, and this may significantly contribute to development of atherosclerotic diseases.11,12
Many recent studies have investigated changes in RDW in association with cardiac and noncardiac related deaths.13–19 Most of these studies report a positive correlation of RDW with the erythrocyte sedimentation rate (ESR) and C-reactive protein (CRP) levels – an increase in the RDW during inflammation, similar to that seen in other inflammatory parameters. Malandrino et al20 recently reported a positive correlation between a high RDW and increased incidence of both macro- and microvascular complications in DM patients without marked vascular complications.
The aim of this study was to evaluate the relationship between the RDW and fasting blood sugar/blood pressure, and compare with nondiabetic controls.
Methods
Study population
The research was approved by the Ethics Review Committee of Lagos State University Teaching Hospital (LASUTH). This was a case-control study consisting of 100 type 2 DM patients receiving treatment, attending the diabetic clinic of the LASUTH, and 100 nondiabetic controls consisting of medical students, nurses and doctors in the same institution. During the study period between June to September 2013, all patients who gave informed consent and satisfied the study inclusion criteria were recruited into the study. They were asked to fill structured questionnaires including demographic information, height, weight, last fasting blood sugar, blood pressure, drug history, and family history of diabetes. All the diabetics were on oral hypoglycemic and antiplatelet drugs, like clopidogrel and vasoprin tablets, and some were on antihypertensive and lipid lowering drugs. Information on family history of diabetes was also obtained from the controls and they were subjected to fasting blood sugar testing before enlistment.
Sample collection
Blood was withdrawn with minimal stasis from the antecubital vein using a dry sterile disposable syringe and needle. Blood (4.5 mL) was dispensed into EDTA anticoagulant tubes. The specimens were labeled with subject’s age, sex, and identification number. The EDTA samples were kept at room temperature until processed within 4 hours of collection.
Laboratory analysis
A full blood count was performed using the SysmexKX-21N (Sysmex Corporation, Kobe, Japan), a three-part auto analyzer able to run 19 parameters per sample, including hemoglobin concentration, packed cell volume, red blood cell concentration, mean corpuscular hemoglobin, mean cell volume, mean corpuscular hemoglobin concentration, white blood cell and platelet count, and mean platelet volume. Standardization, calibration of the instrument, and processing of the samples were carried out according to the manufacturer’s instructions.
Well-mixed blood samples were aspirated, by leaving the equipment sampling probe in the blood sample and then pressing the start button. Approximately 20 μL of blood was aspirated by the auto analyzer. The results of the analysis were displayed after about 30 seconds.
Statistical analysis
Data were analyzed using SPSS version 16.0 (SPSS Inc., Chicago, IL, USA). The continuous variables were given as means ± standard deviation (SD). The Pearson chi- squared test was used to test for association between discrete variables. The P-value was considered to be statistically significant when less than 0.05.
Results
A total of 200 participants were enrolled into the study – consisting of 100 diabetics and 100 nondiabetic controls. The mean age of the control group was 32.38±6.44 years, with a minimum age of 17 years, and a maximum age of 70 years. The mean age of the type 2 DM group was 62.35±9.84 years, the minimum was 34 years old, and the maximum 90 years old. The overall female:male ratio was 68% to 32%. In the type 2 DM participants, 73% were female, and 27% were male. In the nondiabetic participants, 63% were female, and 37% were male (Table 1).
 | Table 1 Sociodemographic data of participants |
In the diabetic group, the mean body mass index was 32.10±4.85 kg/m2, and the mean fasting blood sugar level was 147.85±72.54 mg/dL. In the nondiabetic group, the mean body mass index was 25±5.23 kg/m2, and the mean fasting blood sugar was 95.20±30.10 mg/dL. The minimum blood pressure of the diabetics was 100/90 mmHg, maximum was 200/90 mmHg, and the mean was 138/90 mmHg. Amongst the diabetics, a total of 45 out of 100 (45%) gave a positive family history of type 2 diabetes, while 55% had no family history of diabetes. Only 5% of the controls gave a positive family history of diabetes. The mean duration of diabetes in the type 2 DM group was 8.81±7.06 years. The RDW-CV (RDW coefficient of variation) in the control group was 14.74±1.94, and 14.80±0.71 in the type 2 DM group. The RDW-SD (RDW standard deviation) was 46.44±4.64 in the control group, and 46.84±3.18 in the type 2 DM group (Table 2).
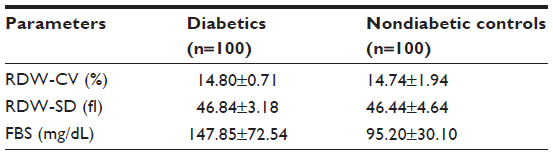 | Table 2 Mean red blood cell distribution width and fasting blood sugar |
Both the RDW-SD and the RDW-CV were not statistically significantly correlated with the fasting blood sugar level in the type 2 DM group; P-values were 0.10 and 0.55 respectively; Spearman’s rho values were −0.61 and −0.12 respectively. The RDW-SD was not statistically significantly correlated with blood pressure; P=0.99; Spearman’s rho of 0.11. A statistically significant correlation was achieved between the RDW-CV and the blood pressure of type 2 DM patients; P=0.02, Spearman’s rho of 0.02. RDW-SD and the RDW-CV values were not statistically significantly correlated with the duration of diagnosis of diabetes in the patients; P-values were 0.8 and 0.38 respectively; and Spearman’s rho of 0.096 and −0.035 respectively.
Tukey’s post hoc analysis could not be performed between the RDW-CV and blood pressure because at least one group had fewer than two cases, the significant level of 0.29 was obtained with test of homogeneity of variance.
Discussion
DM affects a sizeable proportion of the working population, and has economic consequences for both the individual and the society as a whole. Thus, the monitoring of DM in order to prevent complications is urgently needed. The RDW, a widely available and inexpensive test conducted as part of the complete blood cell count, measures the degree of anisocytosis. It is calculated as follows:
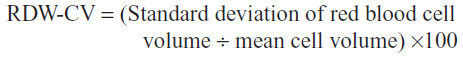
The normal range for the RDW-CV is 11.5%–14.5%, and higher values indicate greater variations in cell sizes.21 High RDW indicates a high degree of anisocytosis which is associated with distortion and degradation of erythropoiesis,21 reflecting chronic inflammation and an increased level of oxidative stress.22
DM increases vascular inflammation and oxidative stress while vascular inflammation affects erythropoiesis and deformability of red blood cells thus elevating RDW levels.23 RDW is strongly associated with chronic inflammation and is a strong indicator of risk of cardiovascular mortality in people with cardiovascular diseases, DM, as well as in the general population.13,14,18,24
Increased RDW may also arise as a result of anemia. Thus, causes like iron deficiency, and megaloblastic anemia with associated micro- or macrocytosis are potential confounders because our participants were not screened for iron, vitamin 12, nor folic acid. However, the effect of such confounders is negligible as all the participants selected for the study were healthy individuals (control group) and diabetics without complications or obvious comorbidities as at the time of the study. The effect of other causes of chronic inflammation such as tuberculosis, cancers, and connective tissue disorders as confounders is similarly negligible.
The mean age of diagnosis of type 2 DM among adults aged 18–79 years in the US between 1997 and 2011 was 54 years,25 and is similar to the 62.35±9.84 years obtained in our study; however this value doubles the mean age of our controls of 32.38±6.44 years. All controls used for this study were relatively young men and women working in our institution including nurses, doctors, and medical students, which are not representative of the general population; this could impact on results obtained and is a possible limitation of the study. However, the sex distribution in the type 2 DM group and the control group was similar, with approximately 2:1 female:male in both cases.
Our type 2 DM study population had relatively well controlled diabetes, hence RDW-CV and RDW-SD of the type 2 DM group (14.80±0.71 and 46.84±3.18) was almost the same with control values (14.74±1.94 and 46.44±4.64). Also, the mean fasting blood sugar of 147.85±72.54 mg/dL in diabetics compared well with the nondiabetic controls of 95.20±30.10 mg/dL. These closely related results in our study may be accounted for by the fact that the majority of diabetics enrolled had long been on treatment before this study, and their medications performed well.
We found no significant association between the RDW and the duration of diabetes. This finding is in contrast with the findings of studies by Lee and Partley,26 Malandrino et al20 and Heba et al27 who found significant associations between the RDW and macrovascular complications of DM, suggesting that RDW may be a predictor of the onset of diabetic macrovascular complications.
Also in contrast to the studies of Malandrino et al20 and Sherif et al,27 our results showed a statistically insignificant negative correlation between RDW and fasting blood sugar levels in diabetics. While in keeping with many other studies,28–31 a statistically significant positive correlation was achieved between RDW and blood pressure in our patients.
Elevated RDW had been reported as a prognostic marker reflecting an underlying inflammatory state.28 High RDW was strongly associated with poor clinical outcomes in patients with heart failure,28 coronary artery disease,29,30 pulmonary hypertension31 and peripheral arterial disease.32 Increased RDW was also associated with increased mortality in diabetic patients with coronary artery disease treated with percutaneous coronary intervention.33
Conclusion
We could only establish a statistically significant correlation between RDW and blood pressure, not between RDW and fasting blood sugar. Some of the limitations of this study could have impacted our results.
Acknowledgments
We appreciate the efforts of Mr Isa Usman who assisted in blood collection from the participants, and Mr Phillip O Oluwamuhuru who carried out the full blood count on the samples.
Disclosure
The authors have no conflicts of interest in this work.
References
American Diabetes Association. Diagnosis and classification of Diabetes Mellitus. Diabetes Care. 2011;34(Suppl 1):S62–S69. | |
Dangei G, Finucane MM, Lu Y, et al. National, Regional and Global trends in Fasting Plasma Glucose and Diabetes prevalence since 1980; systematic analysis of health examination surveys and epidemiological studies with 370 country-years and 2.7 million participants. Lancet. 2011;378(9785):31–40. | |
Mathers CD, Loncar D. Projections of global mortality and burden of disease from 2002 to 2030. PLOS Med. 2006;3(11):e442. | |
Global Status report on non-communicable diseases 2010. WHO, 2011;176. | |
The Expert Committee on the Diagnosis and Classification of Diabetes Mellitus. Report of the expert committee on the diagnosis and class of Diabetes Mellitus. Diabetes Care. 1997;20:1183–1197. | |
Pickup JC, Crook MA. Is Type 2 Diabetes Mellitus a disease of the innate immune system? Diabetologia. 1998;41:1241–1248. | |
Pickup JC, Mattock MB, Chusney GD, Burt D. NIDDM as a disease of the innate immune system: Association of acute phase reactants and IL-6 with Metabolic Syndrome. Diabetologia. 1997;40:1286–1292. | |
King GK. The role of inflammatory cytokines in diabetes and its complications. J Periodontol. 2008;79:1527–1534. | |
Larsen GL, Henson PM. Mediators of inflammation. Annu Rev Immunol. 1983;1:335–359. | |
Evans T, Jehle D. The red blood cell distribution width. J Emmerg Med. 1991;9(1):71–74. | |
Tesfamarin B, Cohen RA. Free radicals mediate endothelial cell dysfunction caused by elevated glucose. Am J Physiol. 1992;263:321–326. | |
King GL, Loekan MR. Hyperglycaemia-induced oxidative stress in diabetic complications. Histochem Cell Biol. 2004;122:333–338. | |
Felker GM, Allen LA, Pocock SJ, et al. Red cell distribution width as a novel prognostic marker in heart failure; data from the CHARM programme and the Duke Databank. J Am Coll Cardiol. 2007;50:40–47. | |
Tonellim M, Sacks F, Arnold M, et al. Relation between red cell distribution width and cardiovascular event rate in people with coronary disease. Circulation. 2008;117:163–165. | |
Deswal A, Petersen NJ, Feldman AM, Young JB, White BG, Mann DL. Cytokines and cytokine receptors in advance heart failure: An analysis of the cytokine databse from the vesnarinone trial (VEST). Circulation. 2001;103:2055–2059. | |
Chiari MM, Bagnoli R, De Luca PD, Monti M, Rampoldi E, Cunietti E. Influence of acute inflammation on iron and nutritional status indexes in older inpatients. J Am Geriatr Soc. 1995;43:767–771. | |
Pierce C, Larson DF. Inflammatory cytokine inhibition of erythropoiesis in patients implanted with a mechanical device. Perfusion. 2005;20:83–90. | |
Perlstein TS, Weuve J, Pfeffer MA, Beckman JA. Red blood cell distribution width and mortality risk in a community based prospective cohort. Arch Intern Med. 2009;169:588–590. | |
Yesil A, Senates E, Bayoglu IV, et al. Red cell distribution width: A novel marker of activity in inflammatory bowel disease. Gut liver. 2011;5(4):460–467. | |
Malandrino N, Wu WC, Taveira TH, Whtlach HB, Smith RJ. Association between red blood cell distribution width and macrovascular complications in diabetes. Diabetologica. 2012;55:226–235. | |
Evans TC, Jehle D. The red blood cell distribution width. J Emerg Med. 1991;9(1):71–74. | |
Ferrucci L, Guralnik JM, Woodman RC, Bandinelli S, et al. Proinflammatory State and circulating erythropoiesis in persons with or without anaemia. Am J Med. 2005;118(11):1288. e11–1288. e19. | |
Weiss G, Goodnough LT. Anaemia of chronic disease. N Engl J Med. 2005;352:1011–1023. | |
Patel KV, Ferrucci L, Ershler WB, Longo DL, Guralnik JM. Red blood cell distribution width and the risk of death in middle-aged and older adults. Arch Intern Med. 2009;169:515–523. | |
Araneta MR, Grandinetti A, Chang HK. A1C and Diabetes Diagnosis Among Filipino American, Japanese Americans and Native Hawaiians. Diabetes Care. 2010:33(12):2626–2628. | |
Lee YH, Partley RE. The evolving role of inflammation in obesity and the metabolic syndrome. Curr Diab Rep. 2005;5:70–75. | |
Sherif H, Ramadan N, Radwan M, Hamdy E, Reda R. Red Cell Distribution Width as a Marker of Inflammation in Type 2 Diabetes Mellitus. Life Sci J. 2013;10(3):1501–1507. | |
Felker GM, Allen LA, Pocock SJ, et al. Red cell distribution width as a novel prognostic marker in heart failure, data from CHARM program and Duke data bank. J Am Coll Cardiol. 2007;50:40–47. | |
Tonelli M, Sacks F, Arnold M, Moye L, Davis B, Pfeffer M; for the cholesterol and recurrent events (CARE) Trial Investigators. Relation between red blood cells distribution width and cardiovascular event rate in people with coronary disease. Circulation. 2008;117(2):163–168. | |
Dabbah S, Hammerman H, Markiewicz W, Aronson D. Relation between red cell distribution width and clinical outcomes after acute myocardial infarction. Am J Cardiol. 2010;105:312–317. | |
Rhodes CJ, Wharton J, Howard LS, Gibbs JS, Wilkins MR. Red cell distribution width outperforms other potentials circulating biomarkers in predicting survival in idiopathic pulmonary arterial hypertension. Heart. 2011;97:1054–1060. | |
Ye Z, Smith C, Kullo IJ. Usefulness of red cell distribution width to predict mortality in patients with peripheral arterial disease Am J Cardiol. 2011;107:1241–1245. | |
Shuta Tsuboi, katsumi Miyauchi, Takatoshi Kasai, Manabu Ogita, Tomotaka Doli, et al. Impact of Red Blood Cell Distribution Width on long term mortality in Diabetic patients after percutaneous coronary intervention. Circulation Journal. 2013;77:456–461. |
 © 2014 The Author(s). This work is published and licensed by Dove Medical Press Limited. The
full terms of this license are available at https://www.dovepress.com/terms
and incorporate the Creative Commons Attribution
- Non Commercial (unported, 3.0) License.
By accessing the work you hereby accept the Terms. Non-commercial uses of the work are permitted
without any further permission from Dove Medical Press Limited, provided the work is properly
attributed. For permission for commercial use of this work, please see paragraphs 4.2 and 5 of our Terms.
© 2014 The Author(s). This work is published and licensed by Dove Medical Press Limited. The
full terms of this license are available at https://www.dovepress.com/terms
and incorporate the Creative Commons Attribution
- Non Commercial (unported, 3.0) License.
By accessing the work you hereby accept the Terms. Non-commercial uses of the work are permitted
without any further permission from Dove Medical Press Limited, provided the work is properly
attributed. For permission for commercial use of this work, please see paragraphs 4.2 and 5 of our Terms.