Back to Journals » Cancer Management and Research » Volume 10
The positive feedback loop between ILF3 and lncRNA ILF3-AS1 promotes melanoma proliferation, migration, and invasion
Authors Gao G, Li W, Liu S, Han D, Yao X, Jin J, Han D, Sun W, Chen X
Received 7 September 2018
Accepted for publication 11 October 2018
Published 11 December 2018 Volume 2018:10 Pages 6791—6802
DOI https://doi.org/10.2147/CMAR.S186777
Checked for plagiarism Yes
Review by Single anonymous peer review
Peer reviewer comments 2
Editor who approved publication: Dr Chien-Feng Li
Guozhen Gao,1,* Wenjun Li,2,* Sha Liu,1,* Dongmei Han,1 Xingwei Yao,1 Juanjuan Jin,1 Dezhi Han,1 Weijing Sun,1 Xiangjun Chen1
1Department of Burn and Plastic Surgery, The 253rd Hospital of PLA, Hohhot, Inner Mongolia 010051, China; 2Department of Cardio and Nephrology, The 253rd Hospital of PLA, Hohhot, Inner Mongolia 010051, China
*These authors contributed equally to this work
Purpose: In our previous study, we identified that lncRNA ILF3 antisense RNA 1 (ILF3-AS1) is increased and has oncogenic roles in melanoma. However, the cause of the upregulation of ILF3-AS1 and the modulation between ILF3-AS1 and ILF3 in melanoma are still unknown. This study aimed to investigate the significances of the interaction between ILF3-AS1 and ILF3 in melanoma.
Materials and methods: The expression of ILF3 in melanoma tissues and cell lines was measured by quantitative real-time PCR (qRT-PCR). The interactions between ILF3-AS1 and ILF3 were explored by the RNA immunoprecipitation assay, the transcription inhibition assay, qRT-PCR, the chromatin immunoprecipitation assay, and Western blot. Gain-of-function and loss-of-function assays were performed to investigate the effects of ILF3 and ILF3-AS1 on melanoma proliferation, migration, and invasion.
Results: ILF3 is also increased in melanoma tissues and cell lines. Increased expression of ILF3 predicts poor survival of melanoma patients. Mechanistic investigation revealed that ILF3 directly binds ILF3-AS1, increases ILF3-AS1 transcript stability, and upregulates ILF3-AS1 transcript levels. ILF3-AS1 represses the binding of EZH2 to the promoter of ILF3, induces euchromatin formation at ILF3 promoter, and activates ILF3 transcription. Thus, ILF3 and ILF3-AS1 form positive feedback loop, which induces the upregulation of ILF3 and ILF3-AS1 in melanoma. The expression of ILF3-AS1 is positively correlated with ILF3 in melanoma tissues. Functional assays revealed that overexpression of ILF3 promotes melanoma proliferation, migration, and invasion. Depletion of ILF3 inhibits melanoma proliferation, migration, and invasion. Moreover, concurrent depletion of ILF3 and ILF3-AS1 significantly suppresses melanoma proliferation, migration, and invasion.
Conclusion: Both ILF3-AS1 and ILF3 are increased in melanoma. ILF3-AS1 and ILF3 positively regulate each other. Concurrent targeting ILF3-AS1 and ILF3 has significant tumor-suppressive roles in melanoma. Our data suggested that targeting the positive feedback loop between ILF3 and ILF3-AS1 may be promising therapeutic strategies for melanoma.
Keywords: lncRNA, ILF3-AS1, feedback loop, ILF3, melanoma, progression
Introduction
Malignant melanoma is the most common aggressive skin cancers with increasing incidence and mortality worldwide.1 Despite great advances in surgical resection, targeted molecularly therapy, and immunotherapy, the prognosis of melanomas remains poor, particular for those melanomas with late stages.2 Thus, it is necessary to further identify key molecular events underlying the initiation and progression of melanoma and develop more effective treatments for melanoma.
The mechanisms implicated in melanoma are diverse and complex.3,4 Previous studies have identified several genomic mutations of oncogenes or tumor suppressors in melanoma, such as the well-known BRAF and NRAS oncogenes.5,6 However, recent advances in high-throughput sequencing have revealed more aberrations in noncoding RNAs compared with protein-coding genes in melanoma.7,8 Among these noncoding RNAs, lncRNAs gradually demonstrate great importance.9 lncRNA is a class of RNA with >200 nucleotides in length and limited protein-coding potential.10,11 Large-scale transcriptome sequencings have identified >58,000 lncRNAs in human cells.8 Many of these lncRNAs are revealed to be aberrantly expressed in melanoma and have various oncogenic or tumor-suppressive roles. lncRNA THOR is reported to be conserved and promotes melanoma onset.12 lncRNA SAMMSON is unregulated in melanoma and increases melanoma viability and drug resistance.13 lncRNA SLNCR1 is increased in melanoma and promotes melanoma invasion.14 In our previous study, we also identified the upregulation and role of lncRNA ILF3-AS1, MHENCR, and PVT1 in melanoma.15–17 Although many previous reports, including ours, have found the aberrant expression of lncRNAs in melanoma, the reasons contributing to the dysregulation of lncRNAs in melanoma are still largely unknown.
In this study, we focus on the aberrant expression of lncRNA ILF3-AS1 in melanoma. In our previous study, we have found that ILF3-AS1 is upregulated in melanoma and promotes melanoma proliferation, migration, and invasion.15 ILF3-AS1 localizes at chromosome 19p13.2. ILF3-AS1 is an antisense RNA of ILF3 with head-to-head reverse complementary to ILF3. ILF3 is a RNA-binding protein and has oncogenic roles in hepatocellular carcinoma, cervical cancer, colorectal cancer, bladder cancer, and ovarian carcinoma.18–22 However, the biological roles of ILF3 in melanoma are unknown. Furthermore, as an RNA-binding protein, whether ILF3 binds and regulates ILF3-AS1 is also unknown. Several antisense RNAs are revealed to epigenetically regulate the expression of complementary genes.23–25 Although our previous study has found that ILF3-AS1 physically binds histone methyltransferase EZH2 and changes the repressive chromatin marker histone H3 lysine 27 tri-methylation (H3K27me3) levels,15 whether ILF3-AS1 regulates ILF3 via the interaction with EZH2 is still unclear. Therefore, in the current study, we investigated the interplay between ILF3 and ILF-AS1, exploring the biological roles and clinical significances of their interplay in melanoma.
Materials and methods
Tissue specimens
A total of 37 benign nevi and 60 primary melanoma tissues have been used in our previous report.15 They were acquired from patients who received surgical resection in the 253rd Hospital of PLA (Hohhot, Inner Mongolia, China) with written informed consent. All tissue specimens were histopathologically confirmed. This study was conducted in accordance with the Declaration of Helsinki and was reviewed and approved by the Review Board of the 253rd Hospital of PLA (Hohhot, Inner Mongolia, China).
Cell culture and treatment
The human epidermal melanocyte HEMa-LP was purchased from Thermo Fisher Scientific (Waltham, MA, USA) and maintained in Medium 254 and Human Melanocyte Growth Supplement-2 (Thermo Fisher Scientific). The human melanoma cell lines SK-MEL-2, SK-MEL-28, and A375 were purchased from American Type Culture Collection (ATCC) (Manassas, VA, USA). SK-MEL-2 and SK-MEL-28 cells were maintained in Eagle’s minimum essential medium (Thermo Fisher Scientific). A375 cell was maintained in DMEM (Thermo Fisher Scientific). All the cells were cultured in the above described medium added with 10% FBS (Thermo Fisher Scientific) at 37°C in a humidified atmosphere of 5% CO2. Where indicated, cells were treated with 50 µM α-amanitin (Sigma-Aldrich Co., St Louis, MO, USA) for 0–24 hours as displayed in this article. All cell lines were identified by short tandem repeats method.
RNA extraction and quantitative real-time PCR (qRT-PCR)
Total RNA was isolated from tissue specimens and cells using the TRIzol reagent (Thermo Fisher Scientific) according to the manufacturer’s protocol. After being treated with DNase I (Takara, Dalian, China) to remove genomic DNA, the RNA was used to carry out reverse transcription to generate the first-strand cDNA with the M-MLV Reverse Transcriptase (Thermo Fisher Scientific) according to the protocols. qRT-PCR was carried out on the StepOnePlus system (Thermo Fisher Scientific) with SYBR® Premix Ex Taq™ II (Takara) according to the standard qRT-PCR protocol. β-Actin was used as endogenous control for the quantification of ILF3-AS1 and ILF3. 18S rRNA was used as endogenous control for the detection of stability of IL3-AS1 transcript. The sequences of primers were as follows: 5′-TAAACCCCACTGTCTTCC-3′ (sense) and 5′-TTCCTTGCTCTTCTTGCTC-3′ (anti-sense) for ILF3-AS1; 5′-TTTTCCCTGACACCCCTCTC-3′ (sense) and 5′-TAGCTTCCATACCCAGCACC-3′ (anti-sense) for ILF3; 5′-AAAGAGGGGAGTGCGGAAC-3′ (sense) and 5′-TCACCAGGGACACGAGATG-3′ (anti-sense) for LincIN; 5′-ACACGGACAGGATTGACAGA-3′ (sense) and 5′-GGACATCTAAGGGCATCACA-3′ (anti-sense) for 18S rRNA; 5′-GGGAAATCGTGCGTGACATTAAG-3′ (sense) and 5′-TGTGTTGGCGTACAGGTCTTTG-3′ (antisense) for β-actin. The quantification of RNAs expression was calculated using the comparative Ct method.
Western blot
Total cell lysates were prepared in 1× sodium dodecyl sulfate (SDS) loading buffer (Beyotime, Shanghai, China). Equal amounts of proteins were separated by SDS-PAGE and transferred onto polyvinylidene fluoride membranes (EMD Millipore, Bedford, MA, USA). After blocking with 5% non-fat milk, the membranes were incubated with primary antibodies specific for ILF3 (Abcam, Cambridge, MA, USA) or β-actin (Abcam) at 4°C overnight. After three times of washes, the membranes were incubated with horseradish peroxidase-conjugated goat antimouse or goat antirabbit secondary antibody (Abcam) and detected using the enhanced chemiluminescence.
Plasmids’ construction and transfection
The complementary DNA encoding ILF3 was PCR-amplified by the Ex Taq DNA polymerase hot-start version (Takara) and subcloned into the Nhe I and Kpn I sites of pcDNA3.1(+) plasmid (Thermo Fisher Scientific). The sequences of primers were as follows: 5′-CTAGCTAGCGATAAGCAAAAGTTTGATTTCCAG-3′ (sense) and 5′-GGGGTACCGGAGTAAGTGCAGAAGGTAGA-3′ (anti-sense). The empty plasmid pcDNA3.1(+) was used as negative control. To knock down ILF3 expression, two oligonucleotides for shRNAs were synthesized and inserted into the shRNA expression vector pGPH1/Neo (GenePharma, Shanghai, China). The sequences of shRNAs were 5′-ccaaggaacTcTaTcacaa-3′ for sh-ILF3-122 and 5′-CCACTGATGCTATTGGGCATCTAGA-3′ for sh-ILF3-2.19 A scrambled nontargeted shRNA was used as a negative control. The transfections of plasmids were carried out using Lipofectamine 3000 (Thermo Fisher Scientific) according to the protocol.
RNA immunoprecipitation (RIP) assay
RIP assay was carried out in A375 cells using the EZ-Magna RIP™ RNA Binding Protein Immunoprecipitation Kit (EMD Millipore) and ILF3-specific antibody (Abcam) according to the instructions. The retrieved RNA was reverse transcribed and quantified by qRT-PCR as above described.
Chromatin immunoprecipitation (ChIP) assay
ChIP assay was carried out using the EZ-Magna ChIP™ A/G Chromatin Immunoprecipitation Kit (EMD Millipore) and EZH2-specific antibody (EMD Millipore) or H3K27me3-specific antibody (EMD Millipore) according to the instructions. The retrieved DNA was quantified by qRT-PCR as above described. The sequences of primers for ILF3 promoter were as follows: 5′-AGGTCTGCGGGACGAAAG-3′ (sense) and 5′-CAGTGGAGGTGGCTATGCT-3′ (anti-sense).
Cell proliferation assay
Cell proliferation was determined using the Glo cell viability assay and the ethynyl deoxyuridine (EdU) incorporation assay. For the Glo cell viability assay, indicated melanoma cells were plated into 96-well plates with 3,000 cells/well. The luminescence values at indicated time points in this article were obtained using the Cell Titer-Glo Luminescent Cell Viability Assay (Promega Corporation, Fitchburg, WI, USA) in accordance with the manufacturer’s instruction. The EdU incorporation assay was carried out with an EdU Kit (Hoffman-La Roche Ltd., Basel, Switzerland) in accordance with the instruction. Representative images were obtained using the Photomicroscope (Carl Zeiss Meditec AG, Jena, Germany), and the results were quantified using the Image-Pro plus 6.0 software via accounting at least ten random fields.
Cell migration and invasion assays
Cell migration and invasion potentials were determined using the transwell migration assay and the transwell invasion assay, respectively. A total of 80,000 indicated melanoma cells resuspended in serum-free medium with 1 µg/mL of mitomycin C (Selleck, Houston, TX, USA) to inhibit cell proliferation were seeded into the upper well of a 24-well transwell insert (8 µm pore size; EMD Millipore). For the invasion assay, coating matrigel (BD Biosciences, San Jose, CA, USA) was plated into the upper well before the seeding of cells. The lower chamber was filled with complete medium. After incubation for 24 hours, cells on the upper surface of transwell insert were completely scraped off with a cotton swab and the migratory and invasive cells on the lower surface were fixed, stained, and counted.
Statistical analyses
Statistical analyses were implemented using the SPSS 18.0 software (SPSS Inc., Chicago, IL, USA). For comparisons, Mann–Whitney U-test, log-rank test, one-way ANOVA, Student’s t-test, and Pearson correlation analysis were carried out as indicated. P<0.05 was considered as statistically significant.
Results
ILF3 is increased in melanoma and predicts poor survival of melanoma patients
We first evaluated the expression pattern of ILF3 in melanoma via measuring ILF3 expression levels in 37 benign nevi and 60 primary melanoma tissues used in our previous report.15 As shown in Figure 1A, ILF3 is also increased in melanoma tissues compared with benign nevi tissues, which is consistent with the expression pattern of ILF3-AS1 in melanoma. Furthermore, analyses of the correlation between ILF3 expression and clinicopathological features of these 60 primary melanomas revealed that ILF3 is increased in melanomas in T2/T3/T4 stages (>1 mm thick) compared with that in T1 stage (≤1 mm thick) (Figure 1B). Kaplan–Meier survival analysis revealed that increased expression of ILF3 is associated with the poor overall survival of melanoma patients (Figure 1C). ILF3 expression levels in human epidermal melanocyte HEMa-LP and melanoma cell lines SK-MEL-2, SK-MEL-28, and A375 were also detected. As shown in Figure 1D, ILF3 is also increased in melanoma cell lines compared with epidermal melanocyte.
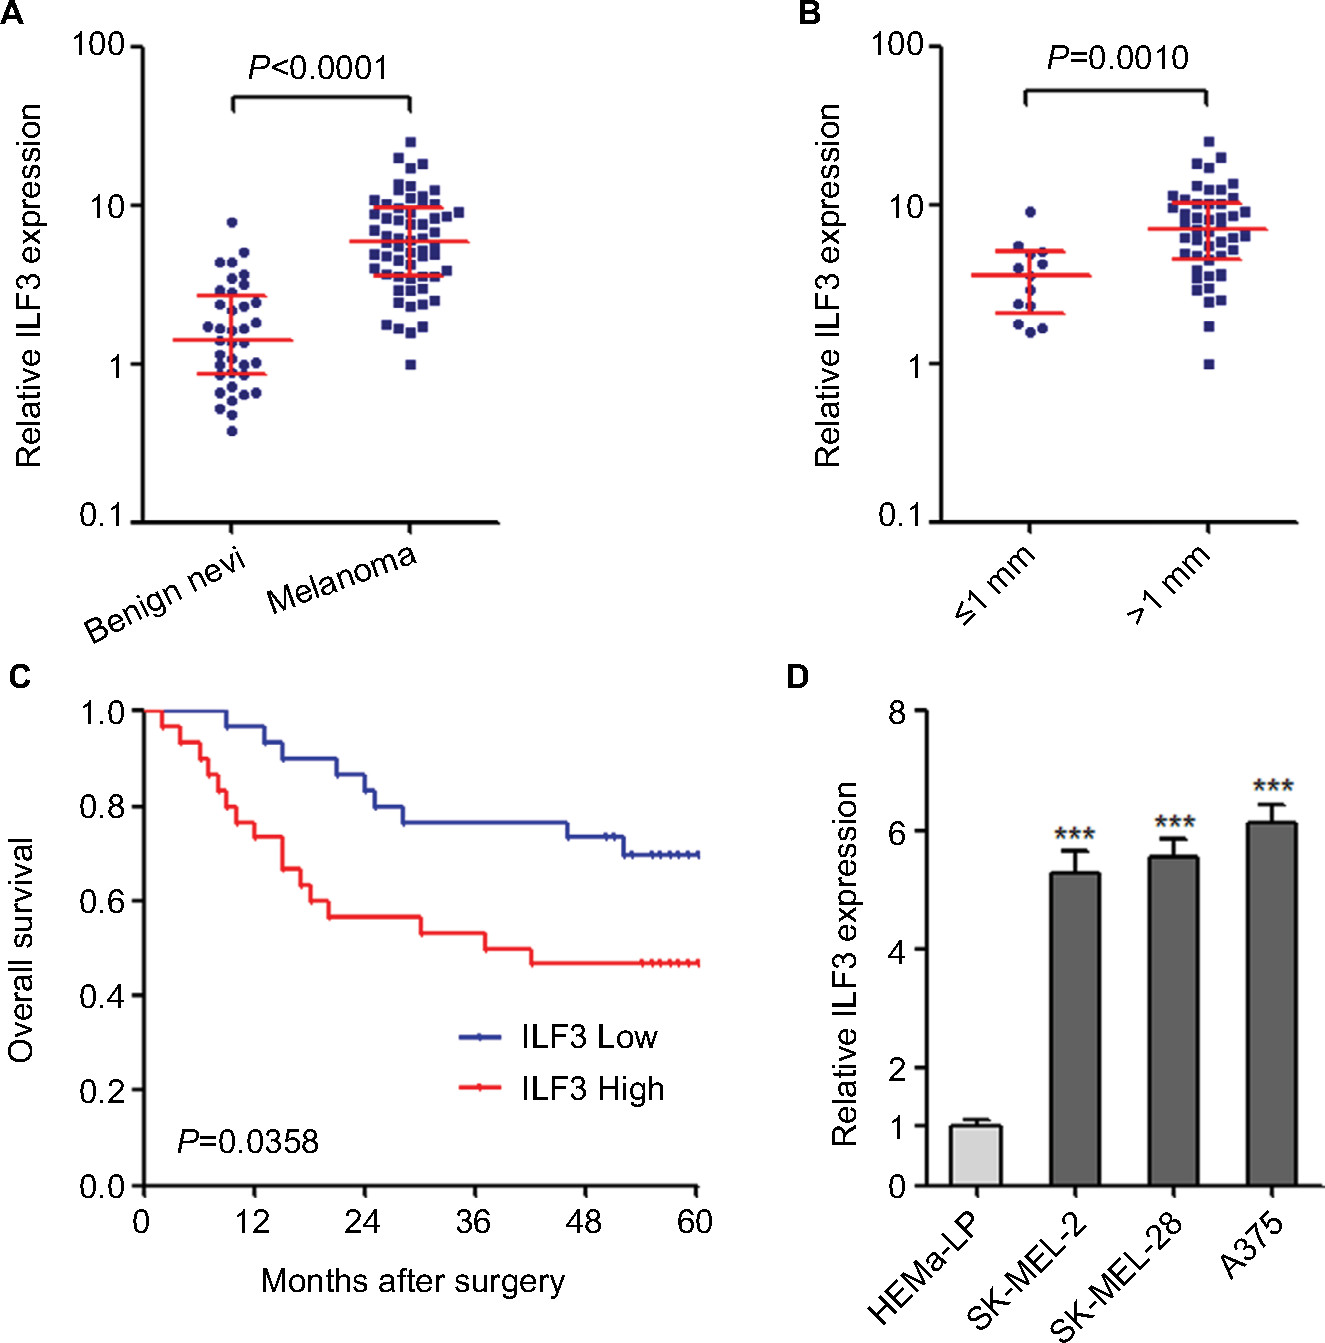 | Figure 1 ILF3 is increased in melanoma and correlated with poor prognosis. Notes: (A) ILF3 expression levels in 37 benign nevi and 60 primary melanoma tissues were determined by qRT-PCR. Results are presented as median with IQR; P<0.0001 by Mann–Whitney U-test. (B) ILF3 expression levels in melanoma tissues categorized based on tumor thickness; n=13 for ≤1 mm thick group, n=47 for >1 mm thick group; P=0.0010 by Mann–Whitney U-test. (C) Kaplan–Meier survival analysis of the correlation between ILF3 expression levels and overall survival of these 60 melanoma patients. ILF3 median expression level was used as the cutoff. P=0.0358 by log-rank test. (D) ILF3 expression levels in human epidermal melanocytes HEMa-LP and melanoma cell lines SK-MEL-2, SK-MEL-28, and A375 were determined by qRT-PCR. Results are presented as mean ± SD based on three independent experiments. ***P<0.001 by one-way ANOVA. Abbreviation: qRT-PCR, quantitative real-time PCR. |
ILF3 physically binds and increases the stability of ILF3-AS1
ILF3 is a well-known RNA-binding protein and regulates the stability of bound RNA.19,20,22 To investigate whether ILF3 has regulatory roles in ILF3-AS1, we first detected the interaction between ILF3 and ILF3-AS1. RIP assays using ILF3-specific antibody displayed that ILF3-AS1 is specifically enriched in the RNA retrieved using the ILF3 antibody (Figure 2A), suggesting that ILF3 physically binds ILF3-AS1. LincIN is previously reported to be bound by ILF3 and used as a positive control.26 Next, we investigated the effects of ILF3 on ILF3-AS1 RNA stability. We overexpressed ILF3 in SK-MEL-2 cells via transiently transfecting ILF3 overexpression plasmid, and the overexpression efficiency was confirmed by Western blot (Figure 2B). Conversely, we repressed ILF3 in A375 cells via transiently transfecting two independent ILF3-specific shRNAs and the knockdown efficiency was confirmed by Western blot (Figure 2C). After transiently overexpressing ILF3, we treated SK-MEL-2 cells with α-amanitin to block new RNA synthesis and, then, the degradation of ILF3-AS1 transcript over a 24-hour period was detected. As shown in Figure 2D, enhanced expression of ILF3 elongated the half-life and reduced the degradation rate of ILF3-AS1 transcript, suggesting that ILF3 increases ILF3-AS1 transcript stability. In addition, after transiently repressing ILF3, we treated A375 cells with α-amanitin to block new RNA synthesis and, then, the degradation of ILF3-AS1 transcript over a 24-hour period was detected. As shown in Figure 2E, ILF3 knockdown shortened the half-life and induced the degradation of ILF3-AS1 transcript, suggesting that ILF3 knockdown decreases the stability of ILF3-AS1 transcript. The expression levels of ILF3-AS1 in SK-MEL-2 cells after transiently overexpressing ILF3 were detected by qRT-PCR. As shown in Figure 2F, enhanced expression of ILF3 upregulated ILF3-AS1 expression. Conversely, the expression levels of ILF3-AS1 were decreased in A375 cells after transiently repressing ILF3 (Figure 2G). Collectively, these results indicated that ILF3 physically binds ILF3-AS1 transcript, increases the stability of ILF3-AS1 transcript, and upregulates the expression of ILF3-AS1.
 | Figure 2 ILF3 physically binds and increases the stability of ILF3-AS1 transcript. Notes: (A) RIP assays followed by qRT-PCR revealed the specific enrichment of ILF3-AS1 with ILF3-specific antibody compared with nonspecific IgG. β-Actin mRNA was used as a negative control. LincIN was used as a positive control. (B) Forty-eight hours after transiently transfecting ILF3 overexpression plasmid into SK-MEL-2 cells, ILF3 protein levels were determined by Western blot. (C) Forty-eight hours after transiently transfecting two independent ILF3-specific shRNAs into A375 cells, ILF3 protein levels were determined by Western blot. (D) Forty-eight hours after transiently transfecting ILF3 overexpression plasmid into SK-MEL-2 cells, the cells were treated with 50 µM α-amanitin to block new RNA synthesis, and then, the stability of ILF3-AS1 transcript over time was determined by qRT-PCR. 18S rRNA, a product of RNA polymerase I that is unchanged by α-amanitin, was used as endogenous control. (E) Forty-eight hours after transiently transfecting two independent ILF3-specific shRNAs into A375 cells, the cells were treated with 50 µM α-amanitin to block new RNA synthesis and, then, the stability of ILF3-AS1 transcript over time was determined by qRT-PCR. 18S rRNA, a product of RNA polymerase I that is unchanged by α-amanitin, was used as endogenous control. (F) Forty-eight hours after transiently transfecting ILF3 overexpression plasmid into SK-MEL-2 cells, ILF3-AS1 transcript levels were determined by qRT-PCR. (G) Forty-eight hours after transiently transfecting two independent ILF3-specific shRNAs into A375 cells, ILF3-AS1 transcript levels were determined by qRT-PCR. Results are presented as mean ± SD based on at least three independent experiments. **P<0.01; ***P<0.001 by Student’s t-test (A, D, and F) or one-way ANOVA (E and G). Abbreviations: qRT-PCR, quantitative real-time PCR; RIP, RNA immunoprecipitation. |
ILF3-AS1 epigenetically activates ILF3 expression
Next, we investigated whether ILF3-AS1 regulates ILF3. In our previous study, we have found that ILF3-AS1 interacts with and changes the genomic location of EZH2 and further modulates the repressive chromatin marker histone H3 lysine 27 tri-methylation (H3K27me3) levels.15 Thus, we further investigated whether ILF3-AS1 modulates the binding of EZH2 to the promoter of ILF3 and H3K27me3 levels at ILF3 promoter. ChIP assays were performed in our previously constructed ILF3-AS1 stably overexpressed and depleted A375 cells using EZH2 or H3K27me3-specific antibodies. As shown in Figure 3A, enhanced expression of ILF3-AS1 reduced the binding of EZH2 to ILF3 promoter and H3K27me3 levels at ILF3 promoter. Conversely, ILF3-AS1 knockdown increased the binding of EZH2 to ILF3 promoter and H3K27me3 levels at ILF3 promoter (Figure 3B). H3K27me3 is a repressive chromatin marker. Therefore, we further investigate the effects of ILF3-AS1 on ILF3 transcription. As shown in Figure 3C and D, ILF3 mRNA levels were increased in ILF3-AS1 stably overexpressed while reduced in ILF3-AS1 stably depleted A375 cells. Moreover, ILF3 protein levels were increased in ILF3-AS1 stably overexpressed and reduced in ILF3-AS1 stably depleted A375 cells (Figure 3E and F). Collectively, these results indicated that ILF3-AS1 interacts with EZH2, reduces the binding of EZH2 to ILF3 promoter, decreases H3K27me3 level at ILF3 promoter, and activates ILF3 expression.
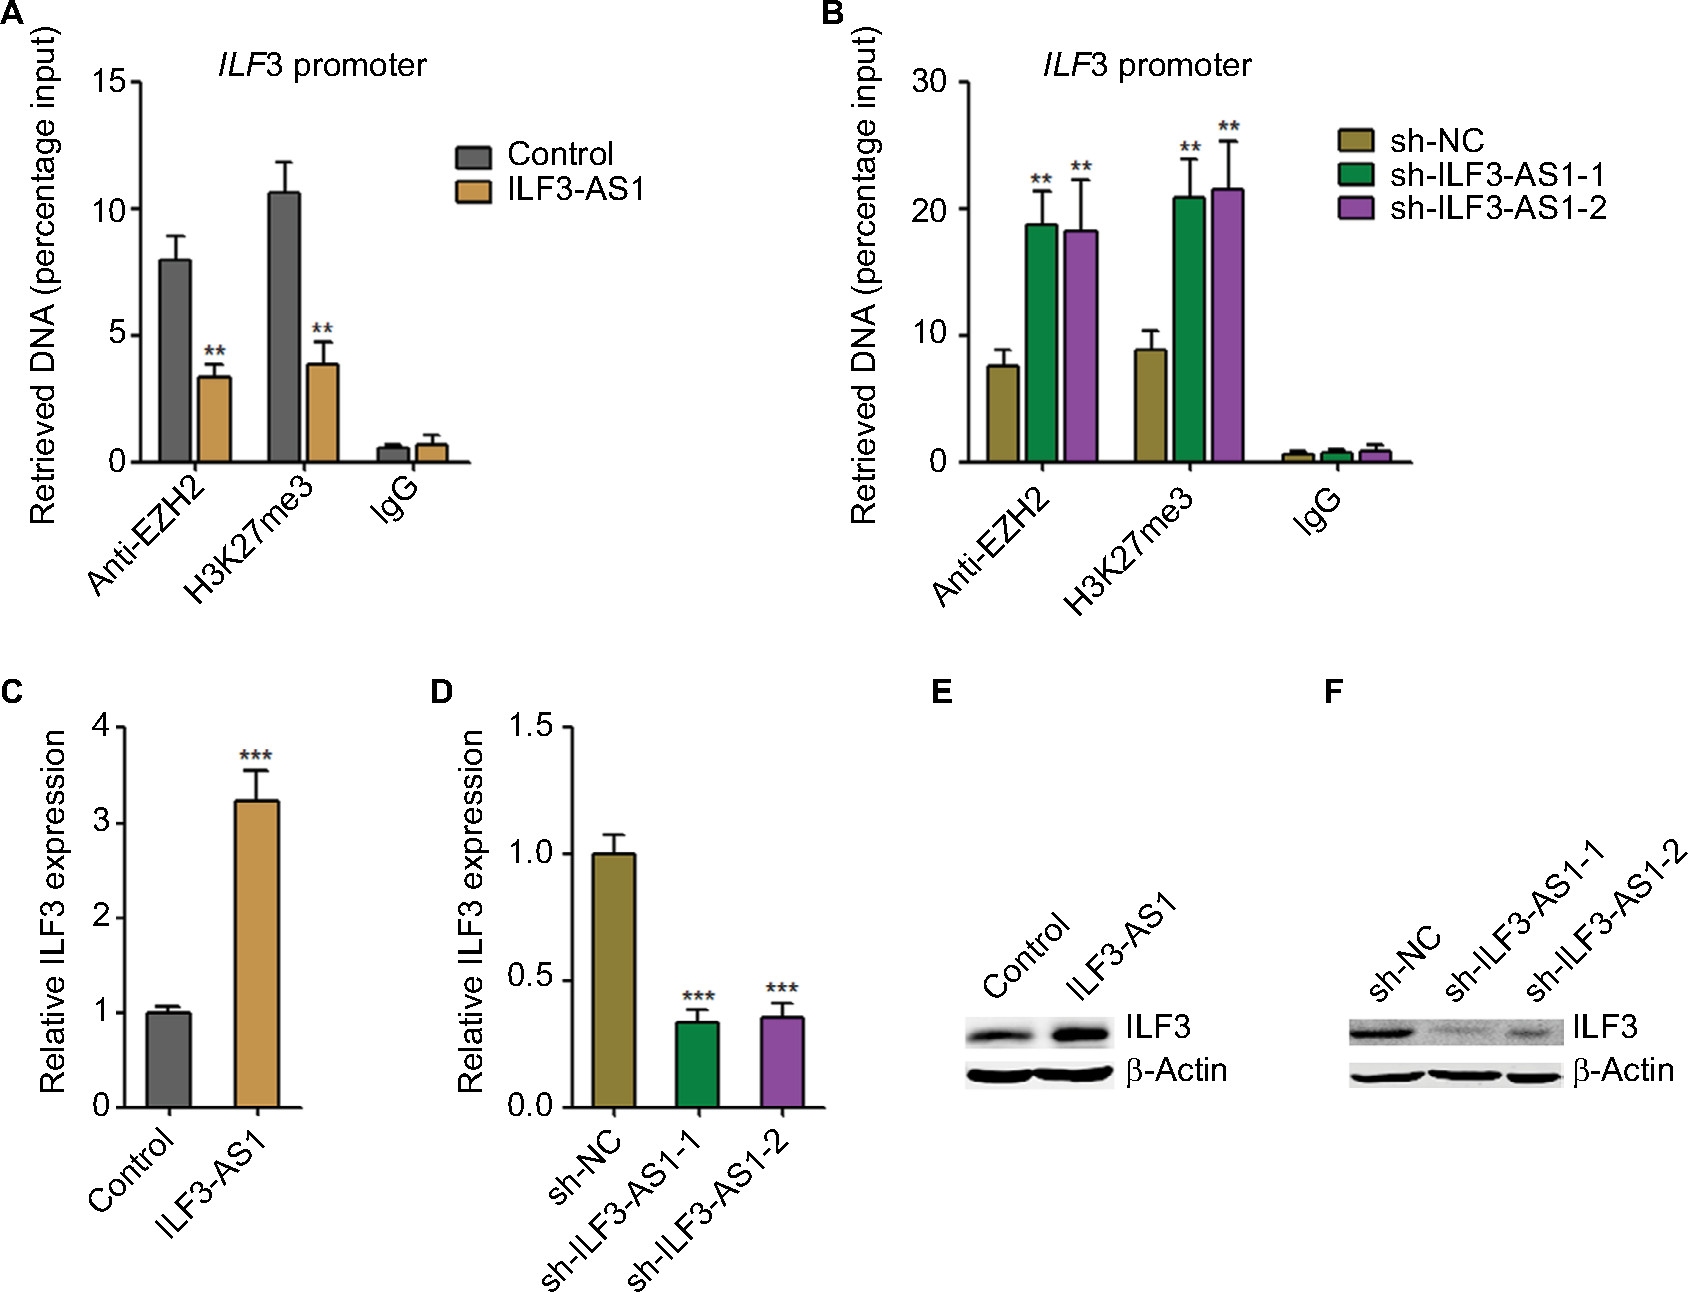 | Figure 3 ILF3-AS1 epigenetically activates ILF3 expression. Notes: (A) The specific binding of EZH2 to ILF3 promoter and H3K27me3 levels at ILF3 promoter in ILF3-AS1 stably overexpressed and control A375 cells were determined by ChIP assays followed by qRT-PCR. (B) The specific binding of EZH2 to ILF3 promoter and H3K27me3 levels at ILF3 promoter in ILF3-AS1 stably depleted and control A375 cells were determined by ChIP assays followed by qRT-PCR. (C) ILF3 mRNA levels in ILF3-AS1 stably overexpressed and control A375 cells were determined by qRT-PCR. (D) ILF3 mRNA levels in ILF3-AS1 stably depleted and control A375 cells were determined by qRT-PCR. (E) ILF3 protein levels in ILF3-AS1 stably overexpressed and control A375 cells were determined by Western blot. (F) ILF3 protein levels in ILF3-AS1 stably depleted and control A375 cells were determined by Western blot. Results are presented as mean ± SD based on at least three independent experiments. **P<0.01; ***P<0.001 by Student’s t-test (A and C) or one-way ANOVA (B and D). Abbreviations: ChIP, chromatin immunoprecipitation; qRT-PCR, quantitative real-time PCR. |
ILF3 expression levels are significantly positively associated with that of ILF3-AS1 in melanoma tissues
ILF3 and ILF3-AS1 reciprocally positively regulate each other. Therefore, we further investigated whether the regulation exists in vivo. The correlation between ILF3 expression levels and ILF3-AS1 expression levels in 60 melanoma tissues used in Figure 1A was analyzed by Pearson correlation. As shown in Figure 4, ILF3 expression levels were statistically significantly positively correlated with ILF3-AS1 expression levels in melanoma tissues (r=0.7376, P<0.0001). This result supports the positive regulation between ILF3 and ILF3-AS1.
 | Figure 4 The positive correlation between ILF3 and ILF3-AS1 expression levels in melanoma. Note: The correlation between ILF3 and ILF3-AS1 expression levels in 60 melanoma tissues was determined by Pearson correlation analysis: r=0.7376, P<0.0001. |
Overexpression of ILF3 promotes melanoma proliferation, migration, and invasion
Our previous study has identified that ILF3-AS1 promotes melanoma proliferation, migration, and invasion.15 Due to the positive regulation between ILF3 and ILF3-AS1, we next investigate the biological roles of ILF3 in melanoma. After transiently transfecting ILF3 overexpression plasmids into SK-MEL-2 cells, cell proliferation was evaluated using the Glo cell viability assay and the EdU incorporation assay. As shown in Figure 5A, enhanced expression of ILF3 increased the cell viability of SK-MEL-2 cells. Enhanced expression of ILF3 also increased the percentage of EdU-positive and proliferative cells (Figure 5B). Transwell migration assay displayed that enhanced expression of ILF3 increased the number of migrated cells (Figure 5C). Transwell invasion assay displayed that enhanced expression of ILF3 increased the number of invasive cells (Figure 5D). These results suggested that consistent with the roles of ILF3-AS1, ILF3 also promotes melanoma proliferation, migration, and invasion.
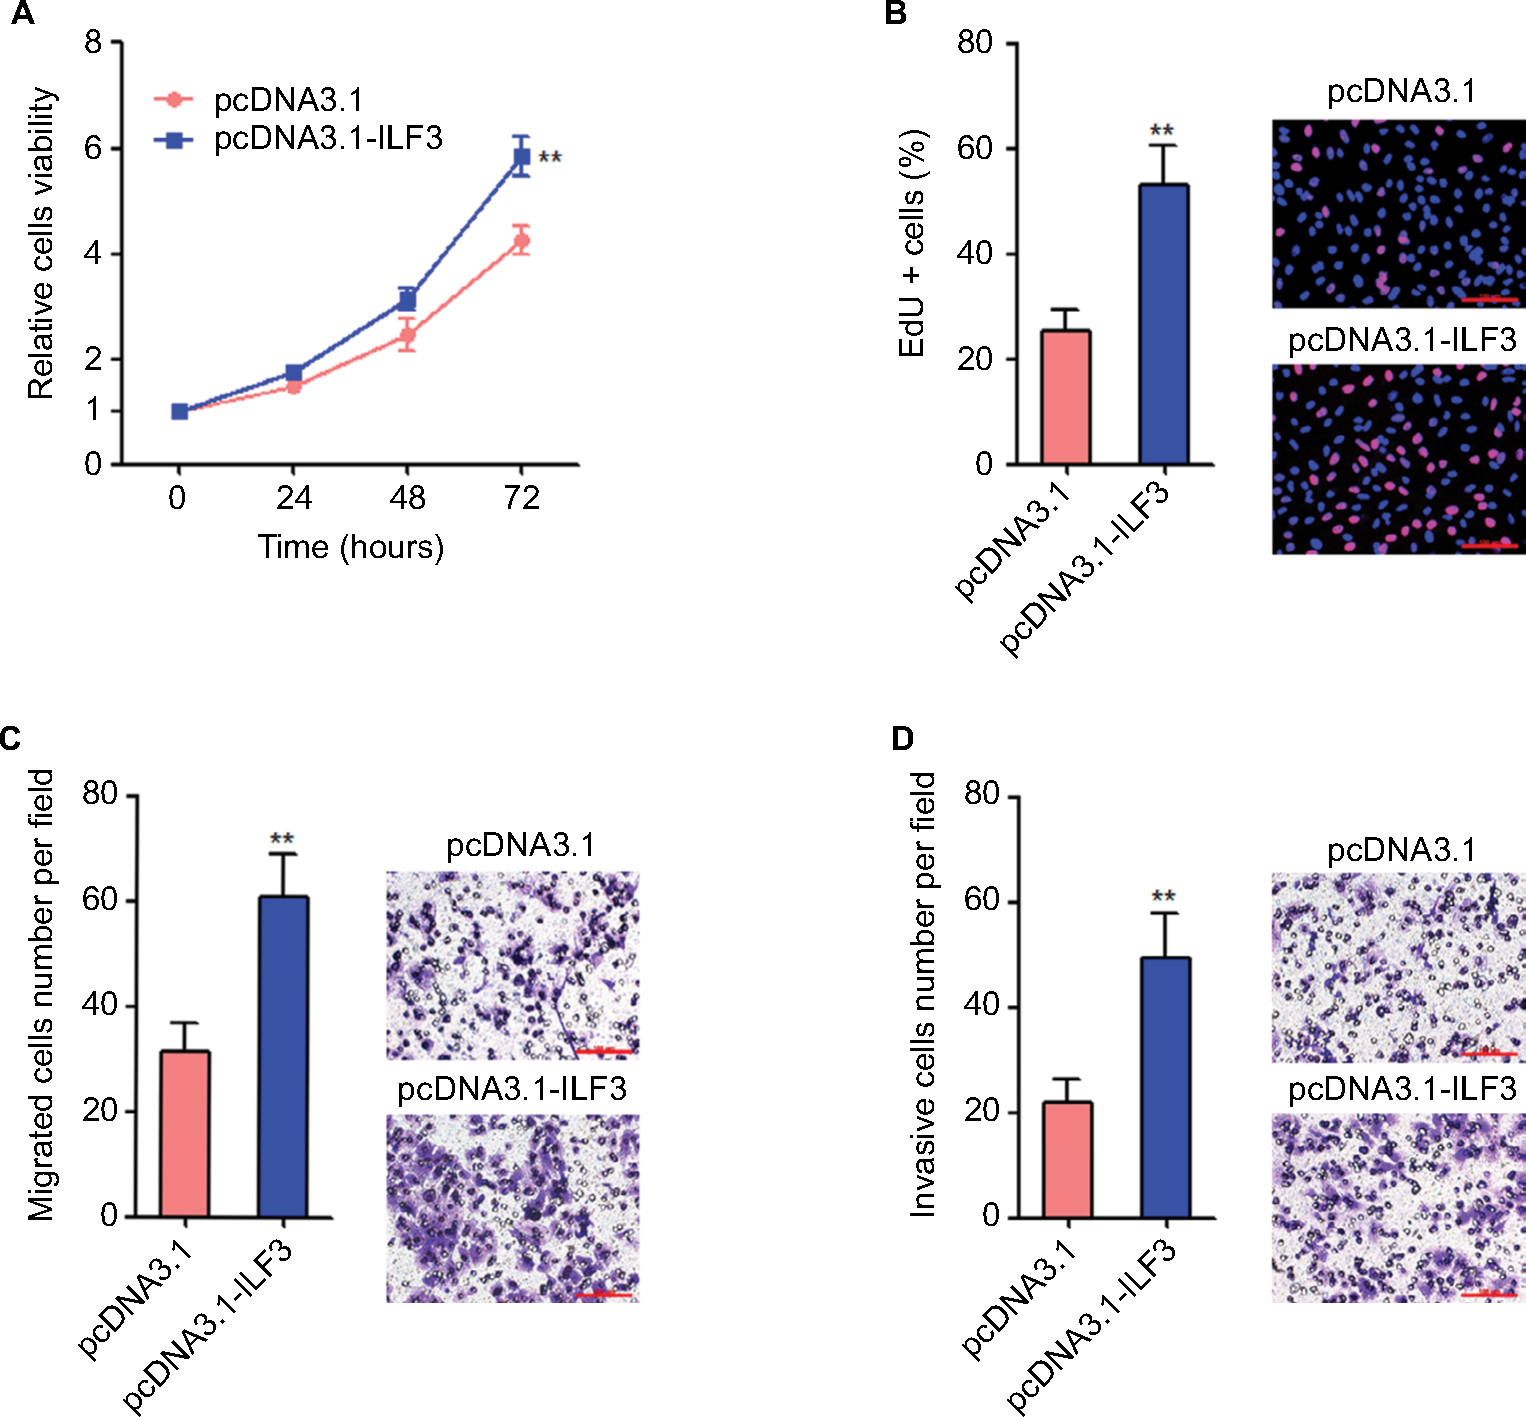 | Figure 5 Overexpression of ILF3 promotes melanoma proliferation, migration, and invasion. Notes: (A) Twenty-four hours after transiently transfecting ILF3 overexpression plasmids into SK-MEL-2 cells, cell viabilities of SK-MEL-2 cells were determined by the Glo cell viability assay. (B) Forty-eight hours after transiently transfecting ILF3 overexpression plasmids into SK-MEL-2 cells, cell proliferation of SK-MEL-2 cells was determined by the EdU incorporation assay. The red color indicates EdU-positive nuclei. Scale bars, 100 µm. (C) Forty-eight hours after transiently transfecting ILF3 overexpression plasmids into SK-MEL-2 cells, cell migration of SK-MEL-2 cells was determined by transwell migration assay. Scale bars, 100 µm. (D) Forty-eight hours after transiently transfecting ILF3 overexpression plasmids into SK-MEL-2 cells, cell invasion of SK-MEL-2 cells was determined by transwell invasion assay. Scale bars, 100 µm. Results are presented as mean ± SD based on at least three independent experiments. **P<0.01 by Student’s t-test. Abbreviation: EdU, ethynyl deoxyuridine. |
Depletion of ILF3 inhibits melanoma proliferation, migration, and invasion
We further evaluated the biological roles of ILF3 knockdown in melanoma. After transiently transfecting two independent ILF3-specific shRNAs into A375 cells, cell proliferation was evaluated using the Glo cell viability assay and the EdU incorporation assay. As shown in Figure 6A, ILF3 knockdown decreased the cell viability of A375 cells. ILF3 knockdown also reduced the percentage of EdU-positive and proliferative cells (Figure 6B). Transwell migration assay displayed that ILF3 knockdown decreased the number of migrated cells (Figure 6C). Transwell invasion assay displayed that ILF3 knockdown reduced the number of invasive cells (Figure 6D). These results indicated that depletion of ILF3 inhibits melanoma proliferation, migration, and invasion.
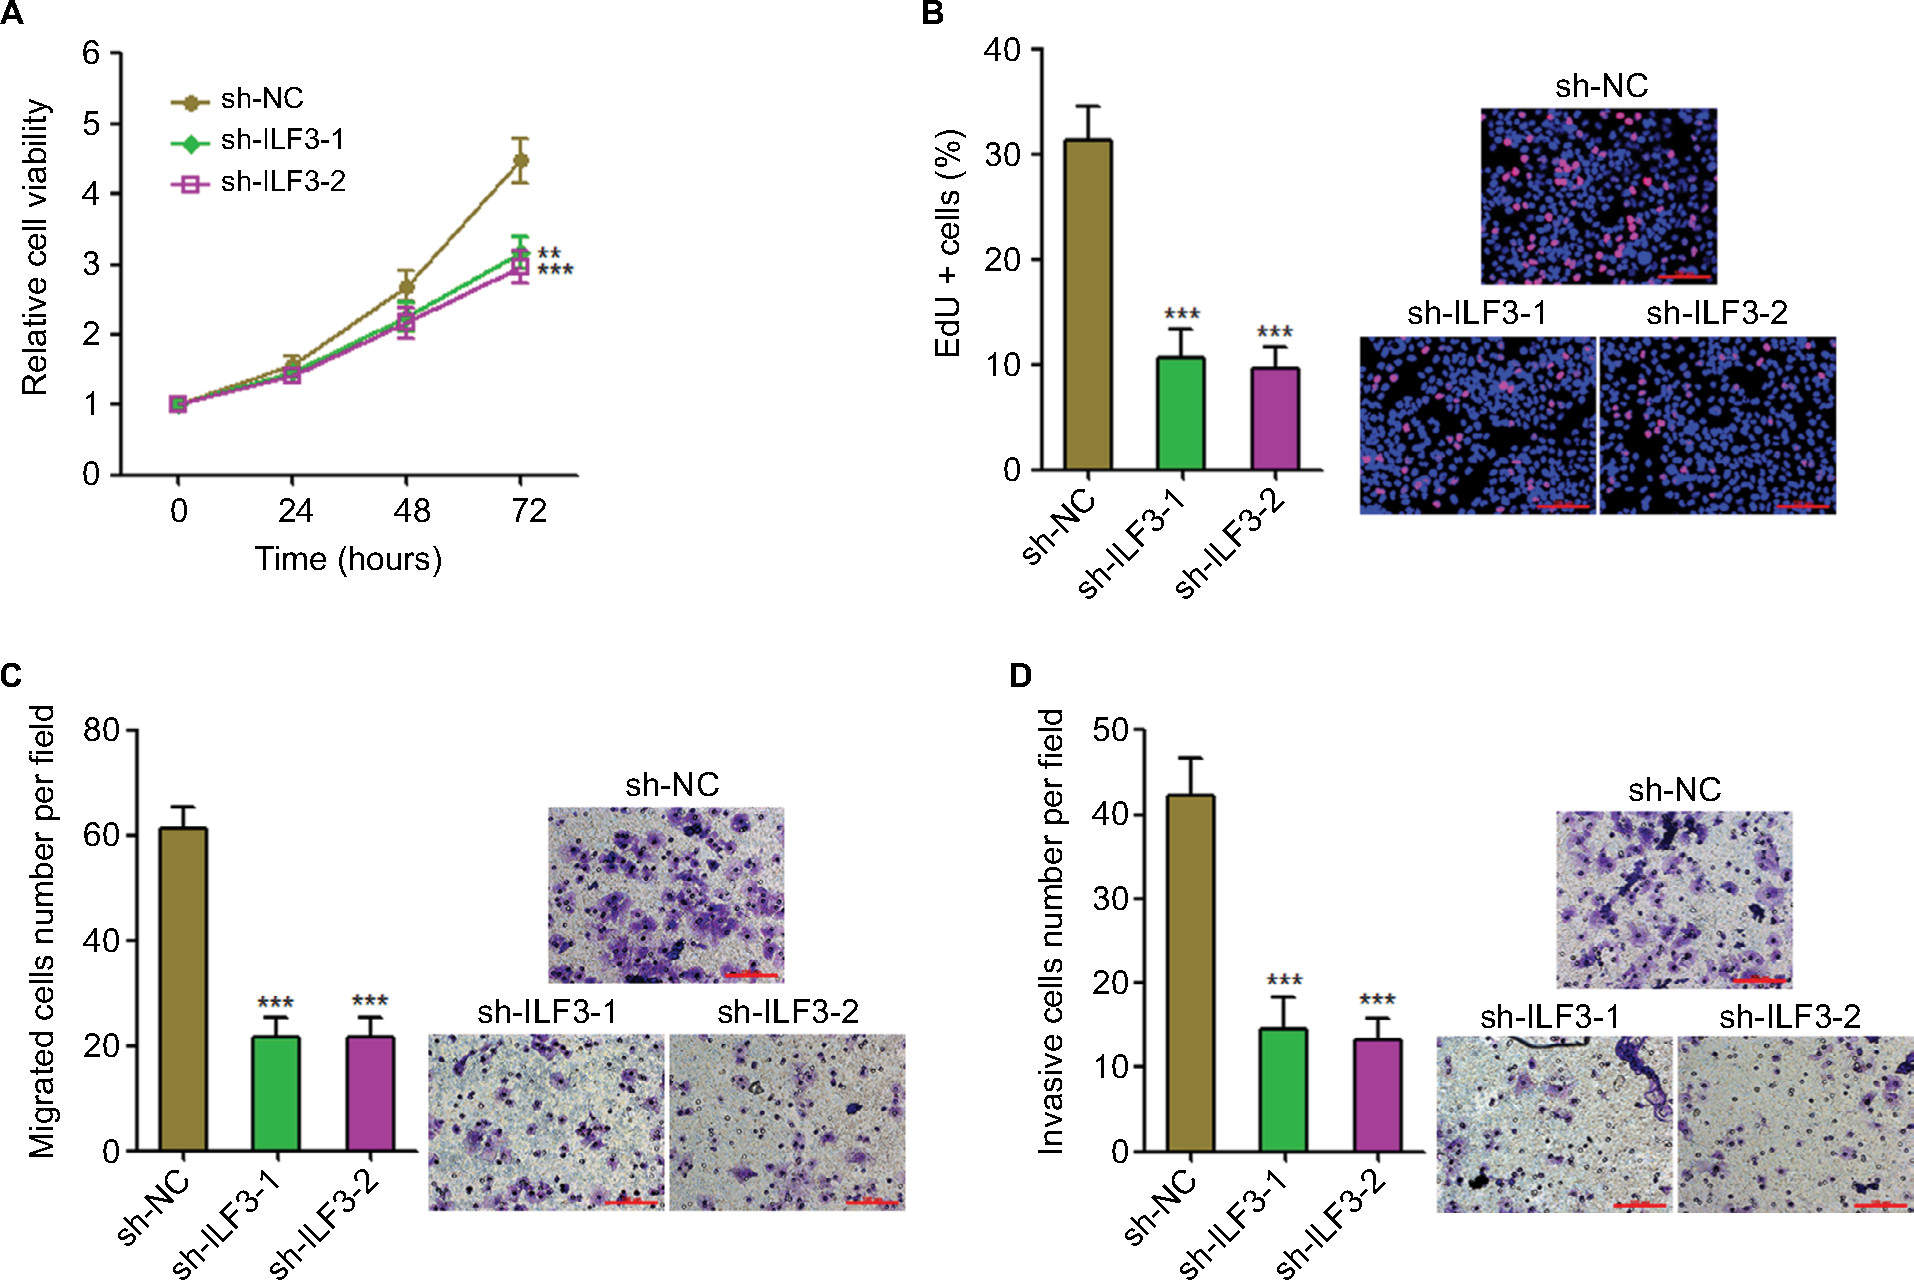 | Figure 6 Knockdown of ILF3 inhibits melanoma proliferation, migration, and invasion. Notes: (A) Twenty-four hours after transiently transfecting two independent ILF3-specific shRNAs into A375 cells, cell viabilities of A375 cells were determined by the Glo cell viability assay. (B) Forty-eight hours after transiently transfecting two independent ILF3-specific shRNAs into A375 cells, cell proliferation of A375 cells was determined by the EdU incorporation assay. The red color indicates EdU-positive nuclei. Scale bars, 100 µm. (C) Forty-eight hours after transiently transfecting two independent ILF3-specific shRNAs into A375 cells, cell migration of A375 cells was determined by transwell migration assay. Scale bars, 100 µm. (D) Forty-eight hours after transiently transfecting two independent ILF3-specific shRNAs into A375 cells, cell invasion of A375 cells was determined by the transwell invasion assay. Scale bars, 100 µm. Results are presented as mean ± SD based on at least three independent experiments. **P<0.01; ***P<0.001 by one-way ANOVA. Abbreviation: EdU, ethynyl deoxyuridine. |
Depletion of ILF3 combined with ILF3-AS1 knockdown significantly suppresses melanoma proliferation, migration, and invasion
To investigate the biological significances of the positive interplay between ILF3 and ILF3-AS1, we repressed ILF3 in ILF3-AS1 stably depleted A375 cells via transiently transfecting ILF3-specific shRNAs. Glo cell viability assay displayed that the combination of ILF3-AS1 depletion and ILF3 knockdown more significantly decreased A375 cell viability (Figure 7A). EdU incorporation assay displayed that the combination of ILF3-AS1 depletion and ILF3 knockdown more significantly decreased the percentage of EdU-positive and proliferative cells (Figure 7B). Transwell migration assay displayed that the combination of ILF3-AS1 depletion and ILF3 knockdown more significantly decreased the number of migrated cells (Figure 7C). Transwell invasion assay displayed that the combination of ILF3-AS1 depletion and ILF3 knockdown more significantly reduced the number of invasive cells (Figure 7D). These results support the crucial roles of the positive interplay between ILF3 and ILF3-AS1 in melanoma and imply that targeting the ILF3/ILF3-AS1 feedback loop may significantly suppress melanoma.
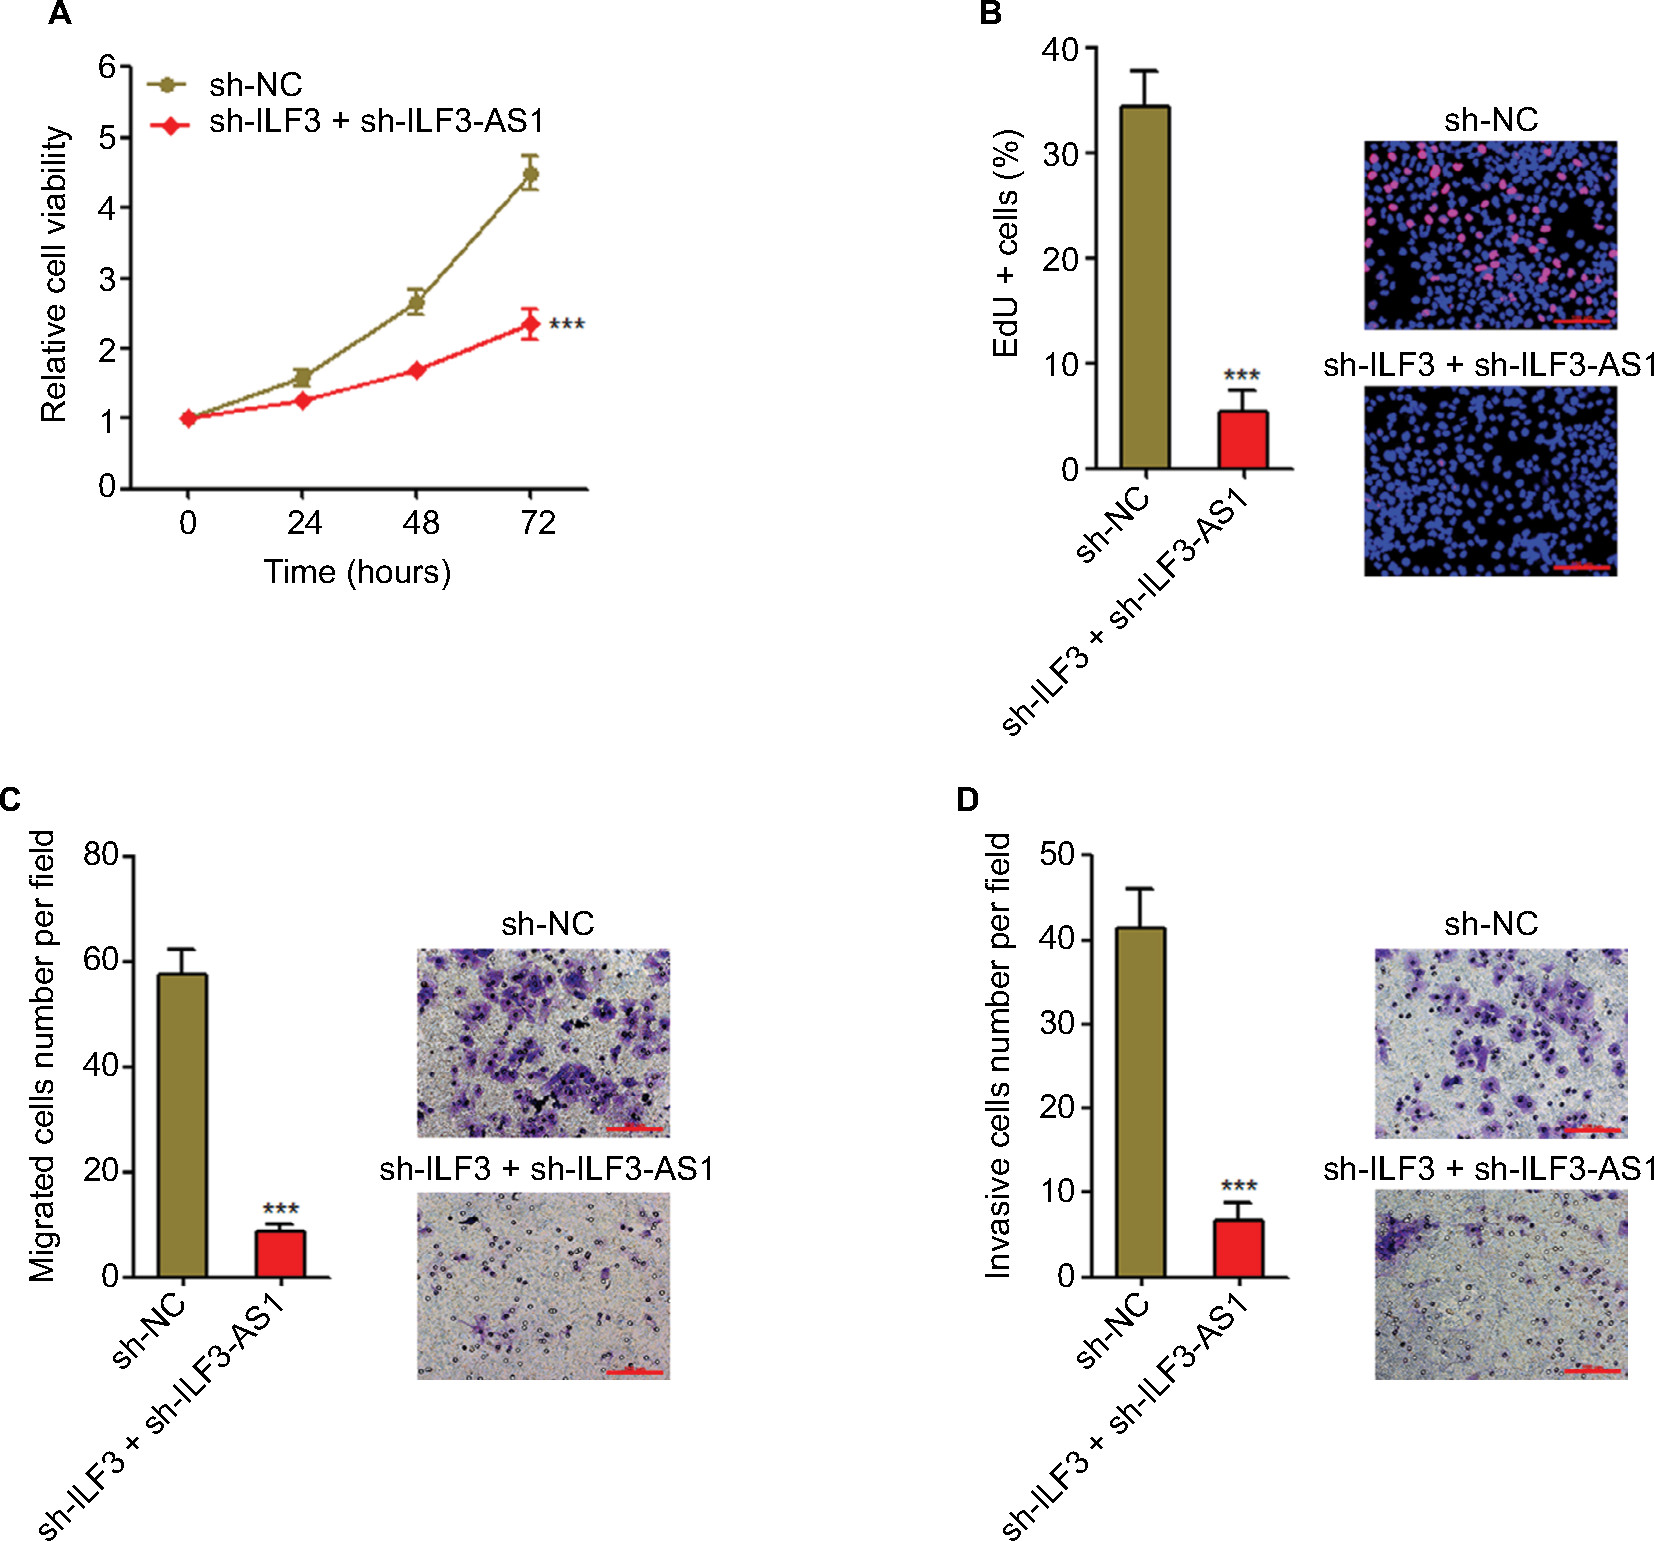 | Figure 7 The combination of ILF3 knockdown and ILF3-AS1 depletion significantly inhibits melanoma proliferation, migration, and invasion. Notes: (A) Twenty-four hours after transiently transfecting ILF3-specific shRNAs into ILF3-AS1 stably depleted A375 cells, cell viabilities were determined by the Glo cell viability assay. (B) Forty-eight hours after transiently transfecting ILF3-specific shRNAs into ILF3-AS1 stably depleted A375 cells, cell proliferation was determined by the EdU incorporation assay. The red color indicates EdU-positive nuclei. Scale bars, 100 µm. (C) Forty-eight hours after transiently transfecting ILF3-specific shRNAs into ILF3-AS1 stably depleted A375 cells, cell migration was determined by transwell migration assay. Scale bars, 100 µm. (D) Forty-eight hours after transiently transfecting ILF3-specific shRNAs into ILF3-AS1 stably depleted A375 cells, cell invasion was determined by the transwell invasion assay. Scale bars, 100 µm. Results are presented as mean ± SD based on at least three independent experiments. ***P<0.001 by Student’s t-test. Abbreviation: EdU, ethynyl deoxyuridine. |
Discussion
ILF3, also known as NF90, is a well-known RNA-binding protein.18–20,22 ILF3 is multifunctional in various cells via binding different RNA molecules and modulating various signaling pathways. For example, ILF3 is reported to bind and increase the stability of HIF-1α mRNA and, therefore, promotes tumor metastasis.27 ILF3 is also revealed to bind and increase the stability of vascular endothelial growth factor mRNA and, therefore, promotes the angiogenesis of colorectal cancer.20 Moreover, several lncRNAs are demonstrated to bind ILF3 and modulate the roles of ILF3, such as LincIN in breast cancer26 and lncRNA-LET in hepatocellular carcinoma.27 In this study, we demonstrated that except mRNAs, ILF3 also binds and increases the stability of ILF3-AS1 transcript. Although lncRNA-LET is reported to bind and induce ILF3 protein degradation,27 in this study, we found that ILF3-AS1 did not change ILF3 protein stability (data not shown). Thus, our data suggested that the binding between lncRNA and ILF3 may just regulate lncRNA transcript stability but not ILF3 protein stability. The different effects of the interaction between specific lncRNAs and ILF3 on lncRNAs and ILF3 may be dependent on the specific binding sites of lncRNAs and ILF3. These needs further investigation. Nevertheless, we found a reason for the upregulation of ILF3-AS1 in melanoma. Consistent with the regulation of ILF3-AS1 in melanoma,15 ILF3 is also increased in melanoma tissues and cell lines compared with benign nevi and epidermal melanocyte. Consistent with the oncogenic roles of ILF3-AS1 on melanoma proliferation, migration, and invasion,15 ILF3 also promotes melanoma proliferation, migration, and invasion. Conversely, ILF3 knockdown inhibits melanoma proliferation, migration, and invasion.
Intriguingly, although ILF3-AS1 did not regulate ILF3 protein stability, we found that ILF3-AS1 epigenetically activates ILF3 transcription. In our previous study, we found that ILF3-AS1 binds EZH2, increases the binding of EZH2 to the promoter of miR-200b/a/429, and represses miR-200b/a/429 expression.15 In this study, we further explored the effects of the interaction between ILF3-AS1 and EZH2 on ILF3. Conversely to the effects on miR-200b/a/429, ILF3-AS1 decreases the binding of EZH2 to the promoter of ILF3. EZH2 is a critical subunit of polycomb repressive complex 2, which induces histone methylation and heterochromatin formation.28 In this study, we found that ILF3-AS1 promotes euchromatin formation at the promoter of ILF3 via repressing the binding of EZH2 to ILF3 promoter. Therefore, ILF3-AS1 activates ILF3 transcription and expression, while ILF3-AS1 knockdown suppresses ILF3 transcription and expression. Thus, ILF3 and ILF3-AS1 form double-positive feedback loop, which further induces the upregulation of ILF3 and ILF3-AS1 in melanoma. Indeed, the expression of ILF3 and ILF3-AS1 are significantly positively correlated in melanoma tissues. Feedback loops could strengthen and amplify the robustness of gene regulatory networks in many pathophysiological processes, such as the NF90/NF110/DICER/miR-3173 feedback amplification loop in ovarian carcinoma,22 the HDAC4/Sp1/miR-200a regulatory loop in hepatocellular carcinoma,29 and the ZEB1-AS1/miR-200s/ZEB1 regulatory loop in osteosarcoma.30
In melanoma, we further verified the crucial biological roles of the ILF3/ILF3-AS1 feedback loop. Concurrent depletion of ILF3-AS1 and ILF3 more significantly represses melanoma proliferation, migration, and invasion, compared with the only depletion of ILF3-AS1 or ILF3.
Conclusion
We found that consistent with ILF3-AS1, ILF3 is also increased in melanoma tissues and cell lines. Increased expression of ILF3 predicts poor survival of melanoma patients. ILF3 directly binds ILF3-AS1, increases ILF3-AS1 transcript stability, and upregulates ILF3-AS1 transcript levels. ILF3-AS1 represses the binding of EZH2 to the promoter of ILF3, induces euchromatin formation at ILF3 promoter, and activates ILF3 transcription. Thus, ILF3 and ILF3-AS1 form positive feedback loop, which induces the upregulation of ILF3 and ILF3-AS1 in melanoma. The expression of ILF3-AS1 is significantly positively correlated with ILF3 in melanoma tissues. Functional assays revealed that overexpression of ILF3 promotes melanoma proliferation, migration, and invasion. Depletion of ILF3 inhibits melanoma proliferation, migration, and invasion. Moreover, concurrent depletion of ILF3 and ILF3-AS1 significantly suppresses melanoma proliferation, migration, and invasion. Taken together, we identified the positive feedback loop between ILF3 and ILF3-AS1 in melanoma and suggested that targeting this positive feedback loop may be promising therapeutic strategies for melanoma.
Disclosure
The authors report no conflicts of interest in this work.
References
Little EG, Eide MJ. Update on the current state of melanoma incidence. Dermatol Clin. 2012;30(3):355–361. | ||
Nikolaou VA, Stratigos AJ, Flaherty KT, Tsao H. Melanoma: new insights and new therapies. J Invest Dermatol. 2012;132(3 Pt 2):854–863. | ||
Agrawal P, Fontanals-Cirera B, Sokolova E, et al. A systems biology approach identifies FUT8 as a driver of melanoma metastasis. Cancer Cell. 2017;31(6):804–819.e7. | ||
Robertson AG, Shih J, Yau C, et al. Integrative analysis identifies four molecular and clinical subsets in uveal melanoma. Cancer Cell. 2017;32(2):204–220.e15. | ||
Schreuer M, Jansen Y, Planken S, et al. Combination of dabrafenib plus trametinib for BRAF and MEK inhibitor pretreated patients with advanced BRAFV600-mutant melanoma: an open-label, single arm, dual-centre, phase 2 clinical trial. Lancet Oncol. 2017;18(4):464–472. | ||
Dummer R, Schadendorf D, Ascierto PA, et al. Binimetinib versus dacarbazine in patients with advanced NRAS-mutant melanoma (NEMO): a multicentre, open-label, randomised, phase 3 trial. Lancet Oncol. 2017;18(4):435–445. | ||
Gilot D, Migault M, Bachelot L, et al. A non-coding function of TYRP1 mRNA promotes melanoma growth. Nat Cell Biol. 2017;19(11):1348–1357. | ||
Iyer MK, Niknafs YS, Malik R, et al. The landscape of long noncoding RNAs in the human transcriptome. Nat Genet. 2015;47(3):199–208. | ||
Leucci E, Coe EA, Marine JC, Vance KW. The emerging role of long non-coding RNAs in cutaneous melanoma. Pigment Cell Melanoma Res. 2016;29(6):619–626. | ||
Ponting CP, Oliver PL, Reik W. Evolution and functions of long noncoding RNAs. Cell. 2009;136(4):629–641. | ||
Yuan JH, Yang F, Wang F, et al. A long noncoding RNA activated by TGF-β promotes the invasion-metastasis cascade in hepatocellular carcinoma. Cancer Cell. 2014;25(5):666–681. | ||
Hosono Y, Niknafs YS, Prensner JR, et al. Oncogenic role of THOR, a conserved cancer/testis long non-coding RNA. Cell. 2017;171(7):1559–1572.e20. | ||
Leucci E, Vendramin R, Spinazzi M, et al. Melanoma addiction to the long non-coding RNA SAMMSON. Nature. 2016;531(7595):518–522. | ||
Schmidt K, Joyce CE, Buquicchio F, et al. The lncRNA SLNCR1 mediates melanoma invasion through a conserved SRA1-like region. Cell Rep. 2016;15(9):2025–2037. | ||
Chen X, Liu S, Zhao X, et al. Long noncoding RNA ILF3-AS1 promotes cell proliferation, migration, and invasion via negatively regulating miR-200b/a/429 in melanoma. Biosci Rep. 2017;37(6):BSR20171031. | ||
Chen X, Dong H, Liu S, et al. Long noncoding RNA MHENCR promotes melanoma progression via regulating miR-425/489-mediated PI3K-Akt pathway. Am J Transl Res. 2017;9(1):90–102. | ||
Chen X, Gao G, Liu S, et al. Long noncoding RNA PVT1 as a novel diagnostic biomarker and therapeutic target for melanoma. Biomed Res Int. 2017;2017:7038579. | ||
Higuchi T, Todaka H, Sugiyama Y, et al. Suppression of microRNA-7 (miR-7) biogenesis by nuclear factor 90-nuclear factor 45 complex (NF90-NF45) controls cell proliferation in hepatocellular carcinoma. J Biol Chem. 2016;291(40):21074–21084. | ||
Zhang W, Xiong Z, Wei T, et al. Nuclear factor 90 promotes angiogenesis by regulating HIF-1α/VEGF-A expression through the PI3K/Akt signaling pathway in human cervical cancer. Cell Death Dis. 2018;9(3):276. | ||
Zhou Q, Zhu Y, Wei X, et al. miR-590-5p inhibits colorectal cancer angiogenesis and metastasis by regulating nuclear factor 90/vascular endothelial growth factor A axis. Cell Death Dis. 2016;7(10):e2413. | ||
Zhuang J, Shen L, Yang L, et al. TGFβ1 promotes gemcitabine resistance through regulating the lncRNA-LET/NF90/miR-145 signaling axis in bladder cancer. Theranostics. 2017;7(12):3053–3067. | ||
Barbier J, Chen X, Sanchez G, et al. An NF90/NF110-mediated feedback amplification loop regulates dicer expression and controls ovarian carcinoma progression. Cell Res. 2018;28(5):556–571. | ||
Yuan JH, Liu XN, Wang TT, et al. The MBNL3 splicing factor promotes hepatocellular carcinoma by increasing PXN expression through the alternative splicing of lncRNA-PXN-AS1. Nat Cell Biol. 2017;19(7):820–832. | ||
Yu W, Gius D, Onyango P, et al. Epigenetic silencing of tumour suppressor gene p15 by its antisense RNA. Nature. 2008;451(7175):202–206. | ||
Zhu XT, Yuan JH, Zhu TT, Li YY, Cheng XY. Long noncoding RNA glypican 3 (GPC3) antisense transcript 1 promotes hepatocellular carcinoma progression via epigenetically activating GPC3. FEBS J. 2016;283(20):3739–3754. | ||
Jiang Z, Slater CM, Zhou Y, et al. LincIN, a novel NF90-binding long non-coding RNA, is overexpressed in advanced breast tumors and involved in metastasis. Breast Cancer Res. 2017;19(1):62. | ||
Yang F, Huo XS, Yuan SX, et al. Repression of the long noncoding RNA-LET by histone deacetylase 3 contributes to hypoxia-mediated metastasis. Mol Cell. 2013;49(6):1083–1096. | ||
Varambally S, Dhanasekaran SM, Zhou M, et al. The polycomb group protein EZH2 is involved in progression of prostate cancer. Nature. 2002;419(6907):624–629. | ||
Yuan JH, Yang F, Chen BF, et al. The histone deacetylase 4/SP1/microrna-200a regulatory network contributes to aberrant histone acetylation in hepatocellular carcinoma. Hepatology. 2011;54(6):2025–2035. | ||
Liu C, Pan C, Cai Y, Wang H. Interplay between long noncoding RNA ZEB1-AS1 and miR-200s regulates osteosarcoma cell proliferation and migration. J Cell Biochem. 2017;118(8):2250–2260. |
 © 2018 The Author(s). This work is published and licensed by Dove Medical Press Limited. The
full terms of this license are available at https://www.dovepress.com/terms
and incorporate the Creative Commons Attribution
- Non Commercial (unported, 3.0) License.
By accessing the work you hereby accept the Terms. Non-commercial uses of the work are permitted
without any further permission from Dove Medical Press Limited, provided the work is properly
attributed. For permission for commercial use of this work, please see paragraphs 4.2 and 5 of our Terms.
© 2018 The Author(s). This work is published and licensed by Dove Medical Press Limited. The
full terms of this license are available at https://www.dovepress.com/terms
and incorporate the Creative Commons Attribution
- Non Commercial (unported, 3.0) License.
By accessing the work you hereby accept the Terms. Non-commercial uses of the work are permitted
without any further permission from Dove Medical Press Limited, provided the work is properly
attributed. For permission for commercial use of this work, please see paragraphs 4.2 and 5 of our Terms.