Back to Journals » Clinical Ophthalmology » Volume 10
The measurement repeatability using different partition methods of intraretinal tomographic thickness maps in healthy human subjects
Authors Tan J, Yang Y, Jiang H ![]() , Liu C, Deng Z, Lam BL, Hu L, Oakley J, Wang J
, Liu C, Deng Z, Lam BL, Hu L, Oakley J, Wang J
Received 18 July 2016
Accepted for publication 16 August 2016
Published 29 November 2016 Volume 2016:10 Pages 2403—2415
DOI https://doi.org/10.2147/OPTH.S117494
Checked for plagiarism Yes
Review by Single anonymous peer review
Peer reviewer comments 2
Editor who approved publication: Dr Scott Fraser
Jia Tan,1,2,* Ye Yang,2,3,* Hong Jiang,2,4 Che Liu,2 Zhihong Deng,1,2 Byron L Lam,2 Liang Hu,3 Jonathan Oakley,5 Jianhua Wang2
1Department of Ophthalmology, Xiangya Hospital, Changsha, Hunan, People’s Republic of China; 2Bascom Palmer Eye Institute, University of Miami, Miami, FL, USA; 3School of Ophthalmology and Optometry, Wenzhou Medical University, Wenzhou, Zhejiang, People’s Republic of China; 4Department of Neurology, University of Miami, Miami, FL, 5Voxeleron LLC, Pleasanton, CA, USA
*These authors contributed equally to this work
Purpose: To determine the repeatability and profiles with different partition methods in intraretinal thickness layers in healthy human subjects, using optical coherence tomography (OCT).
Methods: A custom-built ultrahigh-resolution OCT was used to acquire three-dimensional volume of the macula in 20 healthy subjects. The dataset was acquired twice using the macular cube 512×128 protocol in an area of 6×6 mm2 centered on the fovea. Commercially available segmentation software (Orion™) was used to segment the dataset into thickness maps of six intraretinal layers. The coefficient of repeatability and intraclass coefficient of correlation (ICC) were analyzed using hemispheric zoning and sectors defined by the Early Treatment Diabetic Retinopathy Study (ETDRS).
Results: All datasets were successfully segmented to create six thickness maps of individual intraretinal layers. Coefficients of repeatabilities of these layers in hemispheric zones ranged from 0.9 to 6.6 µm, with an average of 3.6 µm (standard deviation [SD] 1.4), which was not significantly different compared to ETDRS sectors (P>0.05). ICCs of these layers in hemispheric zones ranged from 0.68 to 0.99, with an average of 0.91 (SD 0.07). There were no significant differences in ICCs between two zoning methods (P>0.05). Significant variations of tomographic intraretinal thicknesses were found between the inner and outer annuli and among the quadrantal sectors within the inner and outer annuli (P<0.05). Significant variations of the quadrantal sectors including both inner and outer annuli were evident in intraretinal layers (P<0.05) except for the outer plexiform layer.
Conclusion: The measurement repeatabilities of tomographic thicknesses of intraretinal layers are comparable using both hemispheric and ETDRS partitions in volumetric data combined with the commercially available segmentation software. In keeping with known, normal anatomical variation, significant differences in tomographic thickness in various intraretinal layers were apparent in both hemispheric and ETDRS sectors.
Keywords: intraretinal layer, thickness variation, tomography, healthy subject
Introduction
The retina is an extension of the brain, and the transparent ocular media facilitates direct inspection and measurement of its intraretinal layers. Optical coherence tomography (OCT) imaging has been widely used to study the neurodegeneration associated with ocular diseases such as age-related macular degeneration1 and in diseases of the central nervous system (CNS), such as Alzheimer’s disease,2 Parkinson’s disease,3 and multiple sclerosis.4–11 Atrophy of the peripapillary retinal nerve fiber layer (pRNFL) and/or the macular ganglion cell layer has been observed in these disorders. For CNS disorders, macular ganglion cell–inner plexiform layer (GCIPL) thickness has been shown to correlate better tomographically with central visual field defects, compared to pRNFL.12 Hence, GCIPL thickness may be a more important measure in studying CNS neurodegeneration and evaluating the efficacy of neuroprotective intervention. In addition to the GCIPL, other intraretinal layers such as inner nuclear layer (INL), outer nuclear layer (ONL), and outer plexiform layer (OPL) were found to be affected in conditions such as Parkinson’s disease13 and multiple sclerosis.6 Therefore, the imaging of intraretinal layers may provide additional information and facilitate a better understanding of the underlying disease mechanisms of these CNS pathologies that affect the anterior visual pathway.
OCT has improved since the modality was first introduced in 1991.14 The advancements have focused primarily on imaging speed and axial resolution. Commercially available OCT systems are able to capture high-resolution, three-dimensional (3D) volumes of the retina and its sublayers.15,16 The propriety software automatically measures the thickness of pRNFL15,16 and GCIPL in sectors defined by the Early Treatment Diabetic Retinopathy Study (ETDRS).15,17 The diagnostic value of these core measurements is well documented;16 yet, other intraretinal layers provided additional and complimentary information regarding the health of the retina.18 However, the analysis of intraretinal layers is not widely used, mainly due to the limitations of the commercially available image processing software. Also, hemispherical partition may be well suitable for evaluating localized alterations in the retina due to retrogeniculate disorders.12,19 However, the hemispherical partition of the retinal thickness layers is not widely available in commonly used OCT systems. Alternative intraretinal layer segmentation software, such as Orion™ (Voxeleron LLC, Pleasanton, CA, USA), can be used in conjunction with both commercial OCT devices and custom-developed OCT systems for more advanced analyses. The software may be an important tool for quantitatively analyzing tomographic intraretinal layers, possibly resulting in a better understanding of pathogenic processing of ocular and cerebral diseases. The goal of the present study was to determine the repeatability using hemispherical and ETDRS partitions in intraretinal thickness layers in healthy human subjects using OCT. We additionally looked at the characteristic profiles of layer thicknesses within and across the measurement zones.
Materials and methods
Subjects
Twenty normal healthy subjects (11 females and 9 males) were recruited. Their mean age was 36.2±10.0 years (range 25–55 years). One eye of each subject was imaged. No subjects had ocular or systemic diseases, or underwent intraocular surgery or laser treatment. None of them had refractive error exceeding −6.00 D or +3.00 D. The study was approved by the University of Miami Institutional Review Board. All of the subjects were treated in accordance with the tenets of the Declaration of Helsinki, and written informed consent was obtained from each subject.
Custom OCT (ultrahigh-resolution OCT)
A custom-built ultrahigh-resolution OCT (UHR-OCT) device with an axial resolution of ~3 μm was used to acquire the images of macula. This system has been described elsewhere in detail.20 Briefly, UHR-OCT was based on a spectrometer with a line scan camera running at 24,000 A-scans per second. A superluminescent diode with a center wavelength of 840 nm and a bandwidth of 100 nm was used as the light source. A light delivery system with an ocular lens (60 D; Volk Optical, Mentor, OH, USA) was adapted to a slit-lamp system to facilitate retinal imaging. A green dot generated by a miniature liquid crystal display screen provided an internal fixation target. OCT real-time imaging in both the horizontal and vertical medians was displayed to facilitate positioning the scan center on the fovea during prealignment period. The 3D volume of the macula was acquired twice using the macular cube 512×128 protocol (128 consecutive B-scans) in an area of 6×6 mm2 centered on the fovea. Each B-scan consisted of 1,365 (depth) × 512 (width) pixels. The scan depth was calibrated as 2.078 mm in air.
Macular cube acquisition and image analysis
All subjects were asked to sit in front of the slit lamp, on which the OCT probe was mounted, and look at the fixation light. After X- and Y-axes alignment view showed the fovea was centered, the macular cube volumes were acquired by raster scanning. The entire scan was acquired in approximately 2.7 seconds. Automatic software (Orion, ver. 2.0.6023; Voxeleron LLC) was used to segment the thickness maps of retinal layers (Figure 1) and process the thickness maps using hemispheric and the ETDRS partition definitions (Figure 2). The segmented layers of the macular cube included the total retinal thickness (TRT), retinal nerve fiber layer (RNFL), GCIPL, INL, OPL, ONL, and photoreceptor (PR) complex. Manual review of all segmentation results was performed by one analyzer (YY) to ensure the summary measurements were not affected by noticeable errors. No manual correction was performed. The coefficients of repeatability (CoRs) and intraclass coefficients of correlation (ICCs) were analyzed using the hemispheric and ETDRS partitions. The CoR was calculated as 1.96× the standard deviation (SD) of the difference between repeated measurements. Thickness variations among zones were analyzed using analysis of variance.
 | Figure 1 Cross-sectional retina and segmented tomographic thickness maps of intraretinal layers. |
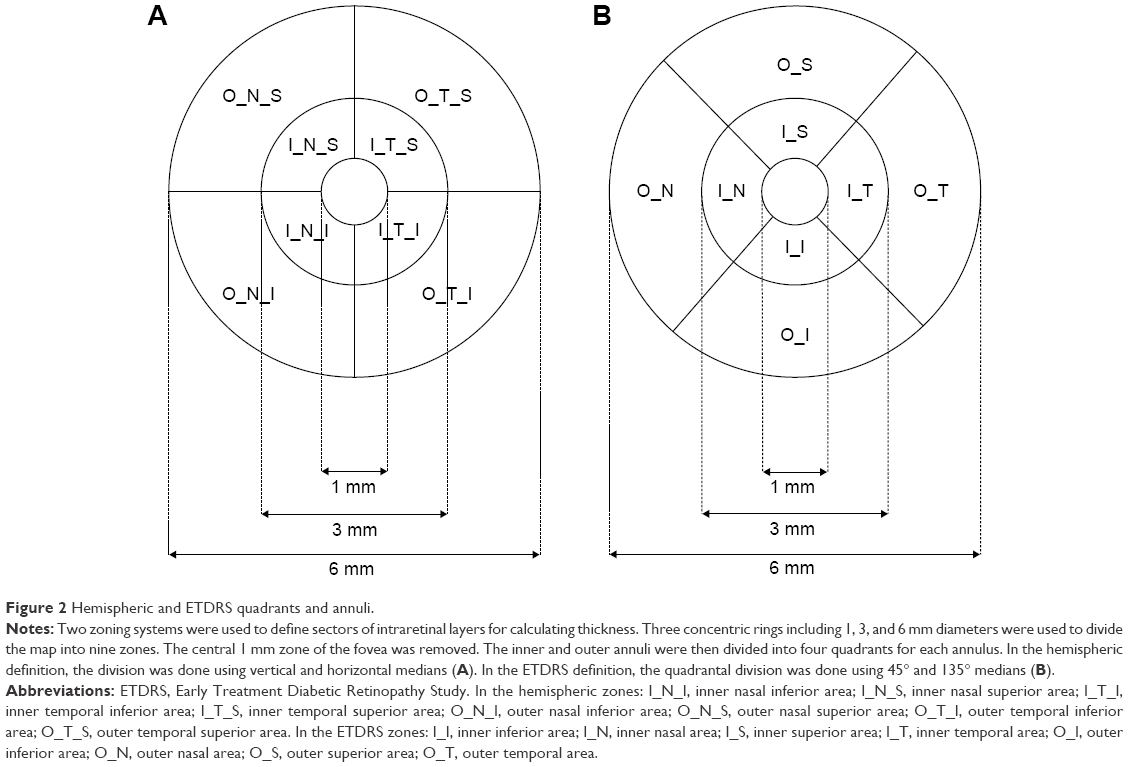 | Figure 2 Hemispheric and ETDRS quadrants and annuli. |
Results
All datasets were successfully segmented to create six thickness maps of individual intraretinal layers in addition to the map of TRT (Figure 3). The CoRs of these layers in hemispheric zones ranged from 0.9 to 6.6 μm, with an average of 3.6 μm (SD 1.4), which was not significantly different compared to those of ETDRS sectors (average 3.6 μm, SD 1.4, range 1.1–8.0 μm, P>0.05) (Figure 4). The CoRs showed excellent repeatabilities in RNFL, INL, OPL, ONL, and PR (CoR of each sector <6 μm) and fair repeatability in GCIPL and TRT (the worst sector ≥6 μm) between two measurements. ICCs of these layers in hemispheric zones ranged from 0.68 to 0.99, with an average of 0.91 (SD 0.07). There were no significant differences in ICCs between two different zoning methods (P>0.05) (Figure 5).
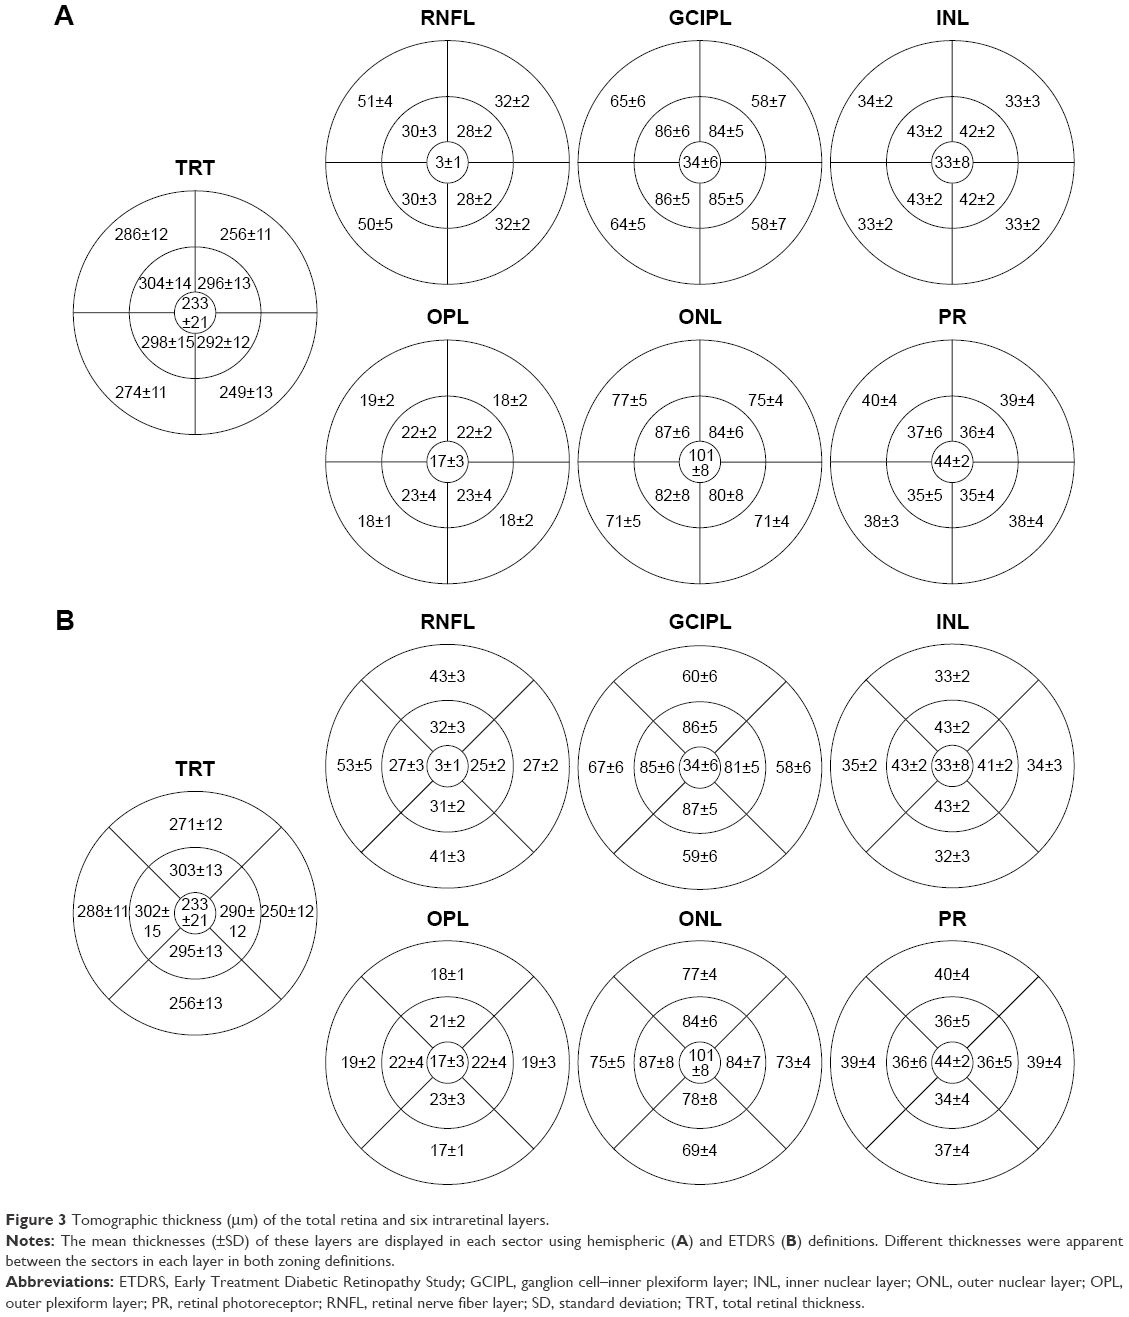 | Figure 3 Tomographic thickness (μm) of the total retina and six intraretinal layers. |
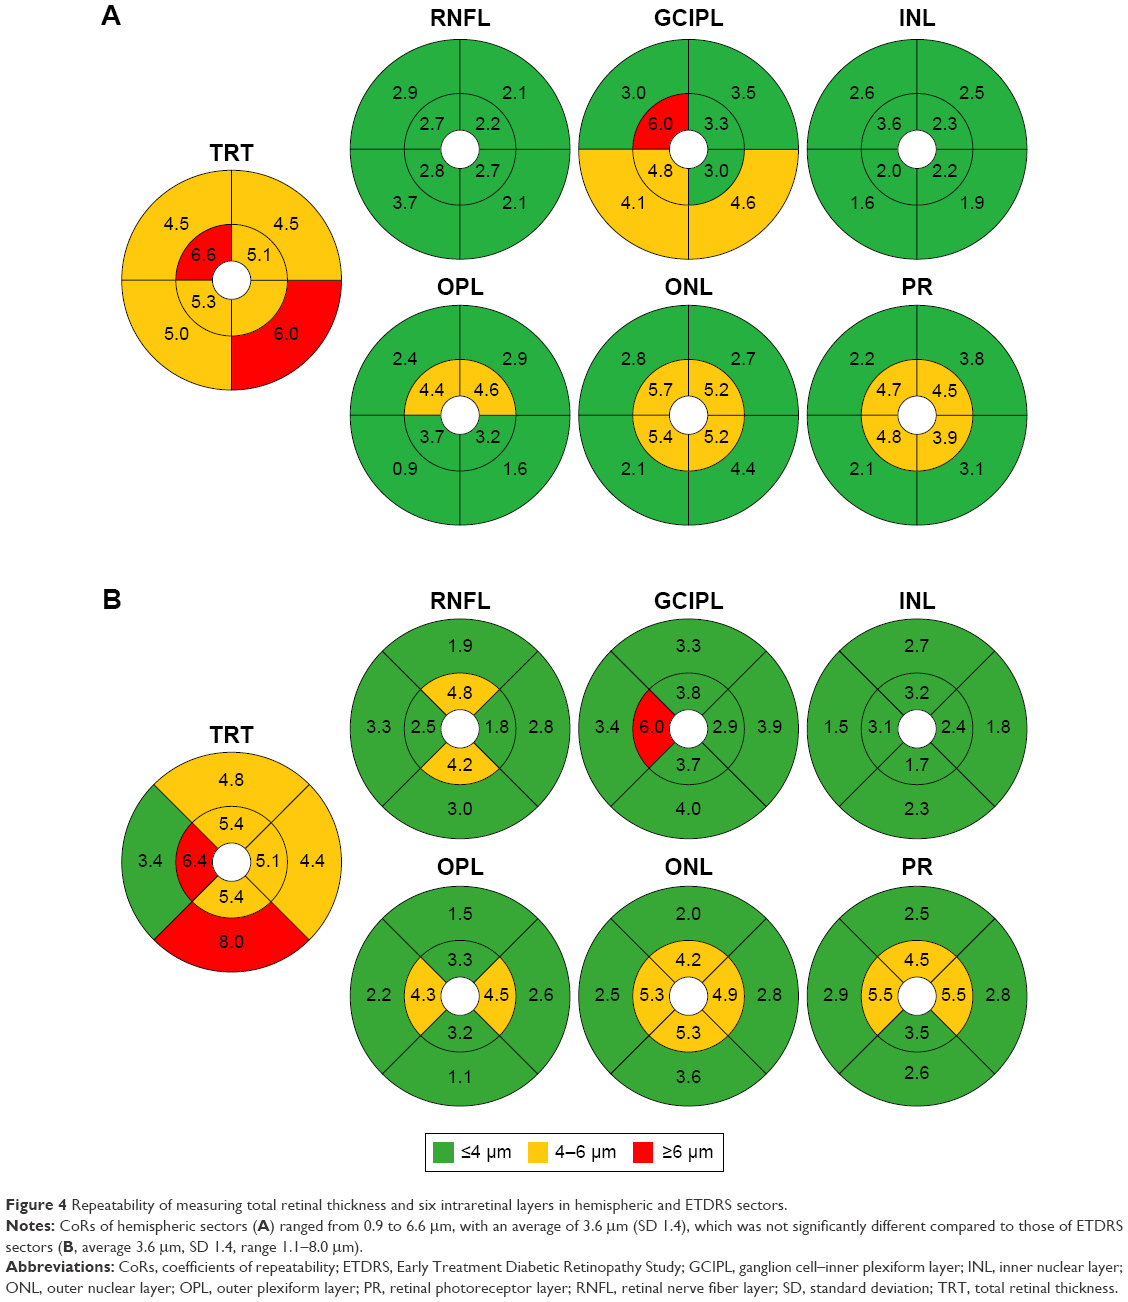 | Figure 4 Repeatability of measuring total retinal thickness and six intraretinal layers in hemispheric and ETDRS sectors. |
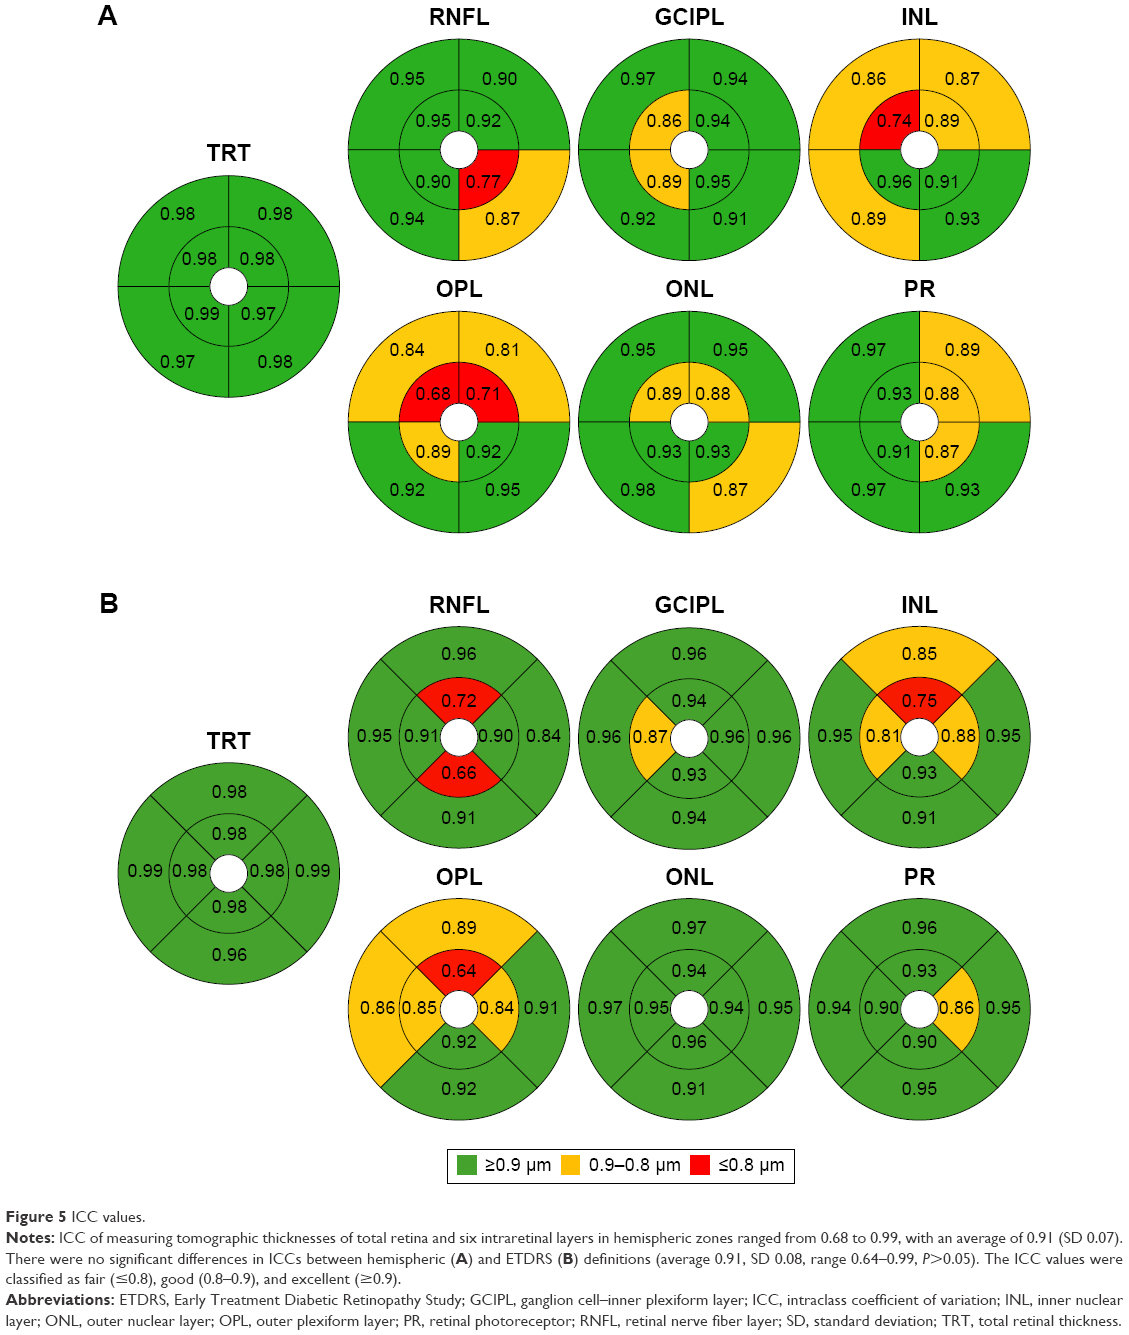 | Figure 5 ICC values. |
Significant variations of tomographic intraretinal thicknesses were found between inner and outer annuli and among quadrantal sectors within the inner and outer annuli (P<0.05) (Figure 6). The average thickness of the total retina and the intraretinal layers, except for RNFL and PR, in the inner annulus was greater than in the outer annulus (P<0.01) (Figure 7). Significant variations among quadrantal sectors including both inner and outer annuli were evident in intraretinal layers (P<0.05) except for OPL and PR (P>0.05) (Figure 8). Post hoc tests of the sectors summed from inner and outer annuli showed that thicknesses in nasal side including nasal, nasal superior, and nasal inferior sectors were significantly more than in temporal side including temporal, temporal superior, and temporal inferior sectors in total retina and intraretinal layers (P<0.05) except for OPL (P>0.05).
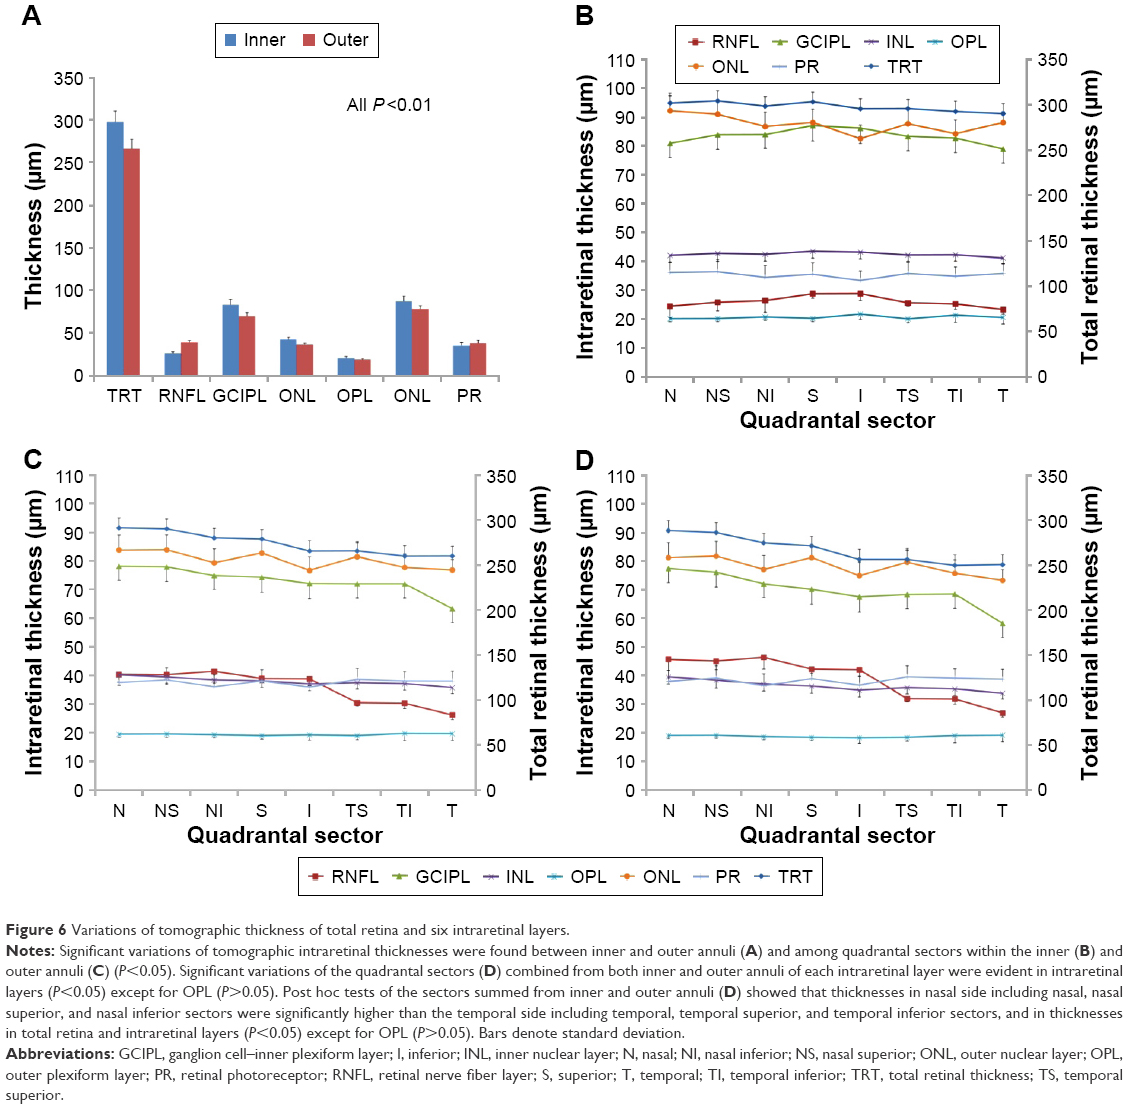 | Figure 6 Variations of tomographic thickness of total retina and six intraretinal layers. |
 | Figure 7 Tomographic thickness variations between annuli of the total retina and six segmented intraretinal layers. |
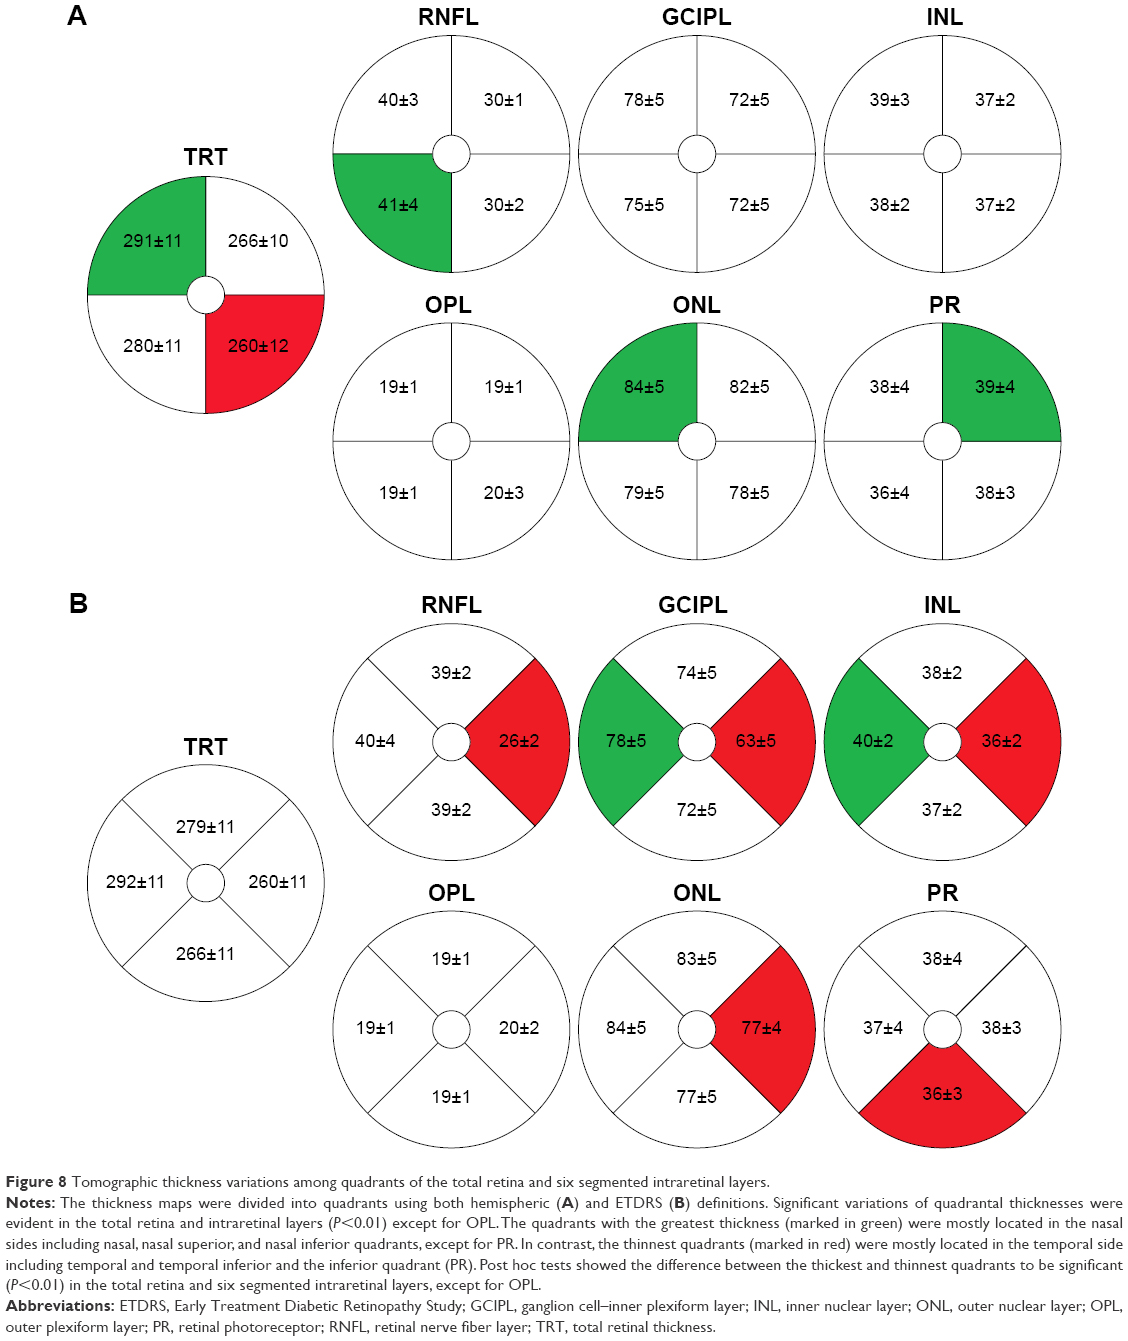 | Figure 8 Tomographic thickness variations among quadrants of the total retina and six segmented intraretinal layers. |
Discussion
OCT is widely used as a noninvasive diagnostic tool in the field of ophthalmology. With fine resolution, fast data acquisition, and good penetration (depending on wavelength), the layered structure of the retina can be resolved. Most commercial devices such as Cirrus HD-OCT™ (Carl Zeiss Meditec, Inc, Dublin, CA, USA), Heidelberg Spectralis OCT system (Heidelberg Engineering, Heidelberg, Germany), and RTVue OCT (Optovue, Inc, Fremont, CA, USA) share similar functionalities for acquiring volumetric data in a very short period of time.21,22 In addition, custom laboratory OCT devices, such as the one used in the present study and in other studies,23,24 can resolve equivalent or better intraretinal layers, given the better axial resolution. The details of multiple intraretinal layers can be clearly visualized in the cross-sectional images and attempts have been made to segment these layers in both two dimensions24–26 and three dimensions.27–30 Yet, these commercially available OCT devices generate automated thickness maps for only limited layers such as TRT and GCIPL thicknesses.21,31,32 The advances in automated and semiautomated segmentation have facilitated delineation of multiple intraretinal layers in three dimensions.27,29,30,33,34 However, with the exception of Orion, a software that automates the thickness mappings of six to eleven intraretinal layers is not commercially available. Orion has been previously applied in processing volumetric data obtained from a commercial device (Cirrus HD-OCT), segmenting in this case, the thickness maps of six retinal layers.29 The software was adapted to our custom OCT, prompting our need for testing the repeatability of the intraretinal thicknesses ahead of performing further clinical studies. This is especially important when the software was developed entirely independently of the acquisition hardware, as is the case with Orion. Testing the repeatability and characteristic profiles of these segmented layers will lay the necessary foundation for further study design, including, potentially, the creation of normative ranges.
Our tomographic thickness data obtained from our custom-made OCT with the implementation of Orion software are in agreement with the published data.31,32,34,35 Sull et al compared TRT in ETDRS partitions obtained with several commercial devices and found the results obtained with SD-OCT to be similar.21 Our results of TRT were within the ranges, compared to the results reported by others.21,25 The thickness maps for six intraretinal layers obtained in the present study in EDTRS sections were also similar to those reported in a previous study,22 with some mild disparities. This could, in part, be due to the definition of the boundaries where the thickness of a certain layer is calculated. For example, TRT can be defined as from the ILM to the inner/outer segment junction, retinal pigment epithelium (RPE), or to Bruch’s membrane.36 Given the lack of standardization and consensus among the devices, we may interpret our findings in the context of the existing literature. Compared with previous studies,35,37,38 the average thickness value of ONL was higher in the present study, while the thickness values of ONL and the inner segment of photoreceptors (IS) were similar to those in previous studies.37,39 Furthermore, the average thickness of PR was consistent with that of the outer segment of photoreceptors.22,38,39 Hu et al37 reported that the normal average thickness of ONL was 54 μm and that of IS was 26 μm. Demirkaya et al39 measured the thickness of ONL + IS, and the result (85±8 μm) was consistent with the values obtained in a previous study by Hu et al37 and in the present study (81±5 μm). These findings may possibly be because the ONL in the present study included ONL and IS, and PR might include the outer segment of photoreceptors. The thickness values of OPL layer in ETDRS sectors were lower than those in other studies,22,25,37,39 but similar to the value reported by Liu et al.35 Since the OCT used in the present study and by Liu et al are both custom-built systems with similar hardware configuration, similar results from healthy subjects may be expected. The remaining differences between the present study and other previous reports may also be simply due to the variation across normal subjects, imaging resolution, and algorithm differences. Further studies with larger sample size will establish more robust normative database for thickness maps of the intraretinal layers, and a common consensus of what needs to be measured will also be helpful.21,36
While the present study focused on the comparability of two partition methods in segmentation repeatability, analyzing the repeatability of each segmented intraretinal layer using different area partitions provides characteristic information about the measurement, which will be useful for determining the study sample size for future clinical studies. We reported the details of segmentation repeatability in annuli and sectors using two partition methods and found that they were comparable. In addition, the repeatabilities in annuli and section were comparable to those reported in previous studies.24,26,40,41 Oberwahrenbrock et al reviewed the reliability of intraretinal thickness measurements and estimated the ICCs and CoRs from previously published data.40 With semiautomated segmentation of 2D OCT images, very good ICCs and CoRs were evident for all intraretinal layers, except for OPL.40 Similar reliability of segmenting 2D intraretinal layers was documented in previous studies,24,41 in which manual segmentation or semiautomated segmentation was used on 2D OCT images. It may not, however, be feasible to use manual correction in volumetric data segmentation when a group of subjects is tested. Fully automated segmentation without supervision and manual correction was intentionally used in the present study, where we found by reviewing that the layers obtained with UHR-OCT can be measured reliably. The repeatability of the average thickness values of total macula and each intraretinal layer appeared to be much better than the results obtained with the time-domain OCT.26 The results we report in this study are similar to the published repeatability data using manual correction in 2D segmentation.24,40,41 Our results show that good repeatabilities are achievable for automated segmentation of most of intraretinal layers. However, segmentation validation against the ground truth may need to be further investigated. Also, further studies will be needed to test whether OCT with higher resolution, such as the one we used in the present study, yields higher repeatability than conventional OCT. Because two boundaries are needed to measure a given layer, we may also hypothesize segmentation accuracy for a single boundary. Current reports using laboratory segmentation approaches revealed that segmentation accuracy of 3–4 μm could be achieved in segmenting one boundary of these intraretinal layers.27,30,42 It may be reasonable to expect, therefore, that the thickness accuracy for a single layer could be larger; toward 8 μm. We found the averaged CoR in the represented study was ~4 μm for a layer with two boundaries, indicating excellent overall repeatability. Ahead of future clinical studies, it is also important to establish the intravisit variance for determining the application of OCT with difference partition methods. More detailed information can be obtained after subfield partition. Different software employ different methods for reporting, with the ETDRS grid being the most common43 and the hemispheric sectors being more appropriate for the loss resulting from CNS neurodegeneration.12,19 We tested both of these partitions in an attempt to better understand and characterize the thickness variation in the tomographic mappings. In the parafoveal area with hemispheric segmentation, thickness maps of the RNFL showed disparity in different quadrants. The RNFL was the thickest in the nasal quadrant of outer annuli and the thinnest in the temporal quadrant of outer annuli, which might be expected due to the known normal distribution of nerve fibers between the optic nerve head and macula. The GCIPL thickness was the greatest in the inferior sector of the inner annulus in our study. When counting the sector of both inner and outer annuli, the thickest GCIPL was located in the nasal side. This is in agreement with a previous report that the GCIPL was thicker in the nasal sector–based EDTRS division of the parafoveal retinal area.22 Our data may provide an alternative quantitative measurement which might reflect the intraretinal structural characterization. The different results might be explained by the difference in sample size, sex, and age. The thickness values of INL, OPL, and photoreceptor + retinal pigment epithelium were relatively uniform in all of the sectors of macula, while the thickness maps of the ONL showed a maximum value in the center of the fovea and a relatively high value in inner annulus subfield. This again might be due to the elongated cone photoreceptors in the normal fovea.22
Limitations
There were some limitations in this study. First, we only investigated normal subjects to demonstrate the imaging and segmentation capability and repeatability in order to establish a comparative reference for eyes with diseases. The repeatability and thickness variation in eyes with diseases will need to be further investigated. Second, the speed of UHR-OCT is not fast enough to reduce motion artifacts and we do not have eye tracking system, common to most commercial instrumentations, which may explain the relatively poor repeatability in some of the outer annulus or quadrants. We examined all volumetric datasets and found that the 6 mm diameter circle centered on the fovea would occasionally go outside the bounds of the acquired image data. It could, therefore, be speculated that the repeatability of measuring tomographic thickness of intraretinal layers can be improved by using eye tracking or high-speed OCT systems. Third, our sample size is small, although we were able to find significant thickness variations among the segmented intraretinal layers, which, to our understanding, likely characterize the normal structural variation. Future studies with larger sample sizes may further confirm these variations and perhaps facilitate the creation of a normative database. Fourth, we compared our results of TRT and tomographic thicknesses of intraretinal layers with published data and found that they were compatible. Future studies will be needed to directly compare the results obtained from our UHR-OCT with those obtained from commercial devices. Due to large data volume, it took about 7.5 seconds to process one volumetric dataset, which is slower compared to the processing of data from the Cirrus instrument, a direct result of the larger number of voxels in our data set (typically, the processing time is exponential with data size) and the increased number of layers that are reported. However, the processing speed remains faster than other custom software for segmenting multiple intraretinal layers and, therefore, more suitable to clinical applications.27,30,44 Fifth, the accuracy will need to be tested by comparing the segmented results to the ground truth using manual segmentation. Lastly, the system used in the present study is a custom-made OCT and there is no normative database available. This study may serve as a start point to generate normative thickness maps of intraretinal layers.
Conclusion
In summary, the measurement repeatabilities of tomographic thicknesses of intraretinal layers using both hemispheric and ETDRS partitions were comparable. Significant variations were apparent in tomographic thickness of intraretinal layers in both hemispheric and ETDRS sectors. Such characterization of tomographic thickness of intraretinal layers using OCT and automated segmentation in normal eyes is an important requisite step ahead of utilizing such techniques in diseased eyes and clinical studies.
Acknowledgments
This study was supported by research grants in part from the NANOS Pilot study, NIH Center Grant P30 EY014801, Research to Prevent Blindness (RPB), and Department of Defense (DOD-Grant#W81XWH-09–1–0675).
Disclosure
Jonathan Oakley is an employee of Voxeleron LLC, Pleasanton, CA, USA. The authors report no other conflicts of interest in this work.
References
Abdelfattah NS, Zhang H, Boyer DS, et al. Drusen Volume as a Predictor of Disease Progression in Patients With Late Age-Related Macular Degeneration in the Fellow Eye. Invest Ophthalmol Vis Sci. 2016;57(4):1839–1846. | ||
Parisi V, Restuccia R, Fattapposta F, Mina C, Bucci MG, Pierelli F. Morphological and functional retinal impairment in Alzheimer’s disease patients. Clin Neurophysiol. 2001;112(10):1860–1867. | ||
Sari ES, Koc R, Yazici A, Sahin G, Ermis SS. Ganglion cell-inner plexiform layer thickness in patients with Parkinson disease and association with disease severity and duration. J Neuroophthalmol. 2015;35(2):117–121. | ||
Saidha S, Sotirchos ES, Oh J, et al. Relationships between retinal axonal and neuronal measures and global central nervous system pathology in multiple sclerosis. JAMA Neurol. 2013;70(1):34–43. | ||
Saidha S, Calabresi PA. Optical coherence tomography should be part of the routine monitoring of patients with multiple sclerosis: yes. Mult Scler. 2014;20(10):1296–1298. | ||
Saidha S, Al-Louzi O, Ratchford JN, et al. Optical coherence tomography reflects brain atrophy in multiple sclerosis: A four-year study. Ann Neurol. 2015; 78(5):801–813. | ||
Petzold A, de Boer JF, Schippling S, et al. Optical coherence tomography in multiple sclerosis: a systematic review and meta-analysis. Lancet Neurol. 2010;9(9):921–932. | ||
Gordon-Lipkin E, Chodkowski B, Reich DS, et al. Retinal nerve fiber layer is associated with brain atrophy in multiple sclerosis. Neurology. 2007;69(16):1603–1609. | ||
Villoslada P, Sepulcre J, Toledo J, Bejarano B. Retinal nerve fiber layer is associated with brain atrophy in multiple sclerosis. Neurology. 2008;71(21):1747–1748. | ||
Pulicken M, Gordon-Lipkin E, Balcer LJ, Frohman E, Cutter G, Calabresi PA. Optical coherence tomography and disease subtype in multiple sclerosis. Neurology. 2007;69(22):2085–2092. | ||
Frohman EM, Fujimoto JG, Frohman TC, Calabresi PA, Cutter G, Balcer LJ. Optical coherence tomography: a window into the mechanisms of multiple sclerosis. Nat Clin Pract Neurol. 2008;4(12):664–675. | ||
Keller J, Sanchez-Dalmau BF, Villoslada P. Lesions in the posterior visual pathway promote trans-synaptic degeneration of retinal ganglion cells. PLoS One. 2014;9(5):e97444. | ||
Roth NM, Saidha S, Zimmermann H, et al. Photoreceptor layer thinning in idiopathic Parkinson’s disease. Mov Disord. 2014;29(9):1163–1170. | ||
Huang D, Swanson EA, Lin CP, et al. Optical coherence tomography. Science. 1991;254(5035):1178–1181. | ||
Gonzalez-Lopez JJ, Rebolleda G, Leal M, et al. Comparative diagnostic accuracy of ganglion cell-inner plexiform and retinal nerve fiber layer thickness measures by Cirrus and Spectralis optical coherence tomography in relapsing-remitting multiple sclerosis. Biomed Res Int. 2014;2014:128517. | ||
Leite MT, Rao HL, Zangwill LM, Weinreb RN, Medeiros FA. Comparison of the diagnostic accuracies of the Spectralis, Cirrus, and RTVue optical coherence tomography devices in glaucoma. Ophthalmology. 2011;118(7):1334–1339. | ||
Matlach J, Wagner M, Malzahn U, Gobel W. Repeatability of peripapillary retinal nerve fiber layer and inner retinal thickness among two spectral domain optical coherence tomography devices. Invest Ophthalmol Vis Sci. 2014;55(10):6536–6546. | ||
Pasadhika S, Fishman GA, Choi D, Shahidi M. Selective thinning of the perifoveal inner retina as an early sign of hydroxychloroquine retinal toxicity. Eye (Lond). 2010;24(5):756–762. | ||
Mitchell JR, Oliveira C, Tsiouris AJ, Dinkin MJ. Corresponding ganglion cell atrophy in patients with postgeniculate homonymous visual field loss. J Neuroophthalmol. 2015;35(4):353–359. | ||
Jiang H, Abukhalil F, Shen M, et al. Slit-lamp-adapted ultra-high resolution OCT for imaging the posterior segment of the eye. Ophthalmic Surg Lasers Imaging. 2012;43(1):76–81. | ||
Sull AC, Vuong LN, Price LL, et al. Comparison of spectral/Fourier domain optical coherence tomography instruments for assessment of normal macular thickness. Retina. 2010;30(2):235–245. | ||
Loduca AL, Zhang C, Zelkha R, Shahidi M. Thickness mapping of retinal layers by spectral-domain optical coherence tomography. Am J Ophthalmol. 2010;150(6):849–855. | ||
Srinivasan VJ, Monson BK, Wojtkowski M, et al. Characterization of outer retinal morphology with high-speed, ultrahigh-resolution optical coherence tomography. Invest Ophthalmol Vis Sci. 2008;49(4):1571–1579. | ||
Wang Y, Jiang H, Shen M, et al. Quantitative analysis of the intraretinal layers and optic nerve head using ultra-high resolution optical coherence tomography. J Biomed Opt. 2012;17(6):066013. | ||
Debuc DC, Salinas HM, Ranganathan S, et al. Improving image segmentation performance and quantitative analysis via a computer-aided grading methodology for optical coherence tomography retinal image analysis. J Biomed Opt. 2010;15(4):046015. | ||
DeBuc DC, Somfai GM, Ranganathan S, Tatrai E, Ferencz M, Puliafito CA. Reliability and reproducibility of macular segmentation using a custom-built optical coherence tomography retinal image analysis software. J Biomed Opt. 2009;14(6):064023. | ||
Tian J, Varga B, Somfai GM, Lee WH, Smiddy WE, Cabrera DD. Real-time automatic segmentation of optical coherence tomography volume data of the macular region. PLoS One. 2015;10(8):e0133908. | ||
Kafieh R, Rabbani H, Abramoff MD, Sonka M. Intra-retinal layer segmentation of 3D optical coherence tomography using coarse grained diffusion map. Med Image Anal. 2013;17(8):907–928. | ||
Keller J, Oakley JD, Russakoff DB, Andorra-Ingles M, Villoslada P, Sanchez-Dalmau BF. Changes in macular layers in the early course of non-arteritic ischaemic optic neuropathy. Graefes Arch Clin Exp Ophthalmol. 2015;254(3):561–567. | ||
Yang Q, Reisman CA, Wang Z, et al. Automated layer segmentation of macular OCT images using dual-scale gradient information. Opt Express. 2010;18(20):21293–21307. | ||
Bonnin S, Tadayoni R, Erginay A, Massin P, Dupas B. Correlation between ganglion cell layer thinning and poor visual function after resolution of diabetic macular edema. Invest Ophthalmol Vis Sci. 2015;56(2):978–982. | ||
Gella L, Raman R, Sharma T. Macular thickness measurements using Copernicus Spectral Domain Optical Coherence Tomography. Saudi J Ophthalmol. 2015;29(2):121–125. | ||
Niu S, Chen Q, de SL, Rubin DL, Zhang W, Liu Q. Automated retinal layers segmentation in SD-OCT images using dual-gradient and spatial correlation smoothness constraint. Comput Biol Med. 2014;54:116–128. | ||
Kafieh R, Rabbani H, Hajizadeh F, Abramoff MD, Sonka M. Thickness mapping of eleven retinal layers segmented using the diffusion maps method in normal eyes. J Ophthalmol. 2015;2015:259123. | ||
Liu X, Shen M, Yuan Y, et al. Macular thickness profiles of intraretinal layers in myopia evaluated by ultrahigh-resolution optical coherence tomography. Am J Ophthalmol. 2015;160(1):53–61. | ||
Bentaleb-Machkour Z, Jouffroy E, Rabilloud M, Grange JD, Kodjikian L. Comparison of central macular thickness measured by three OCT models and study of interoperator variability. ScientificWorldJournal. 2012;2012:842795. | ||
Hu Z, Wu X, Hariri A, Sadda SR. Multiple layer segmentation and analysis in three-dimensional spectral-domain optical coherence tomography volume scans. J Biomed Opt. 2013;18(7):76006. | ||
Ooto S, Hangai M, Tomidokoro A, et al. Effects of age, sex, and axial length on the three-dimensional profile of normal macular layer structures. Invest Ophthalmol Vis Sci. 2011;52(12):8769–8779. | ||
Demirkaya N, van Dijk HW, van Schuppen SM, et al. Effect of age on individual retinal layer thickness in normal eyes as measured with spectral-domain optical coherence tomography. Invest Ophthalmol Vis Sci. 2013;54(7):4934–4940. | ||
Oberwahrenbrock T, Weinhold M, Mikolajczak J, et al. Reliability of Intra-Retinal Layer Thickness Estimates. PLoS One. 2015;10(9):e0137316. | ||
Liu X, Shen M, Huang S, Leng L, Zhu D, Lu F. Repeatability and reproducibility of eight macular intra-retinal layer thicknesses determined by an automated segmentation algorithm using two SD-OCT instruments. PLoS One. 2014;9(2):e87996. | ||
Lang A, Carass A, Hauser M, et al. Retinal layer segmentation of macular OCT images using boundary classification. Biomed Opt Express. 2013;4(7):1133–1152. | ||
Early Treatment Diabetic Retinopathy Study design and baseline patient characteristics. ETDRS report number 7. Ophthalmology. 1991;98(5 Suppl):741–756. | ||
Lang A, Carass A, Swingle EK, et al. Automatic segmentation of microcystic macular edema in OCT. Biomed Opt Express. 2015;6(1):155–169. |
 © 2016 The Author(s). This work is published and licensed by Dove Medical Press Limited. The
full terms of this license are available at https://www.dovepress.com/terms
and incorporate the Creative Commons Attribution
- Non Commercial (unported, 3.0) License.
By accessing the work you hereby accept the Terms. Non-commercial uses of the work are permitted
without any further permission from Dove Medical Press Limited, provided the work is properly
attributed. For permission for commercial use of this work, please see paragraphs 4.2 and 5 of our Terms.
© 2016 The Author(s). This work is published and licensed by Dove Medical Press Limited. The
full terms of this license are available at https://www.dovepress.com/terms
and incorporate the Creative Commons Attribution
- Non Commercial (unported, 3.0) License.
By accessing the work you hereby accept the Terms. Non-commercial uses of the work are permitted
without any further permission from Dove Medical Press Limited, provided the work is properly
attributed. For permission for commercial use of this work, please see paragraphs 4.2 and 5 of our Terms.