Back to Journals » International Journal of Chronic Obstructive Pulmonary Disease » Volume 13
The likelihood of improving physical activity after pulmonary rehabilitation is increased in patients with COPD who have better exercise tolerance
Authors Osadnik CR ![]() , Loeckx M
, Loeckx M ![]() , Louvaris Z, Demeyer H, Langer D
, Louvaris Z, Demeyer H, Langer D ![]() , Rodrigues FM, Janssens W
, Rodrigues FM, Janssens W ![]() , Vogiatzis I
, Vogiatzis I ![]() , Troosters T
, Troosters T
Received 25 May 2018
Accepted for publication 22 August 2018
Published 24 October 2018 Volume 2018:13 Pages 3515—3527
DOI https://doi.org/10.2147/COPD.S174827
Checked for plagiarism Yes
Review by Single anonymous peer review
Peer reviewer comments 2
Editor who approved publication: Prof. Dr. Richard Russell
Video abstract presented by Christian R Osadnik and Matthias Loeckx
Views: 487
Christian R Osadnik,1–4,* Matthias Loeckx,1,5,6,* Zafeiris Louvaris,1,7 Heleen Demeyer,1,6 Daniel Langer,1,6 Fernanda M Rodrigues,1,6 Wim Janssens,6,8 Ioannis Vogiatzis,7,9 Thierry Troosters1,6
1Department of Rehabilitation Sciences, KU Leuven, Leuven, Belgium; 2Department of Physiotherapy, Monash University, Melbourne, Victoria, Australia; 3Monash Lung and Sleep, Monash Health, Melbourne, Victoria, Australia; 4Institute for Breathing and Sleep, Melbourne, Victoria, Australia; 5Department of Physiotherapy, LUNEX International University of Health, Exercise and Sports, Differdange, Luxembourg; 6Respiratory Division, University Hospitals, KU Leuven, Leuven, Belgium; 7Faculty of Physical Education and Sports Sciences, National and Kapodistrian University of Athens, Athens, Greece; 8Department of Chronic Disease, Metabolism and Aging, KU Leuven, Leuven, Belgium; 9Department of Sport, Exercise and Rehabilitation, Northumbria University Newcastle, Newcastle upon Tyne, UK
*These authors contributed equally to this work
Purpose: Pulmonary rehabilitation (PR) enhances exercise tolerance in patients with COPD; however, improvements in physical activity (PA) are not guaranteed. This study explored the relationship between baseline exercise tolerance and changes in PA after PR.
Materials and methods: Patient data from prospective clinical trials in the PR settings of Athens and Leuven (2008–2016) were analyzed. Validated PA monitors were worn for 1 week before and after a 12-week program. The proportion of patients who improved PA levels ≥1,000 steps/day (“PA responders”) after PR was compared between those with initial 6-minute walk distance [6MWDi] <350 m and ≥350 m. Baseline predictors of PA change were evaluated via univariate and multivariate logistic regression analyses.
Results: Two hundred thirty-six patients with COPD (median [IQR] FEV1 44 [33–59] % predicted, age 65±8 years, 6MWDi 416 [332–486] m) were included. The proportion of “PA responders” after PR was significantly greater in those with higher vs lower 6MWDi (37.9% vs 16.4%, respectively; P<0.001). 6MWDi group classification was the strongest baseline independent predictor of PA improvement (univariate OR 3.10, 95% CI 1.51–6.36).
Conclusion: The likelihood of improving PA after PR is increased with greater 6MWDi. Baseline exercise tolerance appears as an important stratification metric for future research in this field.
Keywords: exercise and pulmonary rehabilitation, COPD, physical activity, clinical respiratory medicine, responder analysis
Plain language summary
Why was the study done? Some people with COPD improve physical activity (PA) levels after pulmonary rehabilitation while others do not. We wanted to test whether we could better identify who would or would not respond in terms of their PA levels by looking at their baseline exercise tolerance levels.
What did the researchers do and find? We used a common threshold (350 m) for a 6-minute walk test to classify people as having low or high exercise tolerance and explored how well this related to PA responses. Those in the low group were very unlikely to improve PA, while some of those in the high group improved PA. Classifying patients according to this threshold proved a useful way to predict PA responses, especially when applied as a “rule-out” test.
What do these results mean? The 350 m threshold is a useful way to identify people who are not likely to improve PA after pulmonary rehabilitation. Attempts to improve PA levels should be targeted toward those with high baseline exercise tolerance, but additional factors are likely to influence the likelihood of achieving such gains.
Introduction
Deficits in exercise tolerance and physical activity (PA) are common features of COPD associated with increased risk of morbidity and mortality.1–3 Enhancement of exercise tolerance and PA is the primary goal of pulmonary rehabilitation (PR).4 While comprehensive PR is one of the most effective interventions to improve exercise tolerance in COPD,5 its impact on PA is less clear. Considerable interest surrounds the potential for PR to improve PA; however, clinical data demonstrate large heterogeneity regarding the magnitude and consistency of its effects in this patient group.6–9
Changes in PA may be underpinned by different mechanisms8,10 and may or may not occur in conjunction with improvements in exercise tolerance.9 For example, changes in PA levels have been previously shown to only weakly correlate with changes in exercise tolerance,9,11 while a recent systematic review demonstrated only small (effect size 0.12, n=7 studies) mean improvements in PA levels after exercise training.7 There is therefore a need to more closely examine the effects of PR on PA in specific COPD patient subgroups. Recent findings from a large international telecoaching program in patients with COPD suggest that larger changes in PA occur in those with more preserved baseline functional exercise tolerance.10 This is consistent with the concept of “functional reserve”:12,13 that those with high tolerance to exercise may have greater opportunity to be physically active within their tolerance limits (ie, high functional reserve), whereas those with low tolerance to exercise may be less capable of increasing PA levels due to an inhibitory ceiling limitation (ie, low functional reserve). Concurrent improvements in exercise tolerance would appear essential in this latter instance, while an absence of PA improvement in the former group could signify the presence of challenging behaviors potentially inhibiting PA adaptations, as has been previously suggested.14
Identification of patients with greater potential to improve PA is an important step to tailor future personalized PR approaches to the right individuals and optimize its potential modulating effects on PA. If exercise tolerance is to be a clinically useful stratification parameter for this purpose, it is important to explore the utility of an ideal “cutoff.” The 6-minute walk test (6MWT) is one of the most commonly used clinical tests for assessing exercise tolerance in the field of PR.15 The most widely used threshold for this test in patients with COPD is 350 m due to its well-recognized prognostic importance via the BODE index – a multidimensional composite index used to evaluate mortality risk in this patient group.16,17 The importance of this stratification metric for determining changes in PA after PR has not been determined. This study aimed to determine whether the likelihood of improving PA levels following PR is related to underlying exercise tolerance. We hypothesized that, in line with the functional reserve concept, patients with poorer initial exercise tolerance would be less likely to improve PA levels after PR than those with better initial exercise tolerance.
Materials and methods
Design
This study was a secondary, pooled analysis of data from five prospective, registered clinical trials conducted across University Hospital Gasthuisberg (Leuven, Belgium) and Sotiria and Evangelismos Hospitals (Athens, Greece) between December 2008 and June 2016. All patients provided written informed consent for their respective studies, and the present study was approved by the human ethics committee of University Hospital, Leuven (S60558). All patients with a confirmed clinical and spirometric diagnosis of COPD18 who completed PR and had available baseline and 3 month PA data were eligible for inclusion in this pooled analysis.
Procedure
Participants underwent detailed clinical assessments before and after PR, including lung function (spirometry, gas transfer, lung volumes), maximal respiratory pressures (maximal inspiratory pressure, maximal expiratory pressure), quadriceps muscle force (maximal voluntary contraction via Biodex [Leuven] and strain gauge [Athens]), quality of life (Chronic Respiratory Disease Questionnaire [CRDQ]), dyspnea (Medical Research Council [MRC] dyspnea scale), and exercise tolerance (6MWT and cycle ergometer cardiopulmonary exercise test [CPET]). The 6MWT was performed according to ATS/ERS standards15 on a quiet indoor walking track; however, the length differed between sites (50 m for Leuven, 30 m for Sotiria Hospital, and 18 m for Evangelismos Hospital). Participants were encouraged to walk as far as possible with close therapist supervision. The test was performed twice at the same site with best distance recorded. PA levels were monitored for 1 week before and after PR with one of the following activity monitors validated for patients with COPD (same monitor used pre- and post-PR for each individual): DynaPort MoveMonitor (DAM, McRoberts BV, The Hague, the Netherlands; n=57 at Leuven), Actigraph (ACT, ActiGraph LLC Pensacola, FL, USA; n=123 across Athens and Leuven), or SenseWear Pro Armband (BodyMedia version 6.0, Inc., Pittsburgh, PA, USA; n=56 at Leuven). Choice of monitor was determined by study protocol at each center. PA data were validated in accordance with the criteria proposed by Demeyer et al19 (≥4 week/days, ≥8 hours/day) and used to derive a weekly average steps/day. Hours of daylight were used as a proxy to account for seasonality effects that may alter opportunities to be physically active.20
The programs at each center comprised comprehensive, interdisciplinary PR that has been previously described.21–23 In brief, this comprises high-intensity whole body exercise training, strength training, lower and upper limb endurance training, and education. No specific cointerventions were provided to explicitly target improvements in PA levels. One included study (NCT00948623) had a PA counseling intervention arm; however, PA outcome data did not differ between groups. Another study (NCT02618746) had a home-based telerehabilitation intervention arm; however, randomization for this study commenced after the initial hospital-based PR. The site at Leuven conducted both cycle ergometry and treadmill walking training, while the sites in Athens implemented cycle ergometry only. Patients attended three sessions per week for 3 months (primary study endpoint), however were also invited to continue 2 days per week for three additional months (usual clinical care at these sites).
Analysis
Full clinical data to characterize the samples and evaluate responses to PR were collected using standardized extraction templates and inspected for normality via frequency histograms and Shapiro–Wilk statistic. Continuous variables were expressed as means with standard deviation (SD) when normally distributed or as medians [25th to 75th percentile] when non-normally distributed, unless stated otherwise. Demographic data and PR responses were compared between sites and mean initial 6-minute walk distance (6MWDi) was compared between both Athens centers to explore variability related to differing corridor lengths. The principal study analyses were conducted as one pooled cohort.
For the primary analysis, participants were categorized according to 6MWDi as having low (<350 m) or high (≥350 m) exercise tolerance. The proportion of patients who improved PA after PR was compared across the 6MWDi groups via chi-squared test according to two separate analyses defined according to the attainment or not of common clinical targets: (primary definition) ≥1,000 steps/day improvement (defined as the minimally important difference [MID])24 and (secondary definition) attainment of a “fairly active” level of PA (≥7,000 steps/day)25 after PR.
Pearson correlation coefficients were calculated to assess the association between changes in PA and both 6MWDi and 6MWD change. The magnitude of change in PA (mean steps/day) was compared between groups (6MWDi <350 m vs 6MWDi ≥350 m) via unpaired t-tests and represented via dot plot and XY coordinate arrow plot.
A “responder analysis” was conducted to identify differences in patient characteristics between PA “responders” and “nonresponders” after PR, based on the 1,000 steps/day PA change cutoff via unpaired t-tests or Mann–Whitney tests (for parametric or nonparametric data). Logistic regression analysis was performed to explore the usefulness of 6MWDi category as a predictor of “PA responder” status (yes/no). Baseline demographic factor variables hypothesized to potentially contribute to change in PA following PR (FEV1% predicted, functional residual capacity % predicted, quality of life, dyspnea level, quadriceps force, body mass index, and baseline PA level) were examined as potential covariates for this analysis in addition to fixed variables of PR site, PA monitor type, and change in hours of daylight from baseline to 3 months. Each factor was first entered into a univariate model, and in the absence of collinearity (comparable eigenvalues, variance inflation factor <10) those found to be significant (P≤0.20) were entered into a multivariate model. Receiver operator curve (ROC) analysis was conducted to ascertain the sensitivity and specificity of the 350 m 6MWDi cutoff to detect “PA responders” and estimate the area under the curve (AUC).
Sensitivity analyses were conducted to explore the robustness of findings related to the proportion of “PA responders.” This comprises repeat chi-squared analyses using a) the same 1,000 steps/day definition of a “PA responder” but CPET-derived measures of relative, weight-adjusted peak oxygen consumption; b) the lower and upper limits of the MID for PA change after PR (cutoffs of 600 and 1,100 steps/day, respectively); and c) exclusion of the top 5% extreme PA values (further details in Supplementary material). Mean change in PA was also compared across 6MWDi groups defined according to 6MWDi quartiles and evaluated via one-way ANOVA. Findings were compared between data expressed in “absolute” native units (steps/day) vs “relative” percent change from baseline due to uncertainty regarding the clinical importance of the latter approach. Statistical significance was denoted by P-values <0.05 for all analyses unless otherwise stated.
Results
Data were available from 241 patients upon completion of PR (152 Leuven, 89 Athens; Figure 1). Five patients were excluded (three from Leuven, two from Athens) due to PA data failing to meet validation criteria. Baseline characteristics of the 236 included participants are listed in Table 1. Small, but statistically significant differences were observed between participants of Leuven and Athens in terms of gender, body mass index, quality of life, lung function, and 6MWD. Participants were generally inactive at the start of PR (median [IQR] 3,920 [2,295–5,804] steps/day). No differences were observed in mean 6MWDi between participants of the Athens sites that used the 30 m (n=69) or 18 m (n=18) corridor lengths (P=0.740). PR was highly effective across a range of clinical outcomes (Table S1).
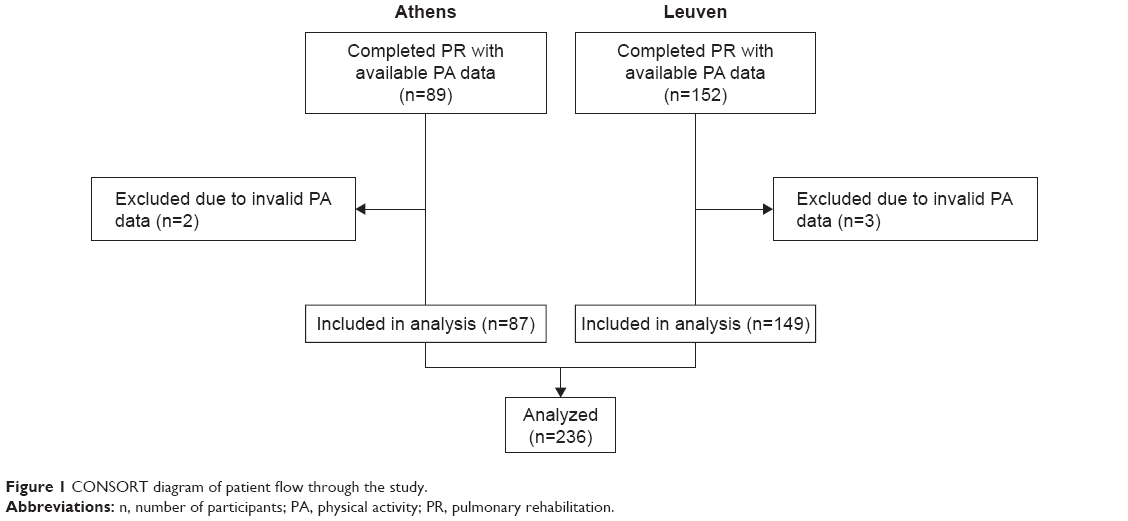 | Figure 1 CONSORT diagram of patient flow through the study. |
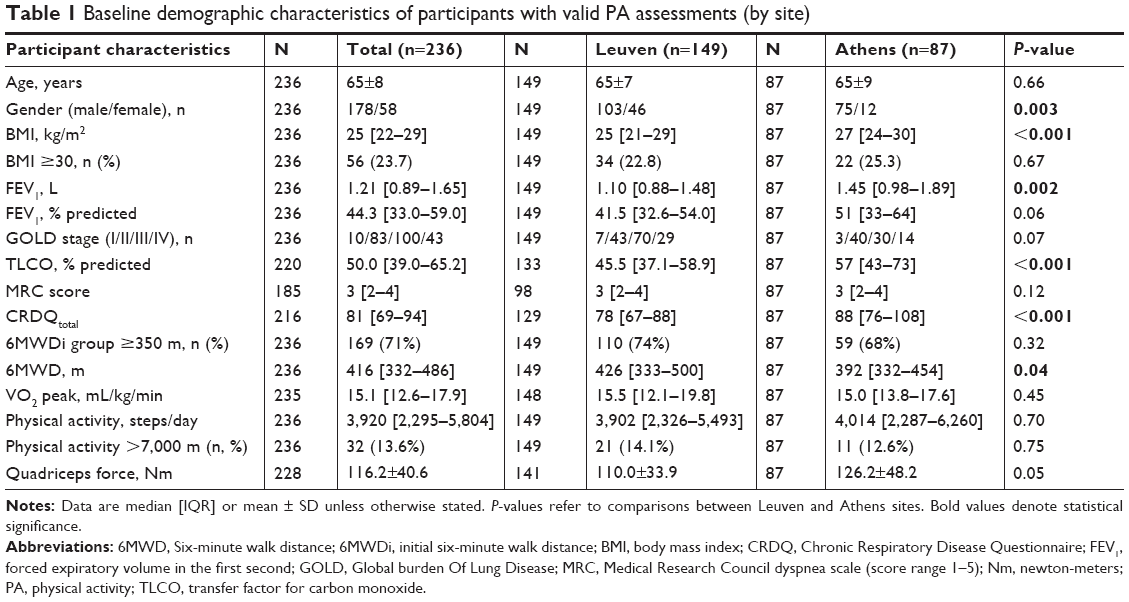 | Table 1 Baseline demographic characteristics of participants with valid PA assessments (by site) |
The proportion of “PA responders” (>1,000 steps/day change after PR) was significantly greater in those with 6MWDi ≥350 m compared with those with 6MWDi <350 m (37.9% vs 16.4%, respectively; P=0.001; Table 2; Figure 2). The proportion of patients deemed “fairly active (mean ≥7,000 steps/day)” at 3 months was also greater in patients with better 6MWDi (23.7% vs 4.5%, respectively; P=0.001). This represented a modest positive shift from baseline (17.2% vs 4.5%, respectively), with 58.1% of patients maintaining a “fairly active” status from baseline. The vast majority (91.2%) of the 204 patients deemed “fairly inactive (<7,000 steps/day)” at baseline remained “fairly inactive” at 3 months.
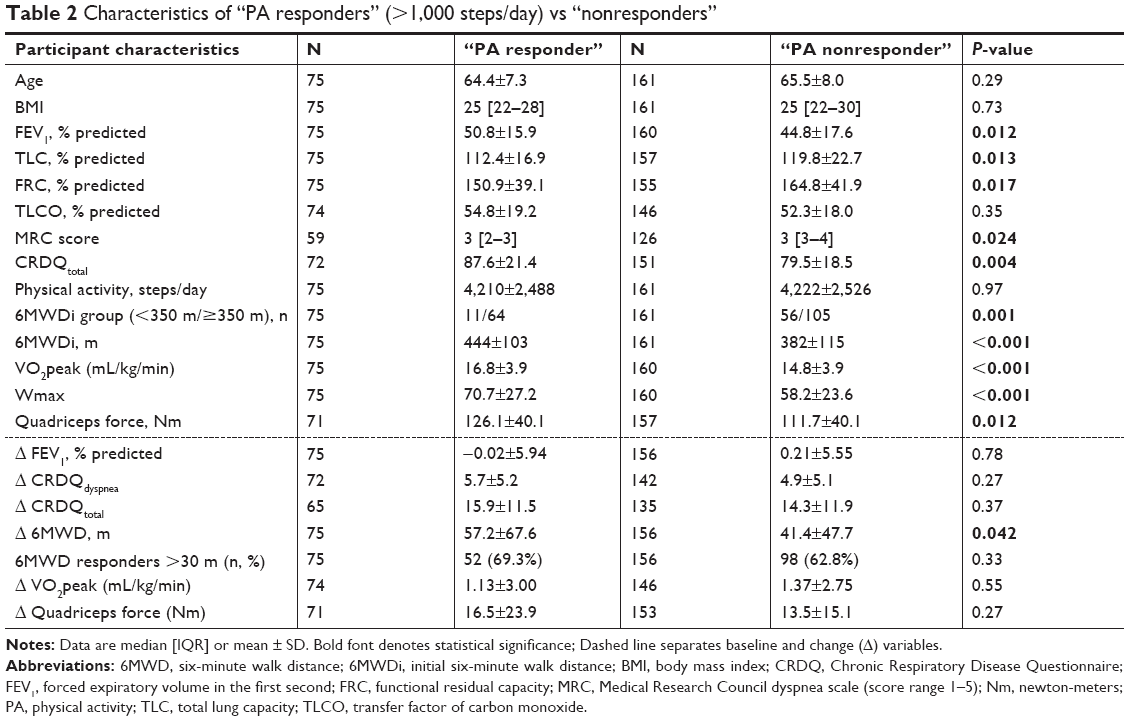 | Table 2 Characteristics of “PA responders” (>1,000 steps/day) vs “nonresponders” |
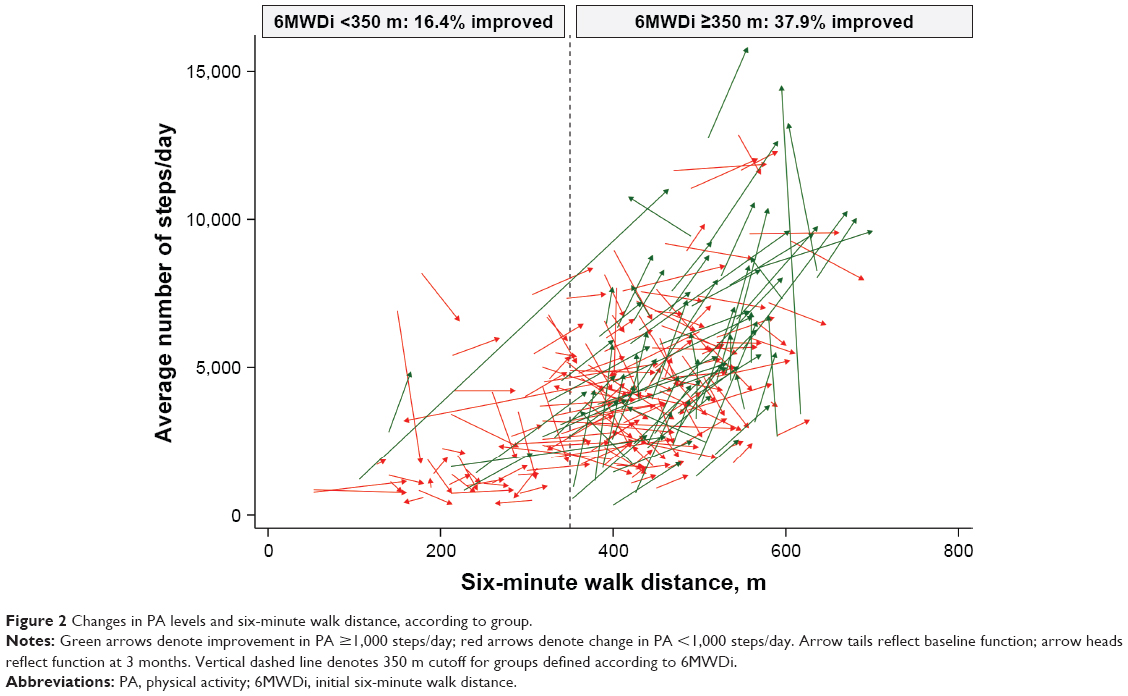 | Figure 2 Changes in PA levels and six-minute walk distance, according to group. |
Both 6MWDi and change in 6MWD correlated significantly but weakly with change in PA (r=0.205 and 0.217, respectively; Figures S1 and S2). Mean (SD) changes in PA levels from baseline to 3 months were small overall (551±1,770 steps/day; P<0.001). Mean (SD) magnitude of change in PA levels (mean steps/day) according to the low and high 6MWDi groups was 157 (1,694) and 707 (1,780), respectively (P=0.031 between-groups; Figure 3).
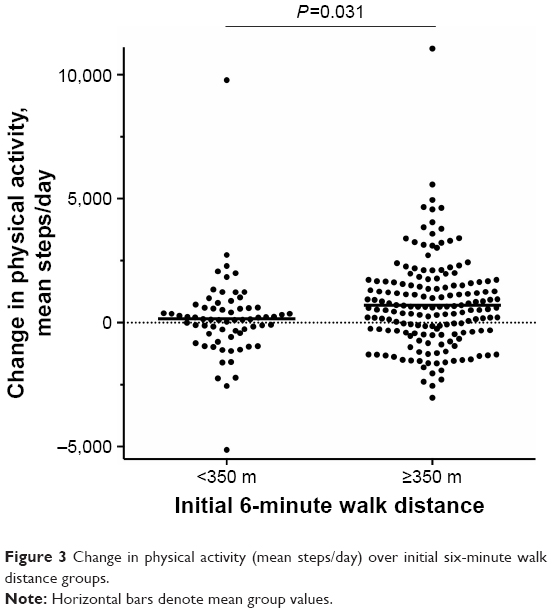 | Figure 3 Change in physical activity (mean steps/day) over initial six-minute walk distance groups. |
“PA responders” were found to have slightly better lung function, less dyspnea, better quality of life and more preserved exercise capacity (VO2peak), quadriceps muscle force, and 6MWT at baseline compared with “PA nonresponders” (P<0.05 for all; Table 2). The sole factor related to PR training responses that differed between these two groups was magnitude of improvement in 6MWD. While both groups experienced clinically relevant improvements in 6MWD, “PA responders” experienced 15.8 m more mean improvement than nonresponders (P=0.042).
Table 3 lists the findings of the logistic regression analysis. Multivariate analysis revealed 6MWDi group classification to be the only significant independent baseline predictor of PA improvement after PR, adjusted for change in daylight.
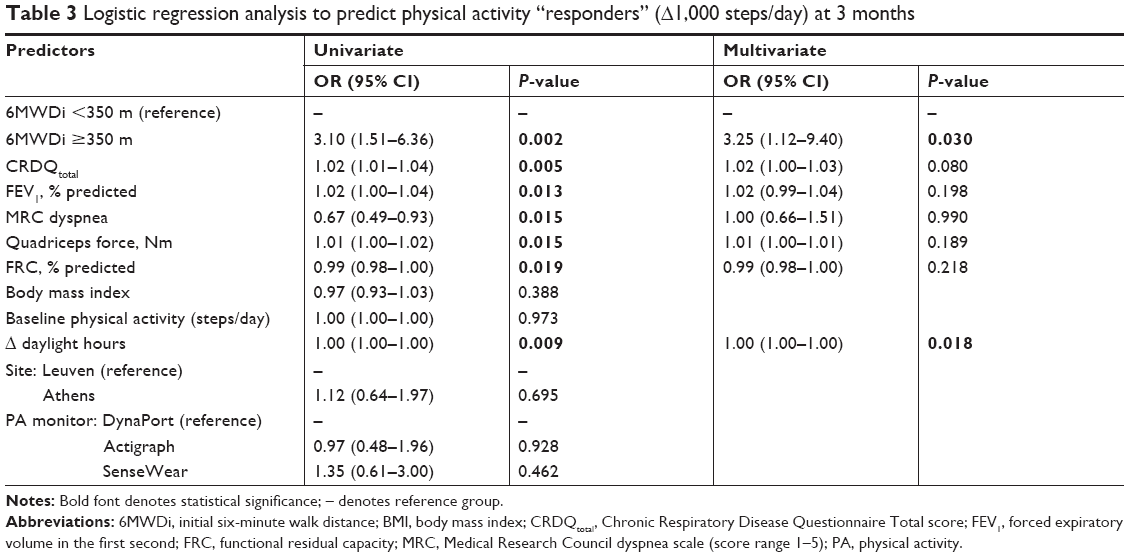 | Table 3 Logistic regression analysis to predict physical activity “responders” (Δ1,000 steps/day) at 3 months |
ROC analysis confirmed 350 m was a useful 6MWDi cutoff of high negative predictive value. Those with 6MWDi <350 m were highly unlikely to achieve gains in PA ≥1,000 steps/day (85.3% sensitivity). Specificity was, however, relatively low (34.8%), resulting in an AUC of 0.662 (Figure S3). Sensitivity analyses revealed similar findings to the principal analysis across the three exploratory comparisons. By contrast, findings were not replicable when data were expressed as percent change from baseline (Figures S4 and S5). Further details of the sensitivity analyses are given in the Supplementary material.
Discussion
Findings from this multicenter study conducted in two countries highlight that clinically important improvements in PA after PR are much (three-fold [OR {95% CI}=3.10 {1.51–6.36}]) more likely to occur in COPD patients with better preserved baseline exercise tolerance (6MWDi ≥350 m). The result appears consistent with CPET-derived measures of VO2peak (Supplementary material), and sensitivity analyses suggest that the phenomenon is quite robust across different PA change thresholds. Our data affirm the clinical relevance of the 350 m cutoff threshold, previously demonstrated for the outcome of mortality by work of our group17 and others,16 by highlighting its novel application as a useful “rule out” test to identify patients unlikely to experience meaningful increases in PA after PR (6MWDi <350 m, sensitivity 85%; Figure S3). It is interesting to observe that the small proportion of patients (13%) who improved PA after PR from this subgroup did so only in conjunction with quite dramatic changes in 6MWD (mean [SD] change in 6MWD in the 11 responders with low 6MWDi 128.4 [98.3] m). Attempts to enhance PA do not therefore appear to be the best focus of rehabilitation for these patients but may be considered a more appropriate long-term goal after exercise tolerance has been regained.
The higher likelihood of PA improvement in patients who entered PR with a more preserved exercise tolerance suggests this COPD subgroup may be a good target for tailored PA cointerventions during PR. The best adjunct therapy to achieve this aim is not yet clear, due in part to uncertainty regarding the precise factors that likely influence PA participation. For example, in addition to baseline exercise tolerance, it is reasonable to expect PA responses to be mediated by personal motivations, self-efficacy, and willingness to change. If patients are properly selected on the basis of preserved functional and/or peak exercise tolerance, one might speculate that interventions grounded in behavioral therapies could be appropriate.26 The provision of coaching-based interventions founded upon motivational principles but without self-monitoring and feedback has been shown to be insufficient to improve PA after PR.27 The addition of self-monitoring and goal setting with feedback, however, has been shown to be somewhat more effective, with one small study demonstrating mean improvements in the magnitude of 3,278 steps/day.28 Interestingly, this strategy was recently found to be unsuccessful in more symptomatic patients with poor exercise tolerance,29 which might be anticipated from our findings.
Our data concur with that of a recent large, multicenter international study from the PROactive consortium10 that found a 3-month semiautomated telecoaching intervention to be effective at changing PA. This study did not run concurrently with PR; however, exploratory post hoc analyses revealed patients with higher 6MWD, lower symptom score (mMRC), and those in Global burden Of Lung Disease (GOLD) A-B (vs C-D) at baseline achieved gains of a greater magnitude than those observed in the present rehabilitation study. Considered together, this suggests hidden potential for PR to positively influence PA in COPD subgroups defined according to baseline exercise tolerance. Comparisons of treatment effectiveness according to such parameters are currently rare. It is therefore plausible that potentially useful data regarding adjunct strategies applied during PR exist but remain concealed by a lack of stratification. The interaction between exercise tolerance and its ability to modulate PA responses during PR may shed new light on some of the early hypotheses that proposed such coexistent aims posed inherent “competing agendas.”30 As significant interest surrounds the identification of the best candidates for interventions targeting improvements in PA levels, we expect consideration of baseline exercise tolerance to feature prominently in future studies of this nature.
Limitations
The three PA monitors used in this pooled analysis have known differing accuracy to detect step counts in patients with COPD.31 Their combined use, however, was controlled for in the regression models without evident systematic bias (Table 3). Exploratory analysis of the principal outcome within individual PA monitor subgroups revealed a consistently lower proportion of responders to PR in patients with 6MWDi <350 m compared with those with 6MWDi ≥350 m; however, significance was only reached for the Actigraph, which had the most available data (n=123) compared with the DynaPort (n=52) and SenseWear (n=56). Our study also included sites where the 6MWT was performed on tracks of differing lengths. While site did not emerge as a significant predictor in the univariate logistic regression analysis, we do not advocate for the 6MWT to be conducted on shorter (<30 m) track lengths nor confirm that our findings should be expected to occur reliably if testing were conducted in such environments. Finally, the extent to which the factors investigated in this study relate to the maintenance phase following PR completion was not explored, meaning their relevance beyond the point of PR completion should be inferred with caution.
Conclusion
The likelihood of improving PA following PR is significantly higher in patients with COPD who have greater baseline functional exercise tolerance (≥350 m on 6MWT) compared with those with lower levels. Baseline 6MWDi status is a strong, independent predictor of change in PA after 3 months of PR. Enhancing PA may be an unrealistic goal in patients with poor exercise tolerance. Future studies seeking to improve PA in patients with COPD may benefit from targeting those with higher baseline exercise tolerance or stratifying analyses according to this important parameter.
Ethics
Ethics approval for the pooled analysis:
- University Hospital Leuven: S60558.
Ethics approval/clinical trial registrations for individual included studies:
- Physical Activity Counseling During Pulmonary Rehabilitation: S51491/NCT00948623
- Downhill Walking Training in COPD: S56364/NCT02113748
- Effects of Inspiratory Muscle Training in COPD: S52852/NCT01397396
- Pulmonary Rehabilitation Program and PROactive Tool: 18367/NCT02437994
- Home Rehabilitation Via Telemonitoring in Patients With COPD: 22964/NCT02618746.
Disclosure
CRO was the recipient of a European Respiratory Society fellowship, grant number LTRF 2014-3132. ZL was the recipient of a European Respiratory Society Fellowship, grant number LTRF 2016-6686 and is a postdoctoral fellow of the FWO-Flanders (Fellowship number 12U5618N). HD was the recipient of a joint ERS/SEPAR Fellowship (LTRF 2015-5099) and is a postdoctoral research fellow of the FWO-Flanders (12H7517N). FMR was supported by The National Council for Scientific and Technological Development (CNPq), Brazil (249579/2013-8). TT is supported by the Flemish Research Foundation (FondsWetenschappelijk Onderzoek), grant number FWO G·0871·13. The authors report no other conflicts of interest in this work.
References
Garcia-Aymerich J, Lange P, Benet M, Schnohr P, Antó JM. Regular physical activity reduces hospital admission and mortality in chronic obstructive pulmonary disease: a population based cohort study. Thorax. 2006;61(9):772–778. | ||
Oga T, Nishimura K, Tsukino M, Sato S, Hajiro T. Analysis of the factors related to mortality in chronic obstructive pulmonary disease: role of exercise capacity and health status. Am J Respir Crit Care Med. 2003;167(4):544–549. | ||
Waschki B, Kirsten AM, Holz O, et al. Disease progression and changes in physical activity in patients with chronic obstructive pulmonary disease. Am J Respir Crit Care Med. 2015;192(3):295–306. | ||
Spruit MA, Singh SJ, Garvey C, et al. An official American Thoracic Society/European Respiratory Society statement: key concepts and advances in pulmonary rehabilitation. Am J Respir Crit Care Med. 2013;188(8):e13–e64. | ||
Mccarthy B, Casey D, Devane D, Murphy K, Murphy E, Lacasse Y. Pulmonary rehabilitation for chronic obstructive pulmonary disease. Cochrane Database Syst Rev. 2015;2:CD003793. | ||
Lahham A, Mcdonald CF, Holland AE. Exercise training alone or with the addition of activity counseling improves physical activity levels in COPD: a systematic review and meta-analysis of randomized controlled trials. Int J Chron Obstruct Pulmon Dis. 2016;11:3121–3136. | ||
Cindy Ng LW, Mackney J, Jenkins S, Hill K. Does exercise training change physical activity in people with COPD? A systematic review and meta-analysis. Chron Respir Dis. 2012;9(1):17–26. | ||
Mantoani LC, Rubio N, Mckinstry B, Macnee W, Rabinovich RA. Interventions to modify physical activity in patients with COPD: a systematic review. Eur Respir J. 2016;48(1):69–81. | ||
Mesquita R, Meijer K, Pitta F, et al. Changes in physical activity and sedentary behaviour following pulmonary rehabilitation in patients with COPD. Respir Med. 2017;126:122–129. | ||
Demeyer H, Louvaris Z, Frei A, et al. Physical activity is increased by a 12-week semiautomated telecoaching programme in patients with COPD: a multicentre randomised controlled trial. Thorax. 2017;72(5):415–423. | ||
Zwerink M, van der Palen J, van der Valk P, Brusse-Keizer M, Effing T. Relationship between daily physical activity and exercise capacity in patients with COPD. Respir Med. 2013;107(2):242–248. | ||
Langer D, Demeyer H. Interventions to modify physical activity in patients with COPD: where do we go from here? Eur Respir J. 2016;48(1):14–17. | ||
Leidy NK. Functional status and the forward progress of merry-go-rounds: toward a coherent analytical framework. Nurs Res. 1994;43(4):196–202. | ||
Troosters T, Maltais F, Leidy N, et al. Effect of bronchodilation and exercise training with behavior modification on exercise tolerance and downstream effects on symptoms and physical activity in COPD. Am J Respir Crit Care Med. Epub 2018 Apr 17. | ||
Holland AE, Spruit MA, Troosters T, et al. An official European Respiratory Society/American Thoracic Society technical standard: field walking tests in chronic respiratory disease. Eur Respir J. 2014;44(6):1428–1446. | ||
Celli BR, Cote CG, Marin JM, et al. The body-mass index, airflow obstruction, dyspnea, and exercise capacity index in chronic obstructive pulmonary disease. N Engl J Med. 2004;350(10):1005–1012. | ||
Camillo CA, Langer D, Osadnik CR, et al. Survival after pulmonary rehabilitation in patients with COPD: impact of functional exercise capacity and its changes. Int J Chron Obstruct Pulmon Dis. 2016;11:2671–2679. | ||
Global Initiative for Chronic Obstructive Lung Disease (GOLD). Global Strategy for the Diagnosis, Management and Prevention of COPD; 2017. Available from: http://www.goldcopd.org/. Accessed 20 September, 2018. | ||
Demeyer H, Burtin C, van Remoortel H, et al. Standardizing the analysis of physical activity in patients with COPD following a pulmonary rehabilitation program. Chest. 2014;146(2):318–327. | ||
Sewell L, Singh SJ, Williams JE, Morgan MD. Seasonal variations affect physical activity and pulmonary rehabilitation outcomes. J Cardiopulm Rehabil Prev. 2010;30(5):329–333. | ||
Louvaris Z, Spetsioti S, Kortianou EA, et al. Interval training induces clinically meaningful effects in daily activity levels in COPD. Eur Respir J. 2016;48(2):567–570. | ||
Troosters T, Gosselink R, Decramer M. Short- and long-term effects of outpatient rehabilitation in patients with chronic obstructive pulmonary disease: a randomized trial. Am J Med. 2000;109(3):207–212. | ||
Vogiatzis I, Nanas S, Roussos C. Interval training as an alternative modality to continuous exercise in patients with COPD. Eur Respir J. 2002;20(1):12–19. | ||
Demeyer H, Burtin C, Hornikx M, et al. The minimal important difference in physical activity in patients with COPD. PLoS One. 2016;11(4):e0154587. | ||
Tudor-Locke C, Craig CL, Aoyagi Y, et al. How many steps/day are enough? For older adults and special populations. Int J Behav Nutr Phys Act. 2011;8:80. | ||
Michie S, Richardson M, Johnston M, et al. The behavior change technique taxonomy (v1) of 93 hierarchically clustered techniques: building an international consensus for the reporting of behavior change interventions. Ann Behav Med. 2013;46(1):81–95. | ||
Burtin C, Langer D, van Remoortel H, et al. Physical activity counselling during pulmonary rehabilitation in patients with COPD: a randomised controlled trial. PLoS One. 2015;10(12):e0144989. | ||
Cruz J, Brooks D, Marques A. Walk2Bactive: A randomised controlled trial of a physical activity-focused behavioural intervention beyond pulmonary rehabilitation in chronic obstructive pulmonary disease. Chron Respir Dis. 2016;13(1):57–66. | ||
Nolan CM, Maddocks M, Canavan JL, et al. Pedometer step count targets during pulmonary rehabilitation in COPD: a randomized controlled trial. Am J Respir Crit Care Med. 2017;195(10):1344–1352. | ||
Singh S. Physical activity and pulmonary rehabilitation – a competing agenda? Chron Respir Dis. 2014;11(4):187–189. | ||
Langer D, Gosselink R, Sena R, Burtin C, Decramer M, Troosters T. Validation of two activity monitors in patients with COPD. Thorax. 2009;64(7):641–642. |
Supplementary materials
Sensitivity analyses
For the purpose of sensitivity analysis, chi-squared analyses were repeated for the primary outcome using 1) the same 1,000 steps/day definition of a physical activity (PA) responder but cardiopulmonary exercise test (CPET)-derived measures of relative peak oxygen consumption (VO2peak adjusted for weight) instead of initial 6-minute walk distance (6MWDi) (groups defined by cutoff at the 28th percentile – corresponding to the proportions obtained via 6MWDi); 2) the lower and upper limits of the minimally important difference [MID] for PA change after pulmonary rehabilitation (PR) (cutoffs of 600 and 1,100 steps/day, respectively); and 3) exclusion of the top 5% extreme PA values. Mean change in PA was also compared across groups defined according to 6MWDi quartiles and evaluated via one-way ANOVA.
In line with findings of the 6MWDi, 16.7% of patients with a low baseline weight-adjusted VO2peak (<13.042 mL/min/kg, derived from maximal incremental cycle CPET [corresponding to the 28th percentile of 6MWDi]), achieved an improvement of ≥1,000 steps/day compared with 37.9% of patients who had a more preserved baseline VO2peak (P=0.002). This pattern was weaker when VO2peak was expressed in absolute units (28th percentile corresponding to <0.930 L/min), with the proportion of responders being 27.3% vs 33.7% for the low and high groups, respectively (P=0.34).
The proportion of patients who improved PA by the suggested lower (600 steps/day) and upper limit (1,100 steps/day) of the MID in PA at 3 months increased significantly with increased 6MWDi (respectively, 25.4% vs 50.9% for 6MWDi <350 m; P<0.001 and 4.9% vs 36.1% for 6MWDi ≥350 m; P=0.001).
The sensitivity analysis relating to the exclusion of the top 5% outlying PA data resulted in proportions of responders in the 6MWDi <350 m vs 6MWDi ≥350 m of 16% and 35%, respectively (P=0.005).
The mean [SD] magnitude of change in PA (steps/day) across the groups defined according to 6MWDi quartiles increased significantly with increasing 6MWDi (99 [1,750], 336 [1,468], 525 [1,444], 1,245 [2,152] for Q1–4, respectively; P=0.003). In contrast to the principal analysis, when PA change was expressed as a percentage change from baseline, no significant differences were observed in the magnitude of PA change across either the two 6MWDi groups (18.3 [109], 31.4 [78.7] for <350 m and ≥350 m groups; P=0.306) or the groups defined according to 6MWDi quartiles (17.9 [114.8], 37.2 [104.7], 23.7 [58.6], 32.2 [61.1] for Q1–4, respectively; P=0.642; Figures S4 and S5). All chi-squared analyses conducted using different thresholds of relative PA improvement (10%, 15%, 20% change from baseline) for the two 6MWDi groups were nonsignificant.
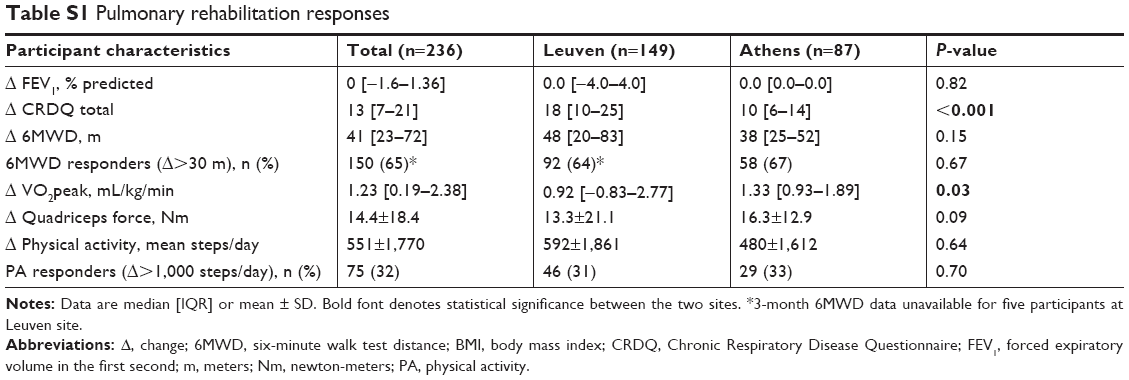 | Table S1 Pulmonary rehabilitation responses |
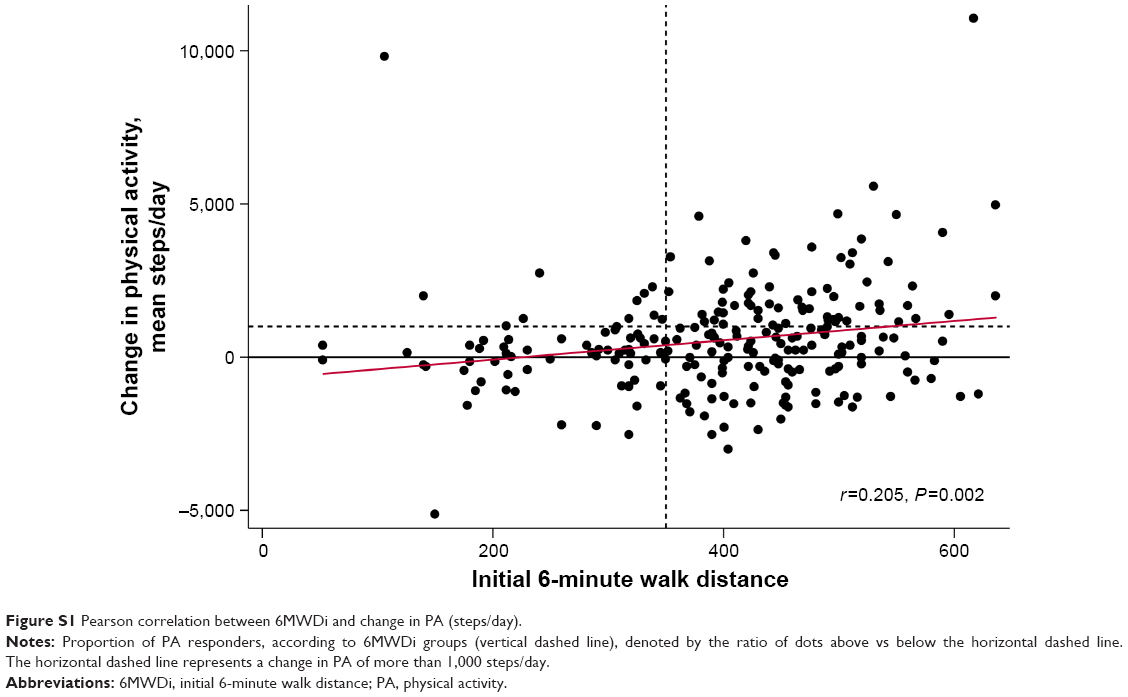 | Figure S1 Pearson correlation between 6MWDi and change in PA (steps/day). |
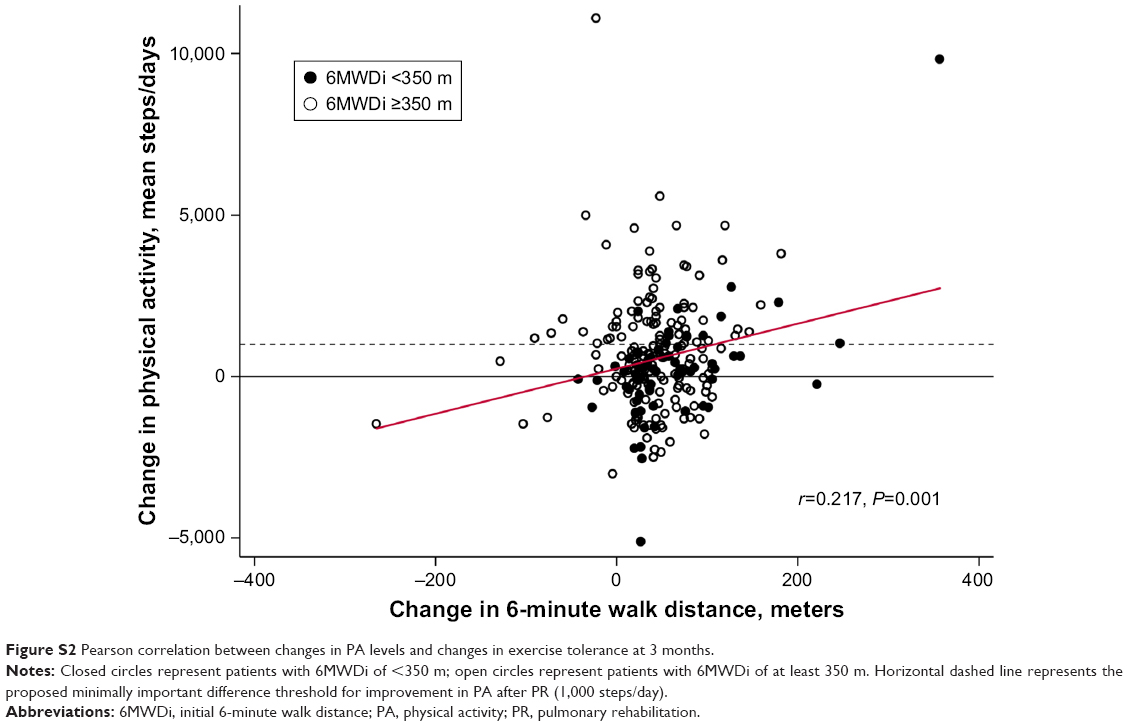 | Figure S2 Pearson correlation between changes in PA levels and changes in exercise tolerance at 3 months. |
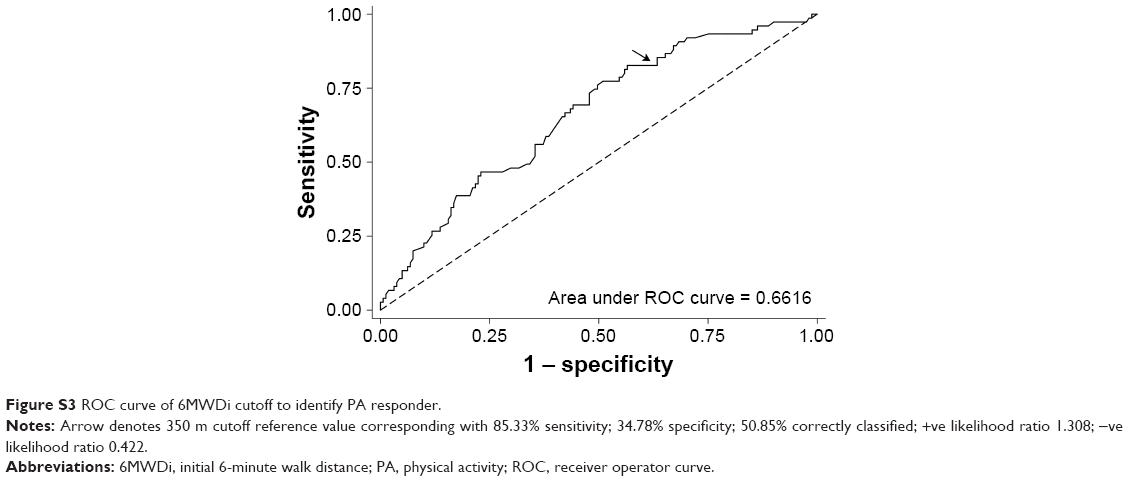 | Figure S3 ROC curve of 6MWDi cutoff to identify PA responder. |
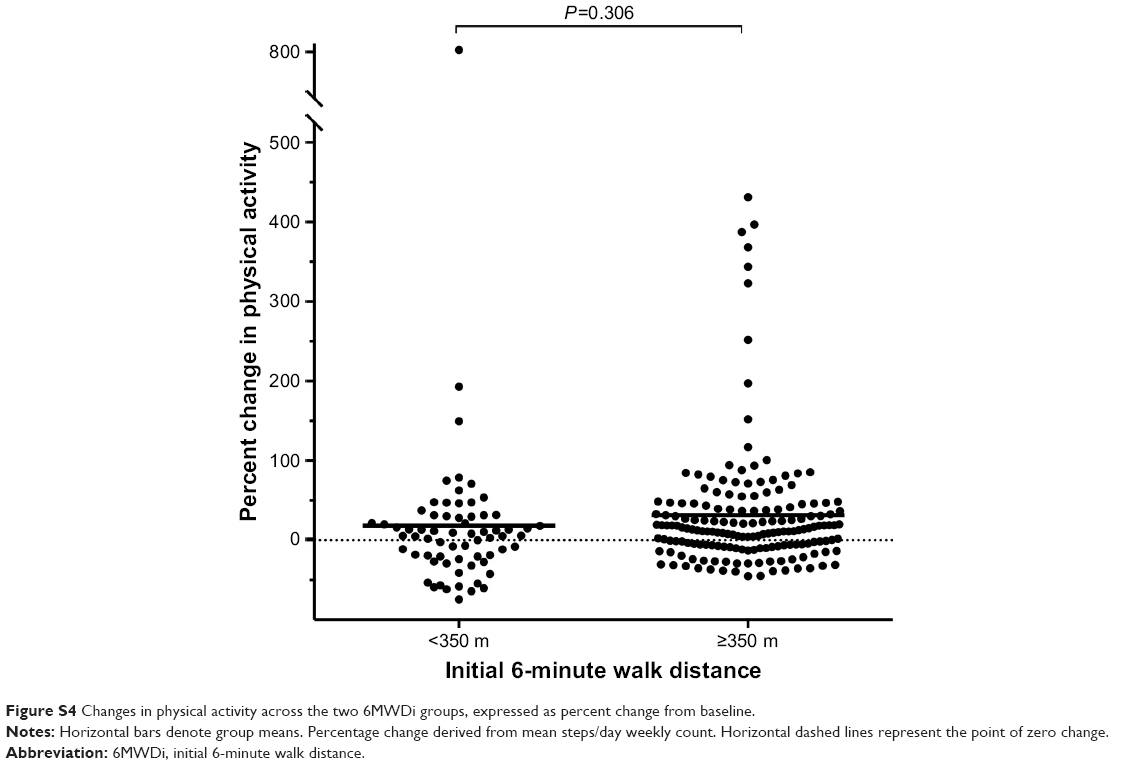 | Figure S4 Changes in physical activity across the two 6MWDi groups, expressed as percent change from baseline. |
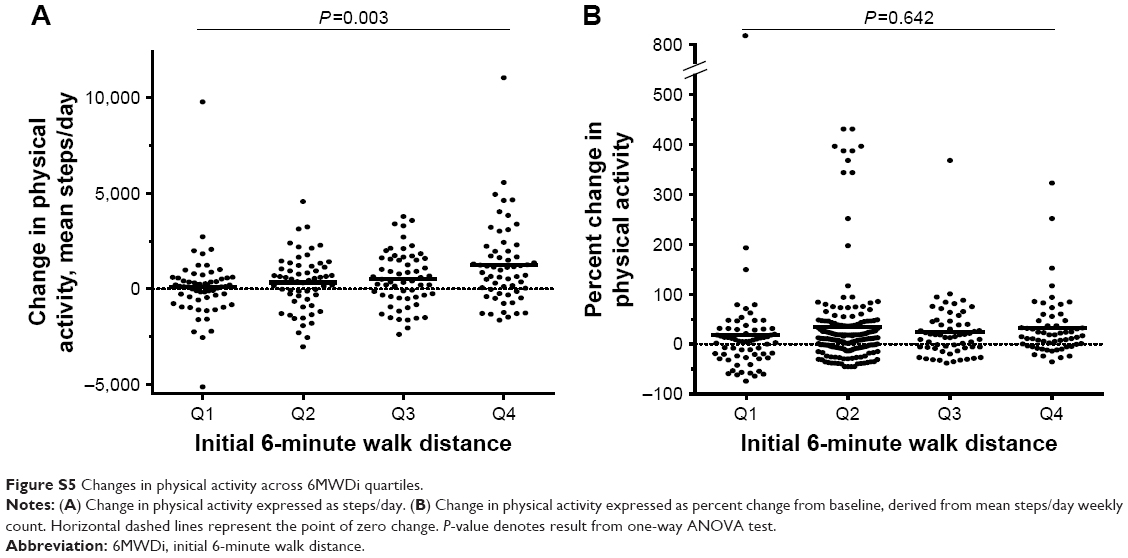 | Figure S5 Changes in physical activity across 6MWDi quartiles. |
 © 2018 The Author(s). This work is published and licensed by Dove Medical Press Limited. The
full terms of this license are available at https://www.dovepress.com/terms
and incorporate the Creative Commons Attribution
- Non Commercial (unported, 3.0) License.
By accessing the work you hereby accept the Terms. Non-commercial uses of the work are permitted
without any further permission from Dove Medical Press Limited, provided the work is properly
attributed. For permission for commercial use of this work, please see paragraphs 4.2 and 5 of our Terms.
© 2018 The Author(s). This work is published and licensed by Dove Medical Press Limited. The
full terms of this license are available at https://www.dovepress.com/terms
and incorporate the Creative Commons Attribution
- Non Commercial (unported, 3.0) License.
By accessing the work you hereby accept the Terms. Non-commercial uses of the work are permitted
without any further permission from Dove Medical Press Limited, provided the work is properly
attributed. For permission for commercial use of this work, please see paragraphs 4.2 and 5 of our Terms.