Back to Journals » Clinical Optometry » Volume 13
The Investigation of the Effect of Hyperglycemic Changes on Psychophysical Measurements of Visual Function in Pseudophakic People Living with Diabetes Mellitus
Authors Majola L ![]() , Munsamy AJ
, Munsamy AJ ![]()
Received 7 April 2021
Accepted for publication 2 June 2021
Published 20 July 2021 Volume 2021:13 Pages 191—199
DOI https://doi.org/10.2147/OPTO.S284490
Checked for plagiarism Yes
Review by Single anonymous peer review
Peer reviewer comments 2
Editor who approved publication: Mr Simon Berry
Lindokuhle Majola,1 Alvin J Munsamy2
1Department of Health, Port Shepstone, South Africa; 2Discipline of Optometry, School of Health Science, University of KwaZulu-Natal, Durban, South Africa
Correspondence: Lindokuhle Majola
Department of Health, Ugu District, PO Box 951, Hibberdene, Port Shepstone, 4220, South Africa
Tel +27 79 347 8540
Email [email protected]
Alvin J Munsamy
Discipline of Optometry, School of Health Science, University of KwaZulu-Natal, Private Bag X54001, Durban, 4000, South Africa
Tel +27 31 260 7352
Fax +27 31 260 7666
Email [email protected]
Purpose: The purpose of this study was to show the effect of increasing blood glucose level (BGL) on psychophysical visual function represents by visual acuity and contrast sensitivity in pseudophakic people living with diabetes (PDM).
Study Design: This was quasi-experimental, quantitative study using a pretest–posttest approach.
Methods: The study was conducted at Gamalakhe community health centre located in Gamalakhe township and included a sample of 50 pseudophakic people living without diabetes mellitus (PWDM) and 50 pseudophakic PDM. BGL as well as psychophysical measurements of visual function were measured preprandial and postprandial. Visual acuity (VA) was measured at distance (4 m) and near (40 cm) using logMAR VA charts, and contrast sensitivity (CS) was measured at 50 cm using a Mars chart. The data collected were captured and subsequently analyzed using SPSS version 25.
Results: Glycemic changes measured preprandial and postprandial observed a mean increase of 2.06± 1.35 mmol/L (p=0.350) and 1.08± 0.47 mmol/L (p=0.291) in pseudophakia PDM and pseudophakic PWDM, respectively. CS showed a mean increase of 0.01± 0.10 (p=0.23) and 0.002± 0.02 (p=0.19) log units in PDM and PWDM, respectively; however, the independent t-test showed this was insignificant between PDM and PWDM (p=0.27). A insignificant mean increase of 0.01± 0.04 log units (p=0.25) and 0.001± 0.01 (p=0.32) in distance VA of pseudophakic PDM and PWDM was found, respectively. A mean increase of 0.001± 0.01 log units (p=0.32) and 0.01± 0.03 (p=0.06) near logMAR VA of pseudophakic PDM and PWDM was found, respectively.
Conclusion: Acute hyperglycemic changes do not result in overall significant changes in visual acuity and contrast sensitivity in pseudophakic PDM and PWDM for an increase in glycemia of 2 mmol/L. We recommend studies investigate if changes occur for glycemic increases exceeding 2 mmol/L.
Keywords: diabetes mellitus, contrast sensitivity, visual acuity, pseudophakia
Introduction
The International Diabetes Federation (IDF) reported that diabetes mellitus (DM) is affecting three-and-a-half million South Africans and 366 million people globally, which is predicted to rise to 552 million by 2030.1 The prevalence of DM is about 12.8% and 19 million in South African and Africa, respectively.2 People living with diabetes mellitus (PDM) account for up to 20% of all cataract procedures, with this increasing annually, evidence of the effect of glycemic changes in aphakic/pseudophakic PDM on vision is very limited. Previous studies3–12 have found changes on psychophysical measurement of visual function in phakic PDM limited to no studies on aphakic and pseudophakic PDM, respectively. Thus the impact of glycemic changes in pseudophakic PDM on vision should be a concern to inform safety practices on activities of daily living that include driving; reading, etc in society.
PDM complain of transient subjective visual disturbances, such as difficulty in reading or driving and blurred vision whilst using their spectacles, are not uncommon in daily clinical practice, due to fluctuating blood glucose level (BGL).12,13 The measurement of visual acuity (VA) and contrast sensitivity (CS) clinically accounts for these visual disturbances and are regarded as psychophysical measurements of vision.10 Since the nineteenth century fluctuating BGL has been known to cause transient visual changes in phakic PDM while little is known on aphakic and pseudophakic PDM.14,15 Pseudophakia refers to the implantation of an artificial intraocular lens (IOL) after the natural eye lens has been removed.16 CS is the ability of the visual system to realize differences between objects and background at finest detail.11 In PDM, CS may be reduced even before the development of diabetic retinopathy and even when the VA is undisturbed. Hence measuring CS may be a useful tool for early detection of abnormalities in retinal function in PDM.11
The purpose of this study was to show the effect of hyperglycemia on psychophysical measurements of visual function, including VA and CS in pseudophakic PDM. No studies on pseudophakic PDM have compared the effect of glycemic changes on psychophysical measurements. The study can alert eye practitioners of the significance or lack thereof of blood sugar level changes in pseudophakia and manage patients by alerting them to its acute influence on their vision.
Methods
This was an observational study using a case-control approach (quasi-experimental), quantitative study using a pretest–posttest approach. The study was conducted at Gamalakhe community health centre (CHC) located in Gamalakhe township. The eye clinic is situated in a community area where it is the first point of access for eye care services. A nonprobability convenience sampling technique was used to access the participants for this study from the clinic population that comprise of pseudophakic PDM. A sample of 67 eyes of pseudophakic PWDM and 60 eyes of pseudophakic PDM comprised control and experimental groups for the study, respectively. Pseudophakic PDM were divided into two groups of people diagnosed with DM for more than 10 years and less than 10 years.
Selection Criteria
The study included pseudophakic people with and without DM who had a best corrected VA (BCVA) of 0.2 logMAR (Snellen equivalent 6/9). Participants who had ocular disorders such as corneal disease or surgery or posterior capsular opacification (PCO) and retinopathy were excluded. Participants with mild nonproliferative diabetic retinopathy to no retinopathy, weighing between 60 kg and 150 kg were included in the study.
Screening
The study commenced with a screening phase to ensure that participants satisfied the selection criteria for the study. A brief history was conducted before any testing to gather basic demographic data, ocular history and general health status. VA measurements were taken (with and/or without prescription glasses) to ensure the participants meet the minimum criteria for BCVA of 0.2 logMAR or better. A subjective refraction was administered to account for uncorrected refractive error to improve BCVA to satisfy the inclusion criteria. Near VA was measured with the prescription spectacles. Ophthalmoscopy and slit lamp biomicroscopy were performed to rule out ocular pathology that may have contaminated the psychophysical visual function test results and ultimately the research findings.
Data Collection
A pilot study using five pseudophakic PDM and five pseudophakic PWDM was performed to determine if changes in BGL causes changes in VA and CS, and if so to observe the average time and change in BGL to cause these visual changes. The pilot study was also conducted to determine the time it would take for each weight to reach a stable BGL postprandial. Ten participants that satisfied the inclusion criteria from screening phase were involved in the pilot study. Initial visual measurements which included VA and CS were measured for preprandial BGL and repeated for postprandial BGL and then compared. This showed it took 10 min for BGL to increase postprandial measurements informing the choice of visual measurements taken every 10 min until two consecutive readings of BGL were unchanged at which point visual measurements stopped for both groups of pseudophakic PDM and PWDM for the main study. Pretest and posttest visual measurements were obtained preprandial and postprandial respectively. Figure 1 shows the overview of the data collection process for the main study.
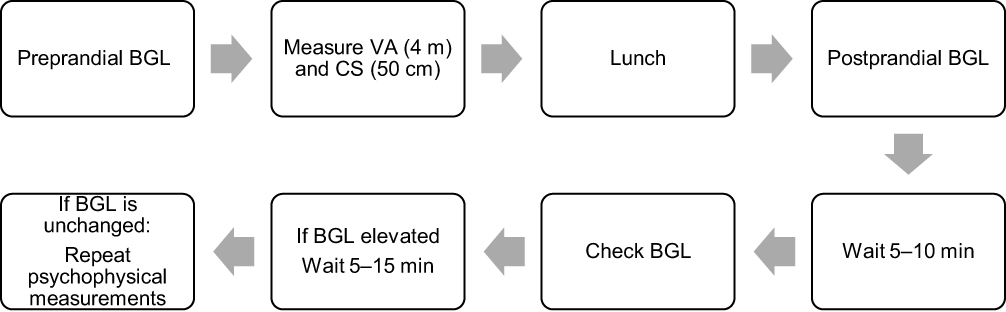 |
Figure 1 Flow chart demonstrating data collection process for psychophysical measurements. |
Procedure
Hemoglucotest Measurements (Accu-Chek Active) for Glycemic Changes
The procedure involved pricking the index finger and inserting the blood on a glucose meter strip which was already inserted into the machine (Accu-chek active). The results were shown on the screen within 10 to 20 seconds and were recorded as preprandial and postprandial glycemic measurements. Postprandial BGL was measured until the participant reached peak BGL based on their weight and metabolism, measurements were stopped based on the results of the pilot study. Studies done by found Accu-chek hemoglucotest to be very reliable and repeatable even for self-monitoring of PDM.17–19
LogMAR Visual Acuity Measurements (Bailey–Lovie Chart)
Distance and near VA were measured for each eye at 4 m and 40 cm using the logMAR VA chart, without and with the prescription in a normal room illumination (500 lux), respectively. To ensure uniformity, the same clinician obtained measurements. A line scoring method was used to determine the visual acuity of participants. The logMAR value of the best line read monocular was recorded and the number of letters read in the next row was multiplied by 0.02 and subtracted from the logMAR value of the best line completely read. Contrarily, when letters were missed on a line, the number of the letters was multiplied by 0.02 and added to the acuity.20
Contrast Sensitivity Measurements (Mars Chart)
CS was measured at 50 cm using the Mars chart while the participant had their best corrected near prescription for each eye.9 The participant was asked to read the letters from left to right across each line of the chart which was uniformly illuminated to ensure the best results. The participant was encouraged to guess the letters when they report that letters were faint. The last letter that the participant read was scored by subtracting 0.04 for every missed letter. The threshold acuity was recorded when two consecutive incorrect letters were read.
Ethical Considerations
Ethical permission was obtained before commencement of the study from the relevant authorities. The participants of this study each were given an information document and a consent form. The information document enlightened the participant about what the study entailed, while the consent form ensured the utmost confidentiality of all information gathered from the participant as well as the freedom to withdraw from the study. The tenets of the Declaration of Helsinki were observed throughout the study.
Statistical Analysis
Descriptive statistics such as frequencies and percentages were used to summarize categorical data. Measures of central tendency, mean and median, and measures of dispersion such as standard deviation and interquartile ranges were calculated for numerical variables. The Kolmogorov–Smirnov test was first used to assess distribution of data. The Kruskal–Wallis test was used to compare changes in glycemia for each group. The Wilcoxon signed rank test was used to test for pre- and postprandial CS and VA for each group. The Mann–Whitney U-test was used to compare these between pseudophakic PDM and PWDM. The effects of glycemic changes on visual functions were assessed using the multivariate linear regression analysis. A p-value less than 0.05 was considered statistically significant. All analysis was completed using SPSS version 25.
Results
A total of 100 African participants, 50 pseudophakic type 2 PDM none of whom were on insulin and 50 pseudophakic PWDM participated in this study. Sixty and 67 eyes were admitted for pseudophakic PDM and pseudophakic PWDM, respectively. Table 1 shows the mean age, weight and gender profiles of participants, the glycemic characteristics and the duration of diabetes for the experimental and control groups.
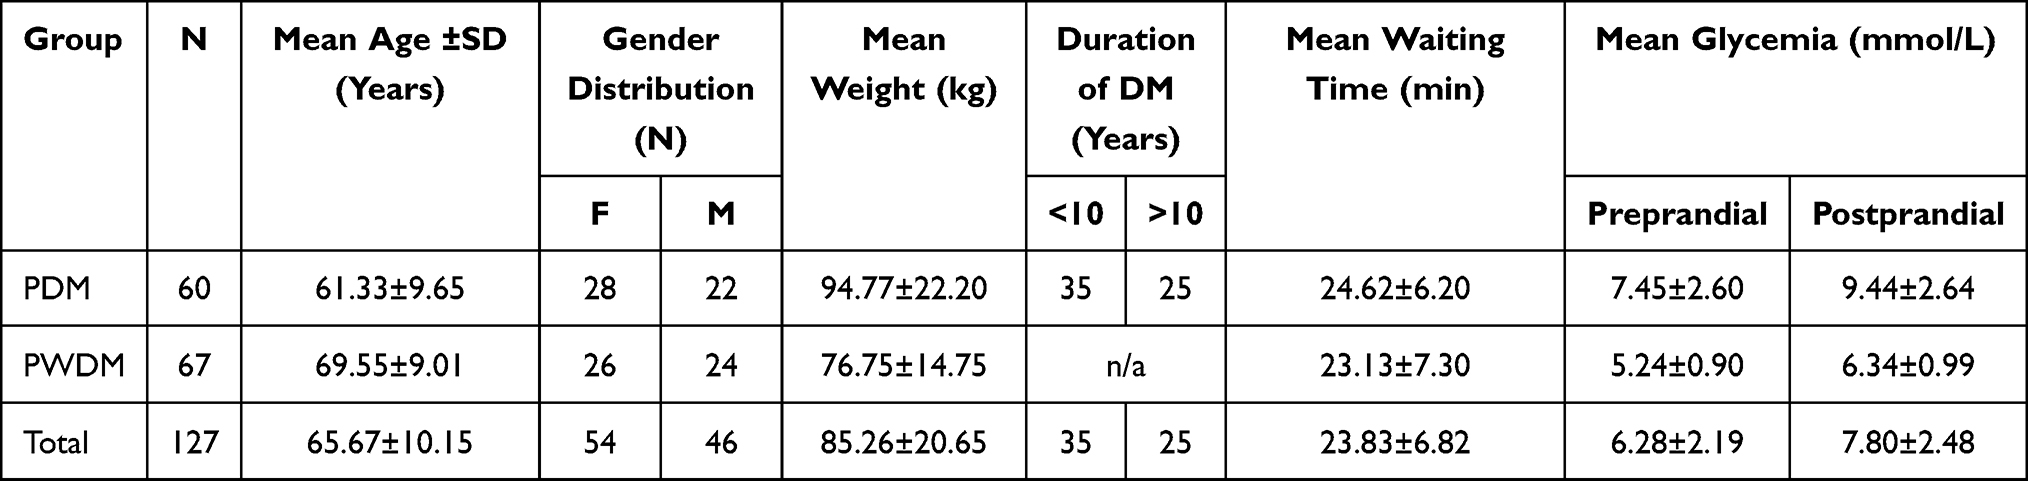 |
Table 1 Participant Characteristics of the Study |
The mean change values for BGL, CS, and logMAR VA for pseudophakic PDM and PWDM for preprandial and postprandial measurements are given in Table 2. The mean change in CS for 2 mmol/L of hyperglycemia was 0.01±0.10 log units (p=0.23) for pseudophakic PDM. The mean change in distance and near acuity was 0.01±0.04 log units (p=0.25) and 0.002±0.01 log units (p=0.32), respectively for pseudophakic PDM. These changes were all not statistically significant when compared with pseudophakic PWDM using the independent t-test and Mann–Whitney U-test.
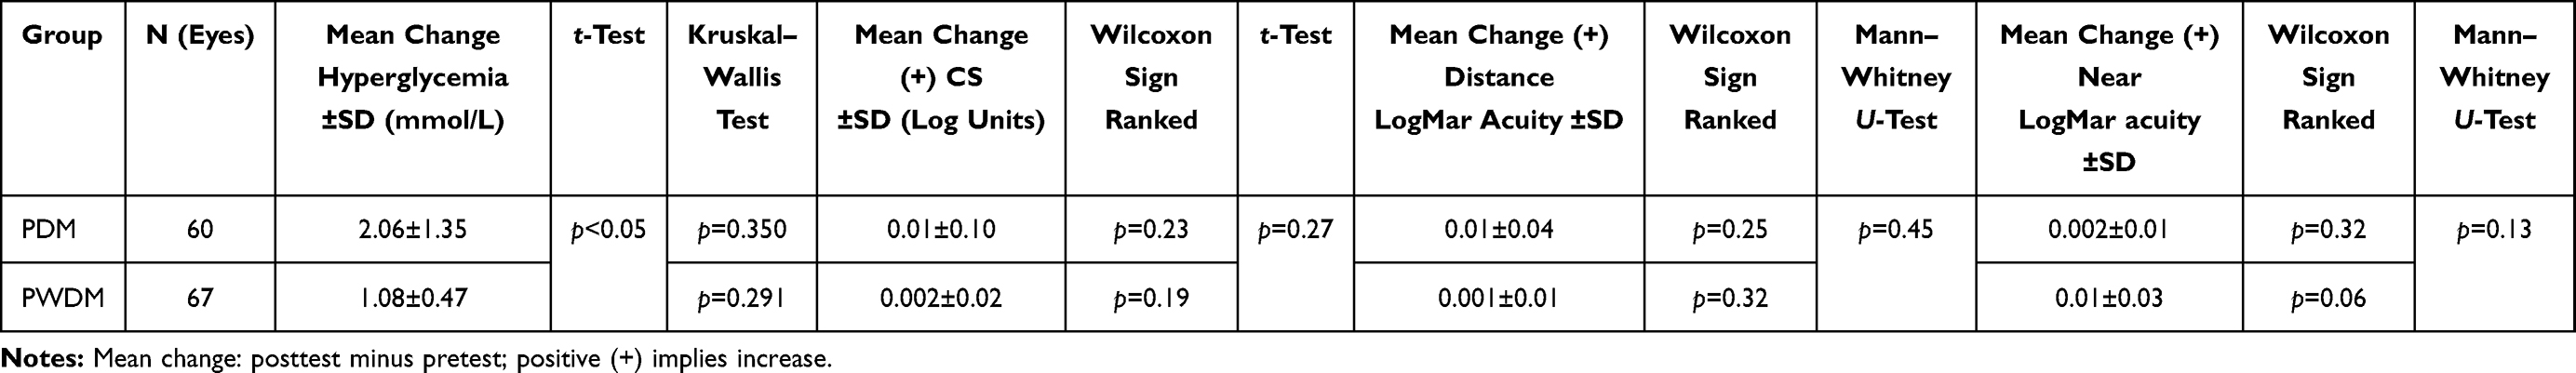 |
Table 2 The Effect Hyperglycemic Changes on Psychophysical Measurements in Pseudophakic People with DM (PDM) and Pseudophakic without DM (PWDM) |
Table 3 shows that when pseudophakic PDM who had DM for more than 10 years were compared to those who had DM for less than 10 years, there was no statistical significant effect on the change in CS and VA for hyperglycemia.
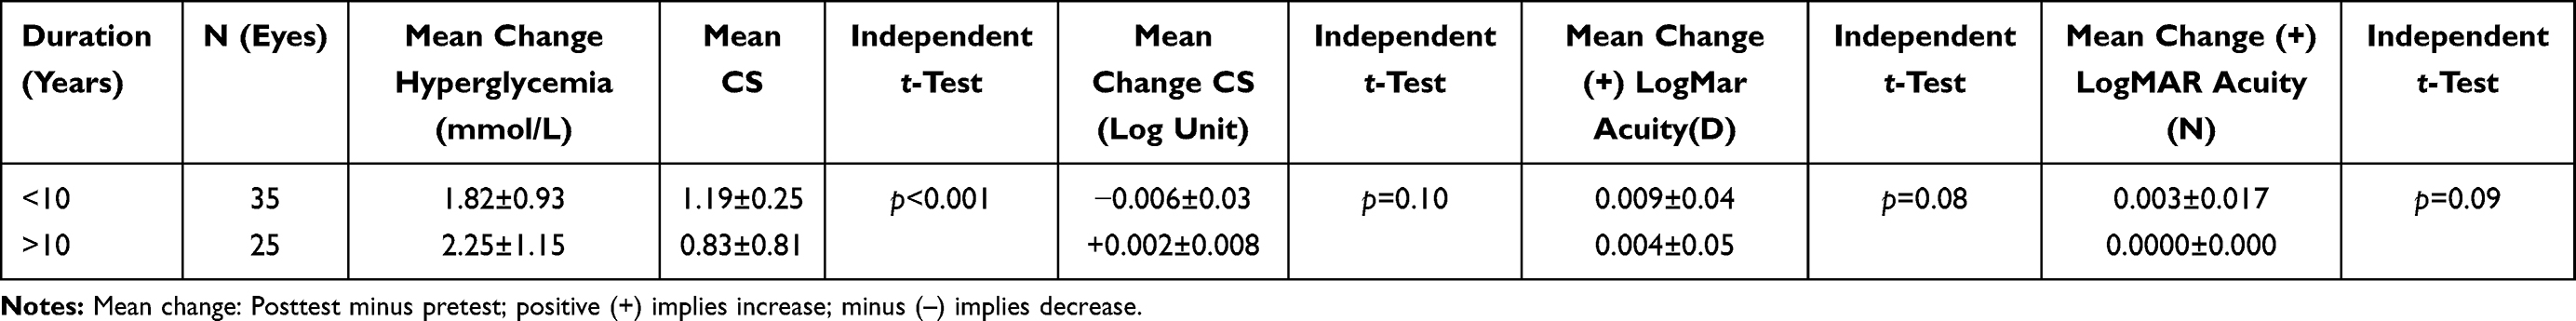 |
Table 3 The Effect of the Duration of DM for Hyperglycemic Changes on Psychophysical Measurements in Pseudophakic People with DM |
The effects of glycemic changes on visual functions was assessed using the multivariate linear regression analysis and is shown in Figure 2. This revealed no significant associations for glycemic changes and CS (A), distance visual acuity (B) and near visual acuity (C) for both PDM and PWDM.
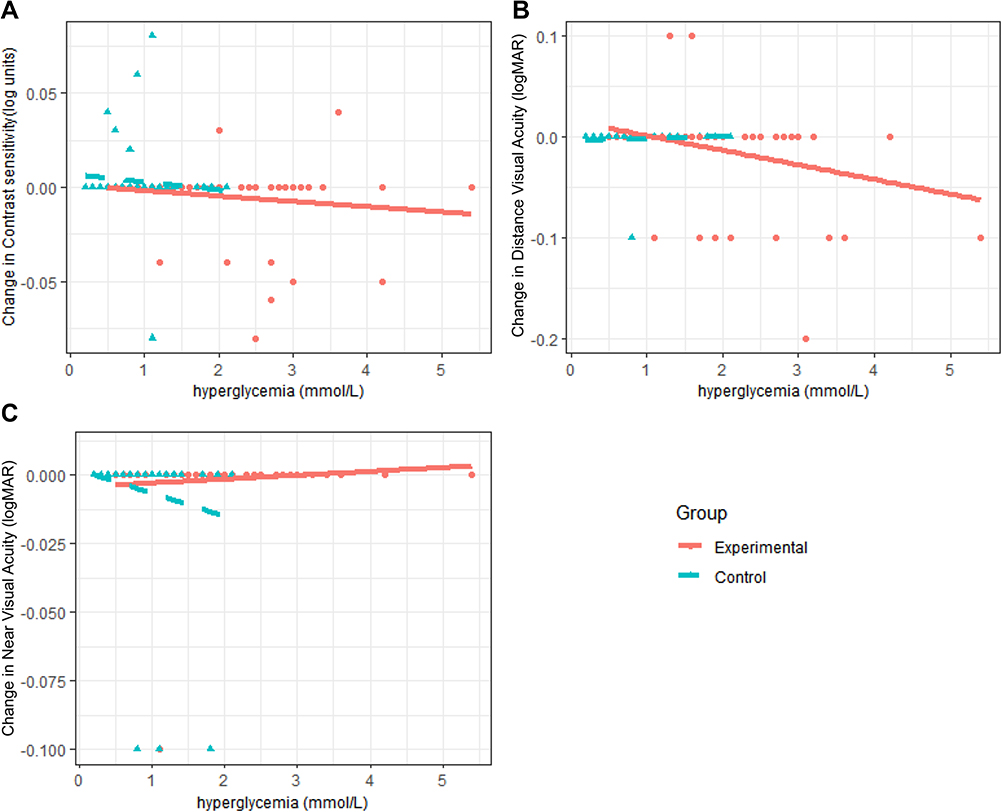 |
Figure 2 The association of hyperglycemia (independent variable) with psychophysical visual measurements (dependent variable) in pseudophakic PMD (diabetics) and PWDM (non-diabetics). (A) Experimental: β=−0.06 (95%CI: −0.007; 0.005), p=0.66; control: β=−0.08 (95%CI: −0.014; 0.007), p=0.54. (B) Experimental: β=−0.04 (95%CI: −0.013; 0.009), p=0.74; control: β=0.51 (95%CI: −0.004; 0.009), p=0.54 (C) Experimental: β=0.11 (95%CI: −0.002; 0.005), p=0.387; control: β=−0.143 (95%CI: −0.023; 0.006), p=0.25. |
Figure 2A shows a statistically insignificant correlation coefficient β=−0.057 (95%CI: −0.007; 0.005), p=0.663 and β=−0.077 (95%CI: −0.014; 0.007), p=0.538 in pseudophakic PDM and PWDM, respectively was observed between changes in BGL as well as changes in CS.
Figure 2B shows a statistically insignificant correlation coefficient β=−0.044 (95%CI: −0.013; 0.009), p=0.737 and β=0.512 (95%CI: −0.004; 0.009), p=0.538 in pseudophakic PDM and PWDM, respectively was observed between changes in BGL as well as changes in distance VA.
Figure 2C shows a statistically insignificant correlation coefficient β=0.114 (95%CI: −0.002; 0.005), p=0.387 and β=−0.143 (95%CI: −0.023; 0.006), p=0.249 in pseudophakic PDM and PWDM, respectively was observed between changes in BGL as well as changes in near VA.
Discussion
The study sought to assess the effects of glycemic changes on VA and CS in pseudophakic PDM. There were no statistically significant differences on VA and CS with hyperglycemia. Further to this, there was no statistically significant difference when pseudophakic PDM was compared to the pseudophakic PWDM. This observation occurred for hyperglycemic changes of 2.06 mmol/L in pseudophakic PDM and 1.08 mmol/L seen in pseudophakic PWDM. However, CS was statistically reduced in pseudophakic PDM who were diagnosed with DM for over 10 years compared to under 10 years.
CS changes were statistically similar between the two groups. This was in agreement with Ghafour et al9 and Andrade et al10 who found similar results in phakic PDM and PWDM. Acute hyperglycemic changes in phakic PDM are often associated with transient subjective visual disturbances, and CS testing is used to assess functional visual disturbances.13 It was found that acute hyperglycemic changes had no effect on CS in pseudophakic PDM and PWDM. In contrast, studies (without retinopathy) on phakic PDM acute glycemic changes resulted in poorer CS.6,9 The present study results showed that acute glycemic changes in pseudophakic PDM do not cause acute subjective visual disturbances.
A mean CS of 0.83±0.81 log units and 1.19±0.25 log (p<0.001)) units was found in pseudophakic PDM and who had had DM for more than 10 years and less than 10 years, respectively. This shows that the duration of DM significantly affects the CS in pseudophakic PDM after 10 years. A study conducted by Noticewala and Shastri7 found no association between CS and the duration of DM in PDM having diabetic duration of less than 10 years. This was in disagreement with Mangouritsas et al13 who found no difference between the duration of DM and CS in phakic insulin-dependent PDM. However, a later study by Rashmi et al11 agreed with our study and found that phakic PDM with DM for over 10 years had lower CS compared to phakic PDM who have had DM for less than 10 years. In pseudophakic PDM, CS may be reduced even before the development of diabetic retinopathy in the presence of normal VA. Hence measuring CS may be a useful tool for early detection of abnormalities in retinal function in PDM.11 This may be supported by the findings of the sub-group analysis that showed CS changes between DM (>10 years) and DM (<10 years). The present study suggests that the duration of DM may affect CS, resulting in poorer CS in pseudophakic PDM who have been diagnosed with DM for over 10 years.
A mainstream estimation of visual capacity is VA in light of the fact that the test is effortlessly regulated.12 Hyperglycemic changes in pseudophakic PDM and PWDM did not significantly affect distance and near VA, this was in agreement with a study done by Giusti et al22 who found similar results on phakic PDM. However, studies done on phakic PDM found that acute glycemic changes affect distance VA whether in a hyper- or hypoglycemic state.10,18 Wiemer el al22 conducted a study on phakic PWDM and found a reduction in VA during hyperglycemia. However, this study22 was done on phakic non-diabetics compared to the present study which included pseudophakic non-diabetics. No previous studies have been found to be done at near vision. The present study also found no significant changes in distance VA and near best corrected VA of pseudophakic PDM who have been diagnosed with DM for less or more than 10 years. Furthermore, there is a paucity of studies comparing the duration of DM on VA either at distance and or at near vision.
A regression analysis showed a statistically insignificant negative correlation between hyperglycemia and change in CS. This is in agreement with Rashmi et al11 who also found a positive correlation between CS and hypoglycemia in phakic PDM. A negative correlation was found between hyperglycemia and distance VA in pseudophakic PDM. Agardh et al23 showed this in phakic PDM between distance VA and hyperglycemia although this was statistically insignificant in phakic PDM. It imperative to note that even though there is negative correlation between hyperglycemia and changes in psychophysical measurements of vision (distance VA and CS) in both phakic and pseudophakic PDM, these changes are statistically and clinically insignificant. For near visual acuity a positive correlation was found in pseudophakic PDM, however, the effects of hyperglycemia on near vision has not been investigated on phakic PDM.
Study limitations included the single BGL and measurements of vision. A recent HbA1c was not measured to determine if there is any correlation between HbA1c and psychophysical measurements of vision. In light of their individual dietary concerns, participants brought their own food for the study. The current study was limited to a single race group (African) with only type 2 DM. The glycemic changes for the experimental group was more than the control group, however, this may be related to the metabolism of non-diabetics and the ability to metabolize food. Unaided VA was measured at distance to determine if the changes found in VA may not necessarily include the changes in refraction. However if the VA was very poor unaided, 6/60 and worse, changes will not be detected as the patients have blurred vision. Ebeigbe and Osaiyuwu24 found a transient improvement in unaided as well as aided distance and near VA during hypoglycemia of phakic PDM, hence changes in aided and unaided VA show a similar thread during hypoglycemia of phakic PDM.
A larger sample size including both type 1 and type 2 DM is recommended for future studies. Studies attempting to raise the BGL more than 2 mmol/L may add value to the present study findings of unaffected CS and VA. The inclusion of HbA1c measurements may strengthen the BGL observation during the study. More studies that have a higher fluctuating blood glucose level are warranted. Studies with age and weight matched pseudophakic PWDM and diabetic pseudophakic are warranted. PDM The inclusion of other psychophysical measurements of vision such as color vision testing and glare sensitivity testing may strengthen the study findings. A cohort study where participants have repeated measurements of BGL and psychophysical measurement of vision would be able to better examine the relationship between BGL changes and psychophysical measurements of vision.
Conclusions
The present study highlights the effect of acute glycemic changes in pseudophakic PDM as well as pseudophakic PWDM on psychophysical measurements of visual function in VA and CS. Acute hyperglycemia of up to 2 mmol/L changes do not result in overall significant changes in VA and CS in both pseudophakic PDM and PWDM. However, the duration of DM may affect the CS in pseudophakic PDM without retinopathy who have had DM for more than 10 years. This was the first attempt to study the effects of acute glycemic changes on vision in diabetics and non-diabetics with pseudophakia. No other study has compared these two groups and this may help serve as a scientific basis for clinicians to inform the fluctuation of vision in pseudophakes during glycemic fluctuations up to 2 mmol/L. Further studies with hyperglycemia exceeding 2 mmol/L are recommended to confirm the findings of this study.
Ethics Approval and Consent to Participate
Biomedical Research Ethics Committee (BREC)
BREC Ref No: BE230/18
Affiliation: University of KwaZulu-Natal (UKZN)
A written consent to participate was obtained from all participants of the study.
Acknowledgments
A University of KwaZulu-Natal (UKZN), Developing Research Innovation, Localization and Leadership in South Africa (DRILL) fellow. DRILL, is a NIH D43 grant (D43TW010131) awarded to UKZN in 2015 to support a research training and induction programme for early career academics. The content is solely the responsibility of the authors and does not necessarily represent the official views of DRILL and the National Institutes of Health.
Author Contributions
All authors made a significant contribution to the work reported, whether that is in the conception, study design, execution, acquisition of data, analysis and interpretation, or in all these areas; took part in drafting, revising or critically reviewing the article; gave final approval of the version to be published; have agreed on the journal to which the article has been submitted; and agree to be accountable for all aspects of the work.
Disclosure
The authors reported no conflicts of interest in this work and declare that they have no financial or personal relationships which may have inappropriately influenced them in writing this article.
References
1. Birgit O. Prevalence of Diabetes in South Africa. Health24; 2017:2.
2. IDF. Diabetes Atlas.
3. Okamoto F, Sone H, Nonoyama T, Hommura S. Refractive changes in diabetic patients during intensive glycaemic control. Br J Ophthalmol. 2000;84(10):1097–1102. doi:10.1136/bjo.84.10.1097
4. Lin SF, Lin PK, Chang FL, Tsai RK. Transient hyperopia after intensive treatment of hyperglycemia in newly diagnosed diabetes. Ophthalmologica. 2009;223(1):68–71. doi:10.1159/000173714
5. Li H-Y, Luo G-C, Guo J, Liang Z. Effects of glycemic control on refraction in diabetic patients. Int J Ophthalmol. 2010;3(2):158–160. doi:10.3980/j.issn.2222-3959.2010.02.15
6. Stavrou EP, Wood JM. Letter contrast sensitivity changes in early diabetic retinopathy. Clin Exp Optom. 2003;86(3):152–156. doi:10.1111/j.1444-0938.2003.tb03097.x
7. Noticewala V, Shastri M. A study of contrast sensitivity changes in normal individual and diabetic patients with and without diabetic retinopathy. Int J Res Med Sci. 2017;5(11):4840–4845. doi:10.18203/2320-6012.ijrms20174930
8. Di Leo MA, Caputo S, Falsini B, et al. Nonselective loss of contrast sensitivity in visual system testing in early type 1 diabetes. Diabetes Care. 1992;15(5):620–625. doi:10.2337/diacare.15.5.620
9. Ghafour IM, Foulds WS, Allan D, McClure E. Contrast sensitivity in diabetic subjects with and without retinopathy. Br J Ophthalmol. 1982;66(8):492–495. doi:10.1136/bjo.66.8.492
10. Andrade LCO, Souza GS, Lacerda EMC, et al. Influence of retinopathy on the achromatic and chromatic vision of patients with type 2 diabetes. BMC Ophthalmol. 2014;14(1):104. doi:10.1186/1471-2415-14-104
11. Rashmi S, Varghese RC, Anupama B, Hegde V, Jain R, Kotian H. Contrast sensitivity in diabetic patients without retinopathy and it’s correlation with the duration of diabetes and glycemic control. IOSR J Dent Med Sci. 2016;15(08):11–13. doi:10.9790/0853-1508061113
12. Jurangal A, Singh A, Dhaliwal RK. Assessment of visual acuity among diabetic patients. Int J Contemp Med Res. 2017;4(6):1311–1314.
13. Mangouritsas G, Katoulis E, Kepaptsoglou O, Zoupas C. Effect of induced hyperglycemia on contrast sensitivity function in insulin-dependent diabetic patients. Ophthalmologe. 1995;92(2):142–147.
14. Eva PR, Pascoe PT, Vaughan DG. Refractive change in hyperglycaemia: hyperopia, not myopia. Br J Ophthalmol. 1982;66(8):500–505. doi:10.1136/bjo.66.8.500
15. Huntjens Bsc B, O ’Donnell C. Refractive error changes in diabetes mellitus. Optom Pract. 2006;7(73):103–114.
16. Collins F. Cataract. Pseudophakia. National Eye Institute; 2019.
17. Temple MY, Bar-Or O, Riddell MC. The reliability and repeatability of the blood glucose response to prolonged exercise in adolescent boys with IDDM. Diabetes Care. 1995;18(3):326–332. doi:10.2337/diacare.18.3.326
18. Salacinski AJ, Alford M, Drevets K, Hart S, Hunt BE. Validity and reliability of a glucometer against industry reference standards. J Diabetes Sci Technol. 2014;8(1):95–99. doi:10.1177/1932296813514315
19. Spraul M, Sonnenberg GE, Berger M. Less expensive, reliable blood glucose self-monitoring. Diabetes Care. 1987;10(3):357–359. doi:10.2337/diacare.10.3.357
20. Oduntan OA, Mashige KP, Raliavhegwa-Makhado M. A comparison of two methods of logMAR visual acuity data scoring for statistical analysis. African Vis Eye Health. 2009;68(3):155–163.
21. Giusti C. Transient hyperopic refractive changes in newly diagnosed juvenile diabetes. Swiss Med Wkly. 2003;133(13):200–205.
22. Wiemer NGM, Eekhoff EMW, Simsek S, et al. Refractive properties of the healthy human eye during acute hyperglycemia. Graefes Arch Clin Exp Ophthalmol. 2008;246(7):993–998. doi:10.1007/s00417-008-0810-y
23. Agardh E, Hellgren KJ, Bengtsson B. Stable refraction and visual acuity in diabetic patients with variable glucose levels under routine care. Acta Ophthalmol. 2011;89(2):107–110. doi:10.1111/j.1755-3768.2009.01664.x
24. Ebeigbe JA, Osaiyuwu AB. Transient refractive changes in a newly diagnosed diabetic-A case report. J Nigerian Optom Assoc. 2009;15.
 © 2021 The Author(s). This work is published and licensed by Dove Medical Press Limited. The
full terms of this license are available at https://www.dovepress.com/terms
and incorporate the Creative Commons Attribution
- Non Commercial (unported, 3.0) License.
By accessing the work you hereby accept the Terms. Non-commercial uses of the work are permitted
without any further permission from Dove Medical Press Limited, provided the work is properly
attributed. For permission for commercial use of this work, please see paragraphs 4.2 and 5 of our Terms.
© 2021 The Author(s). This work is published and licensed by Dove Medical Press Limited. The
full terms of this license are available at https://www.dovepress.com/terms
and incorporate the Creative Commons Attribution
- Non Commercial (unported, 3.0) License.
By accessing the work you hereby accept the Terms. Non-commercial uses of the work are permitted
without any further permission from Dove Medical Press Limited, provided the work is properly
attributed. For permission for commercial use of this work, please see paragraphs 4.2 and 5 of our Terms.