Back to Journals » Clinical Ophthalmology » Volume 16
The Importance of Signal Strength Index in Optical Coherence Tomography Angiography: A Study of Eyes with Pseudoexfoliation Syndrome
Authors Pradhan ZS ![]() , Sreenivasaiah S, Srinivasan T, Shroff S, Devi S, Rao DAS, Webers CAB, Puttaiah NK, Rao HL
, Sreenivasaiah S, Srinivasan T, Shroff S, Devi S, Rao DAS, Webers CAB, Puttaiah NK, Rao HL ![]()
Received 15 June 2022
Accepted for publication 22 September 2022
Published 19 October 2022 Volume 2022:16 Pages 3481—3489
DOI https://doi.org/10.2147/OPTH.S378722
Checked for plagiarism Yes
Review by Single anonymous peer review
Peer reviewer comments 3
Editor who approved publication: Dr Scott Fraser
Video abstract of "Importance of signal strength index in OCT angiography" [ID 378722].
Views: 451
Zia Sultan Pradhan,1 Shruthi Sreenivasaiah,1 Thanemozhi Srinivasan,1 Sujani Shroff,1 Sathi Devi,1 Dhanaraj AS Rao,1 Carroll AB Webers,2 Narendra K Puttaiah,1 Harsha Laxmana Rao1,2
1Department of Glaucoma, Narayana Nethralaya, Bangalore, India; 2Department of Ophthalmology, University Eye Clinic Maastricht, University Medical Center, Maastricht, the Netherlands
Correspondence: Zia Sultan Pradhan, Department of Glaucoma, Narayana Nethralaya, 121/C, Chord Road, 1st “R” Block, Rajajinagar, Bangalore, 560010, India, Tel +91 80 66121300, Email [email protected]
Purpose: To evaluate the effect of the signal strength index (SSI) on a comparison of the vascular and structural OCT measurements between eyes with pseudoexfoliation syndrome (PXF) and healthy controls of Asian-Indian origin.
Methods: In this cross-sectional study, 33 eyes of 33 PXF patients and 40 healthy eyes of 40 controls underwent OCT and OCT angiography (OCTA). Eyes with intraocular pressure (IOP) > 21mmHg, glaucomatous disc changes, or any other ocular pathology were excluded. Peripapillary vessel density (VD) and retinal nerve fiber layer (RNFL) thickness were determined from the optic disc scans. Parafoveal VD and ganglion cell complex (GCC) thickness were measured from the macular scans. These parameters were compared between the groups using mixed effect models after adjusting for clinical confounders such as IOP, as well as SSI of the scans.
Results: The 2 groups were demographically similar. Average RNFL (94μm vs 100μm, p = 0.01) and GCC (91μm vs 95μm, p = 0.03) were thinner in the PXF group compared to controls. The average peripapillary VD appeared lower in the PXF groups compared to controls (58.2% vs 58.8%, p = 0.04), but after adjusting for IOP and SSI, no difference was noted (p = 0.39). After accounting for confounders, parafoveal VD in the PXF group was significantly lower compared to controls (44.3% vs 46.8%, p = 0.008).
Conclusion: Peripapillary RNFL thickness, parafoveal GCC thickness and parafoveal VD were decreased in eyes with PXF when compared to controls. VD measurements are associated with the SSI and, therefore, clinicians and researchers evaluating OCTA scans quantitatively must consider the SSI value during analysis and interpretation.
Keywords: optical coherence tomography angiography, signal strength index, vessel density, pseudoexfoliation syndrome
Introduction
Optical coherence tomography angiography (OCTA) is a relatively new, non-invasive, imaging technique that provides a quantitative assessment of the vasculature of the optic nerve head (ONH) and retina.1 OCTA imaging is performed on the same platform as the standard optical coherence tomography (OCT); however, multiple scans of the same region are taken and compared. High variance of the OCT signal between scans is usually due to moving particles such as red blood cells, and algorithms use this feature to delineate blood vessels.1,2 The quantitative parameter most often used in OCTA is the Vessel Density (VD) which is defined as the ratio of the area occupied by blood vessels (large vessels and microvasculature) to the total measured area expressed as a percentage. Since multiple scans are required to produce OCTA images, the acquisition time is longer, and hence, these images are prone to problems of motion artifacts and poor quality. Some of these limitations of OCTA have been identified and described.3,4
One of the main quantitative indicators of image quality in OCTA is the signal strength index (SSI). The SSI is determined from the intensity of the reflected light across the entire scan; it ranges from 0 to 100 on the RTVue system (Optovue Inc., Fremont, CA).5 Studies done on healthy participants have shown that both the peripapillary and the parafoveal VDs are significantly greater in scans with higher SSIs.3,6 Despite this knowledge, accounting for SSI during analyses of OCTA data is not a uniform practice in ophthalmic research. This has resulted in conflicting results from data of similar disorders around the world. One such example is of pseudoexfoliation syndrome (PXF) which is a disorder of the extracellular matrix, characterized by abnormal fibrillar deposits in the eye.7 It can lead to increased intraocular pressure (IOP) and is also associated with vascular dysfunction.8 There are contradictory results of OCTA data in eyes with PXF. Some studies have demonstrated no difference between the peripapillary VD of PXF eyes and healthy controls,9,10 while others showed a reduced VD in the PXF cohort.7,11 One possible explanation is the difference in the OCTA image quality used in these studies.
Therefore, the purpose of this study was to evaluate the effect of the SSI on a comparison of the vascular and structural OCT measurements of the ONH and macular regions between eyes with PXF and healthy controls of Asian-Indian origin.
Methods
A prospective, cross-sectional study was conducted between Jan 2016 and Jan 2021. The methodology adhered to the tenets of the Declaration of Helsinki and was approved by the Narayana Nethralaya Ethics Committee (EC Ref No.: C/2015/09/02). Written informed consent was obtained from all participants.
Participants included contiguous patients with PXF and healthy controls over the age of 50 years attending the clinic. All participants underwent a comprehensive ocular examination, which included best corrected visual acuity measurement, slit-lamp biomicroscopy, Goldmann applanation tonometry, gonioscopy, and a dilated fundus examination. All patients also underwent spectral-domain OCT (SD-OCT) with RTVue-XR SDOCT (Optovue Inc., Fremont, CA) and OCTA imaging (AngioVue, v2015.100.0.33).
Healthy controls had no family history of glaucoma, IOP ≤21 mm Hg, normal anterior and posterior segments on clinical examination by an ophthalmologist, non-glaucomatous optic discs as assessed by glaucoma experts, and an OCT-measured peripapillary retinal nerve fiber layer (RNFL) thickness (average, superior and inferior) within the 95% confidence interval of the normal distribution. Both eyes of healthy controls showed the absence of pseudoexfoliation deposits on dilated, slit-lamp examination. If both eyes were eligible for the study, only one eye was randomly chosen for analysis.
PXF eyes had an intraocular pressure (IOP) ≤21 mm Hg, normal anterior and posterior segments on clinical examination by an ophthalmologist, presence of pseudoexfoliation deposits in the anterior segment of the eye, absence of glaucomatous disc damage (neuroretinal rim notching or thinning, retinal nerve fiber layer defects or disc hemorrhages) as assessed by glaucoma experts, and an OCT-measured peripapillary RNFL thickness (average, superior and inferior) within the 95% confidence interval of the normal distribution. If both eyes had PXF, only one eye was randomly chosen for analysis.
Exclusion criteria for all participants were age <50 years, corrected distance visual acuity worse than 20/40, refractive errors greater than ±5D sphere and ±3D cylinder, retinal diseases (such as diabetic retinopathy, vein occlusions), neurological disorders which could confound the evaluation and presence of significant media opacities. Eyes which underwent intraocular surgery within the past 6 months were also excluded.
The procedure of OCTA imaging (AngioVue, v2015.100.0.33) has been detailed previously.2,3 In brief, the same location is repeatedly scanned, and the variation in OCT signal caused by moving particles is used to identify blood vessels. Therefore, red blood cells act as the contrast for imaging blood flow in comparison with the static tissue. Blood vessels are then delineated using the split spectrum amplitude-decorrelation angiography (SSADA) algorithm.2 VD is defined as the percentage area occupied by the large vessels and microvasculature in a particular region. VD is calculated over the entire scan area (whole enface region), as well as the defined areas within the scan as described below.
The optic disc OCTA scan is performed using volumetric scans covering an area of 4.5 × 4.5 mm and the software automatically fits an ellipse to the optic disc margin. The peripapillary region is defined as a 0.75 mm-wide elliptical annulus extending from the optic disc boundary as shown in Figure 1A. This region is divided into 6 Garway-Heath sectors (temporal T, supero-temporal ST, supero-nasal SN, nasal N, infero-nasal IN, inferotemporal IT). The VD in each of these sectors was calculated from the “Radial Peripapillary Capillary (RPC) segment” which extends from the internal limiting membrane (ILM) to the posterior boundary of the nerve fiber layer. Additionally, parapapillary choroidal microvascular drop-out (CMvD) was evaluated on the en face images of the choroidal slabs of the optic disc OCTA scans. CMvD was defined as a focal, sectoral capillary dropout (no visible microvasculature) within the area of parapapillary atrophy (PPA), the circumferential width of which was more than one half clock hour of the disc circumference.
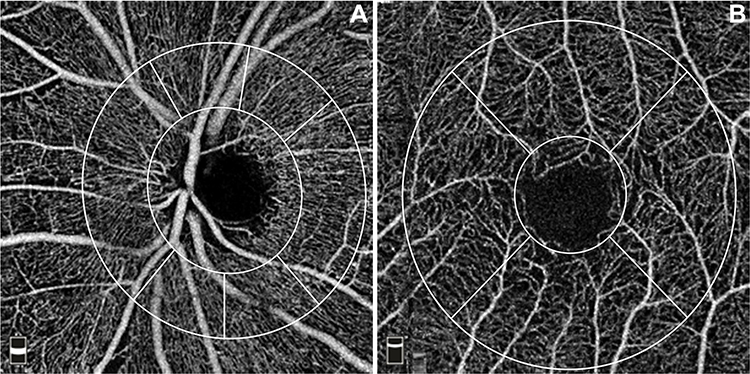 |
Figure 1 Optical coherence tomography angiography (OCTA) scans showing sectors used for vessel density measurement. (A) Optic disc OCTA scan of the radial peripapillary capillary (RPC) segment showing the peripapillary region divided into 6 Garway-Heath sectors. (B) Macula OCTA scan of the superficial vascular plexus segment showing the parafoveal region divided into 4 sectors. |
The macular OCTA scan is performed using volumetric scans covering a 3 × 3 mm area. This region is divided by 2 circles (1 mm and 3 mm in diameter) centered on the fovea as shown in Figure 1B. The region within the inner circle is the fovea, and the parafoveal region is defined as the annulus between these 2 circles. The parafoveal region is divided into 4 sectors of 90 degrees each (nasal, inferior, superior, and temporal sectors). Macular vessel densities analysed were of the superficial vascular plexus present between the ILM and the inner plexiform layer. The foveal avascular zone (FAZ) area of the superficial vascular plexus determined by the automated in-built software was also analysed.
All subjects also underwent the traditional ONH scan for optic disc and peripapillary retinal nerve fiber layer (RNFL) thickness measurements and the macular scan for ganglion cell complex (GCC) thickness measurements on RTVue-XR SD-OCT. These scan protocols have been explained in detail previously.12–14 Apart from the optic disc measurements, the peripapillary RNFL was measured for the 4 quadrant sectors. The macular GCC protocol measures the retinal thickness from the ILM to the posterior boundary of the inner plexiform layer. Apart from the average GCC thickness, the mean GCC thickness of the superior and inferior hemispheres were used for analysis.
Image quality was assessed for all OCTA and OCT scans. Based on the manufacturer's recommendation for OCT scans, those with SSI less than 35 were excluded from the analysis.15,16 Due to the lack of a similar recommendation for OCTA scans, the same cut-off (SSI <35) was used to exclude OCTA images from the final analysis. In addition, each image with an SSI ≥35 was manually evaluated, and those with motion artifacts and segmentation errors were excluded from the analysis.
Statistical Analysis
Based on previous studies, the sample size required to determine a difference in VD of 2.5% with a standard deviation of 3.5, power of 80% and a two-sided alpha level of 5% were calculated to be 32 eyes in each group.7
Descriptive statistics included means and their 95% confidence intervals for normally distributed continuous variables and percentages for categorical variables. The OCTA and OCT parameters were compared between PXF eyes and healthy controls using mixed effect model analysis. On a preliminary comparison of the demographic and clinical features of the 2 groups, the only parameter found to be significantly different was the IOP. Hence, a mixed effect model analysis was performed which accounted for the difference in IOP. Following this, another mixed effect model analysis compared the 2 cohorts adjusting for the differences in SSI in addition to IOP.
Statistical analyses were performed using commercial software (Stata ver. 14.2; StataCorp, College Station, TX). A p value of ≤0.05 was considered statistically significant.
Results
Seventy-three eyes of 73 participants were enrolled in this cross-sectional study. This included 33 eyes with PXF and 40 healthy controls. Table 1 shows the demographic and clinical details for all the study participants. The participants of the two groups were of similar age, and there was no significant difference in the number of diabetics and hypertensives between the two groups. The mean IOP was statistically higher in the PXF cohort when compared to the control group (16.3 vs 14.4 mmHg; p = 0.005).
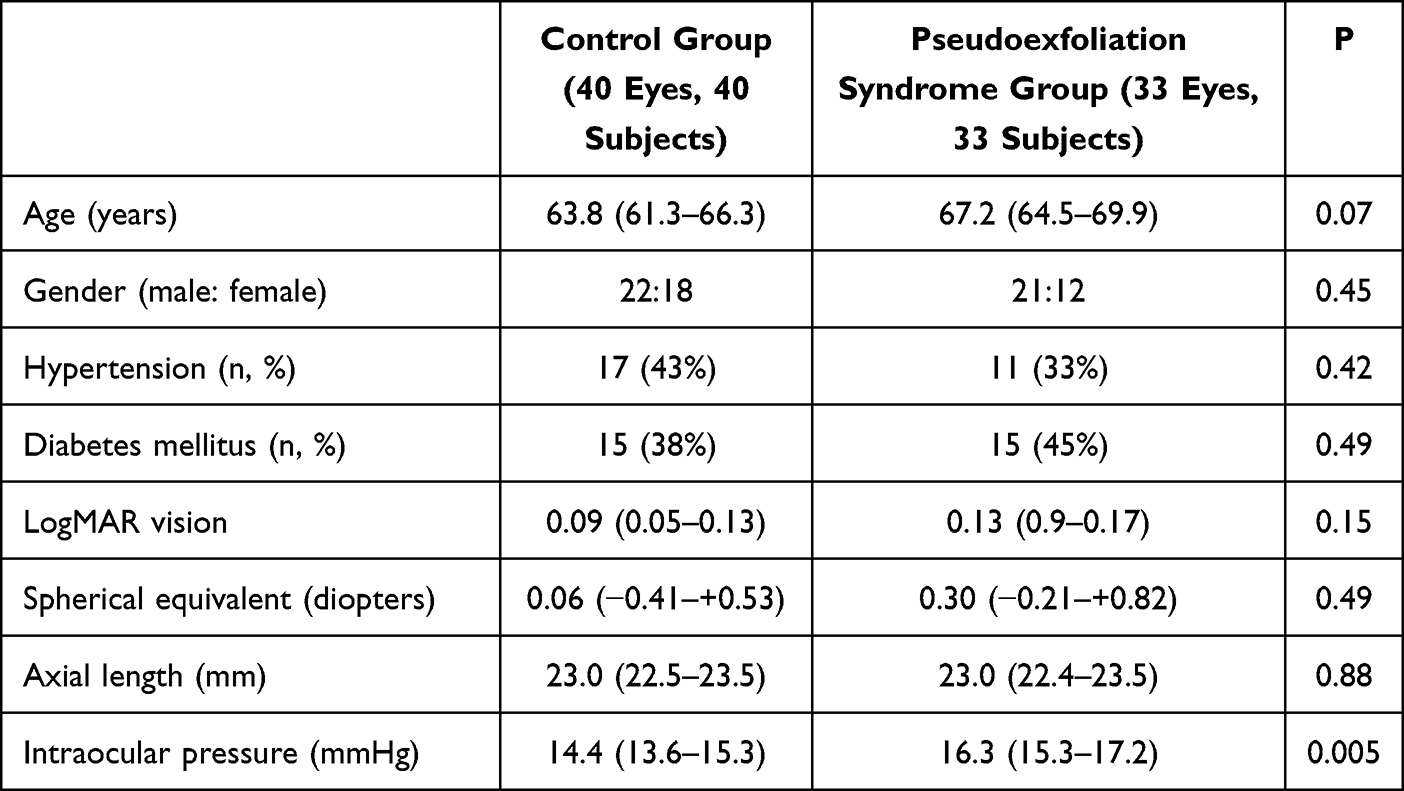 |
Table 1 Demographic and Clinical Data of the Study Participants. Values Represent Mean with 95% Confidence Intervals in Parenthesis |
Table 2 shows a comparison of the structural measurements on OCT between eyes with PXF and controls. After adjusting for IOP, there was no difference in the ONH parameters (disc area, rim area, cup area, cup: disc ratio) between the groups. The average RNFL was thinner in the PXF group compared to the controls (94µm vs 100µm, p = 0.01). A sectoral analysis showed that the superior, inferior and temporal RNFL were significantly thinner in eyes with PXF compared to healthy controls. The macular OCT scan showed that the GCC layer was significantly thinner in eyes with PXF compared to healthy controls (91µm vs 95µm, p = 0.002). Since the mean SSI of the ONH OCT scan (48 vs 53; p = 0.006) and the macula OCT scan (54 vs 58, p = 0.02) was significantly lower in the PXF group compared to the controls, the analysis was also performed after adjusting for SSI and IOP, but the results remained similar (Table 2).
 |
Table 2 Comparison of Optical Coherence Tomography (OCT) Parameters Between Pseudoexfoliation Syndrome Eyes and Healthy Controls Using Mixed Effect Models. All Values Represent Means with 95% Confidence Intervals in Parenthesis |
Table 3 shows a comparison of the vascular measurements on OCTA between eyes with PXF and controls. On analyzing the optic disc parameters after accounting for differences in IOP, it appeared that the PXF group had a significantly lower mean average peripapillary VD and the vessel densities in several sectors (nasal, inferonasal, inferotemporal and superonasal) were also lower in the PXF cohort (p < 0.05). However, the SSI of the optic disc OCTA scan was significantly lower in the PXF group compared to the controls (46 vs 51, p = 0.005). When the analysis was re-performed after adjusting for IOP and SSI, no significant difference was noted in any of the VD parameters of the optic disc scan between the groups. Additionally, evaluation of the choroidal slabs of the optic disc scans showed that none of the study participants (PXF or controls) had a CMvD.
 |
Table 3 Comparison of Optical Coherence Tomography Angiography (OCTA) Parameters Between Pseudoexfoliation Syndrome Eyes and Healthy Controls Using Mixed Effect Models. All Values Represent Means with 95% Confidence Intervals in Parenthesis |
On analysing the macular OCTA parameters after accounting for differences in IOP, the whole en face VD, average parafoveal VD, superior parafoveal VD and inferior parafoveal VD were significantly lower in the PXF group when compared to controls (p < 0.01), while the foveal VD was similar between the groups (Table 3). Since the SSI was significantly lower in the PXF group compared to the controls (55 vs 58, p = 0.04), the analysis was re-performed after adjusting for SSI and IOP, but the results remained similar for most of the parameters. However, the FAZ which appeared larger in the PXF cohort when compared to the controls (0.48 vs 0.44mm2, p = 0.04), was not significantly different after adjusting for IOP and SSI (p = 0.26).
Discussion
The present study highlights the importance of SSI in the interpretation of OCTA measurements. The mean SSI of the OCTA scans was significantly lower in the PXF group, and when this was accounted for, several OCTA parameters (peripapillary VD and FAZ), which appeared to differ between the groups, were no longer significantly different. Although the mean SSI of the OCT scans was also significantly lower in the PXF group, there was no significant change in the comparative results after adjusting for the SSI. It has been shown previously that amongst Cirrus OCT images (Carl Zeiss Meditec, Inc., Dublin, CA) with a signal strength of <7, higher image quality was correlated with thicker RNFL.17 Hence, the company recommends a signal strength cut-off ≥7 for interpretation of OCT measurements. Similarly, the manufacturer's recommendation for RTVue OCT (Optovue Inc., Fremont, CA, USA) is SSI ≥35 for retinal scans which was used in the present study, and adjusting for the SSI made no difference to the outcome of the analysis.15 In contrast, several groups have shown that VD measurements on OCTA decrease with SSI reduction.3,6,18 Rao et al evaluated the OCTA scans (optic disc and macula) of 181 normal eyes with SSI ranging from 35 to 77 and found a direct, linear relationship between the VD and SSI across the entire spectrum of SSIs; this suggests that recommending an SSI cut-off for useable OCTA scans is not as clear-cut as it is for OCT.3 Therefore, the effect of SSI on OCTA measurements appears to be more pronounced than its influence on OCT parameters and accounting for this SSI bias has been recommended while interpreting OCTA data.3,6,18 In recent years, the Optovue company has introduced a scan quality index (SQI) and recommended that scans with SQI ≥6 be considered acceptable image quality. However, studies have shown that even amongst scans with optimum SQI cut-off thresholds, up to 30% of images were still of unacceptable quality on manual grading.19
Despite the known importance of image quality in OCTA, a lot of published research on OCTA has not accounted for the differences in SSI, leading to variable results from different groups. The conflicting reports from previous OCTA studies which compared peripapillary vessel densities between PXF and control eyes formulated the basis for the present study and analysis.7,9–11 PXF is a disorder that is associated with systemic vascular problems, such as cardiovascular and cerebrovascular disease, as well as ocular vasculopathies. Vascular alterations involving PXF eyes include retinal vein occlusions, iris vessel dropout with collateral formation as seen on fluorescein angiography, and impaired retrobulbar blood flow seen on color Doppler imaging.20–23 These features have generated interest in the potential use of OCTA in the understanding of PXF vasculopathy. Safizadeh et al adjusted for age, SSI and other confounders in their multivariable model and found that the circumpapillary capillary density did not differ significantly between PXF and control eyes.10 Gungor et al, who showed no difference between the peripapillary VD between the PXF and control cohorts, also found no difference in the image quality between the groups (7.22 ± 0.76 in PXF and 7.11 ± 0.84 in healthy controls, p = 0.57).9,24 Similar to these findings, we showed no difference in the peripapillary VD between PXF eyes and healthy controls after adjusting for the difference in IOP and SSI between the groups. In contrast, two studies which reported that the peripapillary VD was lower in PXF eyes compared to controls had not adjusted for SSI in their analysis.7,11 PXF is often associated with nuclear sclerosis of the lens which can reduce the amount of light reaching the OCT detector; the long image acquisition time by OCTA makes VD measurements more sensitive to this technical noise than the OCT RNFL measurements.24 Hence, accounting for the image quality and SSI is of paramount importance in the analysis of these OCTA scans.
There are 2 previous studies which have examined the macular parameters of OCTA scans in eyes with PXF and healthy controls.9,25 Similar to our results, both have reported a reduction in the parafoveal VD of the superficial vascular plexus of PXF eyes. However, our results of the foveal vascular changes differ from those reported by Cinar et al.25 They found that the foveal VD in the superficial capillary plexus was significantly reduced in PXF eyes compared to controls, while we reported no difference between the groups after adjusting for IOP and SSI.25 A possible reason for this discrepancy is that we used 3 × 3 mm macular scans, while Cinar et al used 6 × 6 mm macular scans. They also found that the superficial FAZ was significantly larger in the PXF cohort (0.31 vs 0.38 mm2, p = 0.01); however, they had not accounted for the SSI in their analysis. We showed that the FAZ appeared larger in eyes with PXF, but after adjusting for the difference in SSI, the FAZ was similar between the groups. Therefore, the parafoveal VD was lower in eyes with PXF compared to controls after adjusting for SSI and other confounders, but the foveal vasculature was similar between the groups.
In addition to OCTA, the present study also used OCT to compare the structural measurements of the peripapillary and parafoveal retina between PXF eyes and healthy controls. It was found that the peripapillary RNFL and the parafoveal GCC were thinner in PXF eyes compared to controls. Previous SD-OCT studies, including a meta-analysis of 225 PXF eyes and 208 healthy controls, have also shown that eyes with PXF have a thinner RNFL and GCC compared to healthy controls despite the IOP, optic disc parameters, and visual field indices being similar between the groups.26,27 These authors have theorized that hemodynamic factors may play a role in the pathogenesis of this neuronal damage. In the present study, VD reduction on OCTA was statistically significant only in the parafoveal retina of PXF eyes, and no difference was seen in the peripapillary region. This implies that if vascular factors are truly involved in the pathogenesis of PXF, the primary site of hemodynamic compromise is likely to be the parafoveal region. Longitudinal studies are required to better understand the temporal relationship of these neuronal and vascular alterations
The present study has a few limitations. The Angiovue software version used in the current study does not allow removal of large blood vessels for the calculation of VD measurements, and OCTA technology may not be sensitive enough to identify changes in the large vessel flow. However, since most studies on PXF vasculopathies have shown involvement of large vessels such as the central retinal vein, we chose to include these in our calculation of VD. Also, this version of the software does not provide the scan quality index (SQI) for the images. Secondly, the cross-sectional study design limits our understanding of the cause–effect relationship between structural and vascular alterations in this disorder; longitudinal studies would be required to address this issue. However, OCTA is a relatively new, maturing technology and recurrent software modifications have complicated its use in longitudinal studies. Also, a significant proportion of study participants suffered from diabetes and hypertension, albeit without any retinopathy. However, since the number of diabetics and hypertensives was not significantly different between the 2 study groups, this is unlikely to affect the results. Lastly, visual fields were not performed in all the study participants. This is because these were essentially healthy patients whose IOP was <21 mmHg, RNFL thickness was comparable to an age-matched normal population and optic discs were normal as determined by glaucoma specialists. Since OCT changes typically precede functional damage, we chose not to perform visual fields in all patients. However, in the 27 patients (15 PXF and 12 controls) that did perform reliable visual fields, the mean deviation was −2.0 ± 1.6 dB and the visual field index was 97.6 ± 1.7% with no difference between the groups (p = 0.15). Therefore, since visual fields are unlikely to be performed in routine clinical practice when there is no clinical suspicion of glaucoma, a structural diagnosis (clinical optic disc and OCT) was given importance over a perimetric diagnosis for the purpose of the study.
To conclude, after adjusting for confounders such as SSI, the peripapillary RNFL thickness, parafoveal GCC thickness and parafoveal VD were decreased in eyes with PXF when compared to controls. VD measurements are associated with the SSI and, therefore, clinicians and researchers evaluating OCTA scans quantitatively must consider the SSI value during analysis and interpretation.
Data Sharing Statement
Data available from the corresponding author on request due to privacy/ethical reasons.
Statement of Ethics
This study protocol was reviewed and approved by Narayana Nethralaya Ethics Committee (EC Ref No.: C/2015/09/02). Written informed consent was obtained from all participants.
Author Contributions
All authors made a significant contribution to the work reported, whether that is in the conception, study design, execution, acquisition of data, analysis and interpretation, or in all these areas; took part in drafting, revising or critically reviewing the article; gave final approval of the version to be published; have agreed on the journal to which the article has been submitted; and agree to be accountable for all aspects of the work.
Funding
There is no funding to report.
Disclosure
Prof. Dr. Carroll AB Webers reports research support ND speakers fee from Alcon/Novartis, Santen, Thea Pharma. Dr Harsha Laxmana Rao reports personal fees from Santen, personal fees from Allergan, personal fees from Pfizer, outside the submitted work. The Authors declare that there is no other conflict of interest.
References
1. Rao HL, Pradhan ZS, Suh MH, Moghimi S, Mansouri K, Weinreb RN. Optical coherence tomography angiography in glaucoma. J Glaucoma. 2020;29(4):312–321. doi:10.1097/IJG.0000000000001463
2. Jia Y, Morrison JC, Tokayer J, et al. Quantitative OCT angiography of optic nerve head blood flow. Biomed Opt Express. 2012;3(12):3127–3137. doi:10.1364/BOE.3.003127
3. Rao HL, Pradhan ZS, Weinreb RN, et al. Determinants of peripapillary and macular vessel densities measured by optical coherence tomography angiography in normal eyes. J Glaucoma. 2017;26(5):491–497. doi:10.1097/IJG.0000000000000655
4. Spaide RF, Fujimoto JG, Waheed NK. Image artifacts in optical coherence tomography angiography. Retina Phila Pa. 2015;35(11):2163–2180. doi:10.1097/IAE.0000000000000765
5. Czakó C, István L, Ecsedy M, et al. The effect of image quality on the reliability of OCT angiography measurements in patients with diabetes. Int J Retina Vitr. 2019;5:46. doi:10.1186/s40942-019-0197-4
6. Yu JJ, Camino A, Liu L, et al. Signal strength reduction effects in OCT angiography. Ophthalmol Retina. 2019;3(10):835–842. doi:10.1016/j.oret.2019.04.029
7. Suwan Y, Geyman LS, Fard MA, et al. Peripapillary perfused capillary density in exfoliation syndrome and exfoliation glaucoma versus POAG and healthy controls: an OCTA Study. Asia-Pac J Ophthalmol Phila Pa. 2018;7(2):84–89.
8. Holló G. Vascular dysfunction in exfoliation syndrome. J Glaucoma. 2018;27(Suppl 1):S72–4. doi:10.1097/IJG.0000000000000905
9. Gür Güngör S, Sarigül Sezenöz A, Öztürk C, Gökgöz G, Akman A. Peripapillary and macular vessel density measurement with optical coherence tomography angiography in exfoliation syndrome. J Glaucoma. 2021;30(1):71–77. doi:10.1097/IJG.0000000000001685
10. Safizadeh M, Shaabani A, Kamalipour A, et al. Optic nerve head vessel density in different stages of pseudoexfoliation disease. Br J Ophthalmol. 2022;106(2):223–228. doi:10.1136/bjophthalmol-2020-317605
11. Hondur G, Ucgul Atilgan C, Hondur AM. Sectorwise analysis of peripapillary vessel density and retinal nerve fiber layer thickness in exfoliation syndrome. Int Ophthalmol. 2021;41(11):3805–3813. doi:10.1007/s10792-021-01950-7
12. Yarmohammadi A, Zangwill LM, Diniz-Filho A, et al. Peripapillary and macular vessel density in patients with glaucoma and single-hemifield visual field defect. Ophthalmology. 2017;124(5):709–719. doi:10.1016/j.ophtha.2017.01.004
13. Rao HL, Zangwill LM, Weinreb RN, Sample PA, Alencar LM, Medeiros FA. Comparison of different spectral domain optical coherence tomography scanning areas for glaucoma diagnosis. Ophthalmology. 2010;117(9):1692–9, 1699.e1. doi:10.1016/j.ophtha.2010.01.031
14. Rao HL, Leite MT, Weinreb RN, et al. Effect of disease severity and optic disc size on diagnostic accuracy of RTVue spectral domain optical coherence tomograph in glaucoma. Invest Ophthalmol Vis Sci. 2011;52(3):1290–1296. doi:10.1167/iovs.10-5546
15. Zhang X, Iverson SM, Tan O, Huang D. Effect of signal intensity on measurement of ganglion cell complex and retinal nerve fiber layer scans in Fourier-domain optical coherence tomography. Transl Vis Sci Technol. 2015;4(5):7. doi:10.1167/tvst.4.5.7
16. Rao HL, Addepalli UK, Yadav RK, Senthil S, Choudhari NS, Garudadri CS. Effect of scan quality on diagnostic accuracy of spectral-domain optical coherence tomography in glaucoma. Am J Ophthalmol. 2014;157(3):719–727.e1. doi:10.1016/j.ajo.2013.12.012
17. Huang J, Liu X, Wu Z, Sadda S. Image quality affects macular and retinal nerve fiber layer thickness measurements on Fourier-domain optical coherence tomography. Ophthalmic Surg Lasers Imaging. 2011;42(3):216–221. doi:10.3928/15428877-20110324-01
18. You QS, Tan O, Pi S, et al. Effect of algorithms and covariates in glaucoma diagnosis with optical coherence tomography angiography. Br J Ophthalmol. 2021;28:bjophthalmol-2020–318677.
19. Ali N, Sampson DM, Au Yong A, et al. Clinical validation of the RTVue optical coherence tomography angiography image quality indicators. Clin Experiment Ophthalmol. 2020;48(2):192–203. doi:10.1111/ceo.13680
20. Ritch R. The management of exfoliative glaucoma. Prog Brain Res. 2008;173:211–224.
21. Schlötzer-Schrehardt U, Naumann GOH. Ocular and systemic pseudoexfoliation syndrome. Am J Ophthalmol. 2006;141(5):921–937. doi:10.1016/j.ajo.2006.01.047
22. Saatci OA, Ferliel ST, Ferliel M, Kaynak S, Ergin MH. Pseudoexfoliation and glaucoma in eyes with retinal vein occlusion. Int Ophthalmol. 1999;23(2):75–78. doi:10.1023/A:1026557029227
23. Yüksel N, Karabaş VL, Arslan A, Demirci A, Cağlar Y. Ocular hemodynamics in pseudoexfoliation syndrome and pseudoexfoliation glaucoma. Ophthalmology. 2001;108(6):1043–1049. doi:10.1016/S0161-6420(01)00572-3
24. Holló G. Letter to the editor: peripapillary and macular vessel density measurement with optical coherence angiography in exfoliation syndrome. J Glaucoma. 2021;30(3):e105. doi:10.1097/IJG.0000000000001750
25. Çınar E, Yüce B, Aslan F. Retinal and choroidal vascular changes in eyes with pseudoexfoliation syndrome: a comparative study using optical coherence tomography angiography. Balk Med J. 2019;37(1):9–14.
26. Eltutar K, Acar F, Kayaarası Öztürker Z, Ünsal E, Özdoğan Erkul S. Structural changes in pseudoexfoliation syndrome evaluated with spectral domain optical coherence tomography. Curr Eye Res. 2016;41(4):513–520. doi:10.3109/02713683.2015.1039651
27. Yu JG, Huang Q, Zhou XF, Ding Y, Li J, Xiang Y. Retinal nerve fiber layer thickness changes in the pseudoexfoliation syndrome: a meta-analysis of case-control studies. Ophthalmic Res. 2018;59(1):14–23. doi:10.1159/000479377
 © 2022 The Author(s). This work is published and licensed by Dove Medical Press Limited. The
full terms of this license are available at https://www.dovepress.com/terms
and incorporate the Creative Commons Attribution
- Non Commercial (unported, 3.0) License.
By accessing the work you hereby accept the Terms. Non-commercial uses of the work are permitted
without any further permission from Dove Medical Press Limited, provided the work is properly
attributed. For permission for commercial use of this work, please see paragraphs 4.2 and 5 of our Terms.
© 2022 The Author(s). This work is published and licensed by Dove Medical Press Limited. The
full terms of this license are available at https://www.dovepress.com/terms
and incorporate the Creative Commons Attribution
- Non Commercial (unported, 3.0) License.
By accessing the work you hereby accept the Terms. Non-commercial uses of the work are permitted
without any further permission from Dove Medical Press Limited, provided the work is properly
attributed. For permission for commercial use of this work, please see paragraphs 4.2 and 5 of our Terms.