Back to Journals » Neuropsychiatric Disease and Treatment » Volume 14
The impact of total sleep deprivation upon cognitive functioning in firefighters
Authors Kujawski S, Słomko J, Tafil-Klawe M, Zawadka-Kunikowska M, Szrajda J, Newton JL ![]() , Zalewski P, Klawe JJ
, Zalewski P, Klawe JJ
Received 8 November 2017
Accepted for publication 19 January 2018
Published 8 May 2018 Volume 2018:14 Pages 1171—1181
DOI https://doi.org/10.2147/NDT.S156501
Checked for plagiarism Yes
Review by Single anonymous peer review
Peer reviewer comments 6
Editor who approved publication: Dr Roger Pinder
Sławomir Kujawski,1 Joanna Słomko,1 Małgorzata Tafil-Klawe,2 Monika Zawadka-Kunikowska,1 Justyna Szrajda,1 Julia L Newton,3 Paweł Zalewski,1 Jacek J Klawe1
1Department of Hygiene, Epidemiology and Ergonomics, Nicolaus Copernicus University, Toruń, Poland; 2Department of Human Physiology, Nicolaus Copernicus University, Toruń, Poland; 3Institute for Cellular Medicine, Faculty of Medical Sciences, Newcastle University, Framlington Place, Newcastle-upon-Tyne, UK
Introduction: Firefighters as a profession are required to maintain high levels of attention for prolonged periods. However, total sleep deprivation (TSD) could influence negatively upon performance, particularly when the task is prolonged and repetitive.
Purpose: The aim of this study is to examine the influence of TSD on cognitive functioning in a group of firefighters.
Subjects and methods: Sixty volunteers who were active male fire brigade officers were examined with a computerized battery test that consisted of simple reaction time (SRT) (repeated three times), choice reaction time, visual attention test, and delayed matching to sample. Six series of measurements were undertaken over a period of TSD.
Results: Performance in the second attempt in SRT test was significantly worse in terms of increased number of errors and, consequently, decreased number of correct responses during TSD. In contrast, the choice reaction time number of correct responses as well as the visual attention test reaction time for all and correct responses significantly improved compared to initial time points.
Conclusion: The study has confirmed that subjects committed significantly more errors and, consequently, noted a smaller number of correct responses in the second attempt of SRT test. However, the remaining results showed reversed direction of TSD influence. TSD potentially leads to worse performance in a relatively easy task in a group of firefighters. Errors during repetitive tasks in firefighting routines could potentially translate into catastrophic consequences.
Keywords: constant routine protocol, simple reaction time, choice reaction time, visual attention test, delayed matching to sample mental functioning
Introduction
Research performed over the last 100 years has shown paradoxical results: studies suggest that it is harder to maintain prolonged attention while the ambient environment is monotonous and requires lower levels of cognitive resources than in interesting and demanding environments.1–4 Additionally, total sleep deprivation (TSD) can lead to neurocognitive decline in attention, working memory, and executive function.5,6
Firefighters require the ability to maintain high levels of attention for prolonged periods; even the smallest mistake while performing procedures can lead to failure on a huge level. However, TSD could negatively influence the quality of performance, especially when cognitive function tests are not exciting and prolonged in time. Several studies confirm that the ability to maintain attention is susceptible to sleep deprivation.7–10 Moreover, results of meta-analyses have shown that the combined effect size of TSD has an influence upon simple attention and vigilance tasks and is the largest of all cognitive domains studied.10 It has been noted that there is not a large cognitive decline in complex cognitive tests after TSD, probably due to the effects of a phenomenon known as compensation: participants self-drive and motivation increases during cognitive tests after TSD, therefore, the difference between pre- and posttest is minimal.11,12 Increasing task difficulty facilitates the cerebral compensatory response to TSD. For example, meta-analysis average effect sizes for complex attention and working memory tests have been shown to be moderate.10 Moreover, results of several studies have shown somewhat similar pattern of TSD effects upon cognitive domains.7,8 However, in the case of simple attention and vigilance tasks, the compensation effect has its least potency during TSD.10 Furthermore, the meta-analysis average effect sizes of the accuracy measures for tests of processing speed were not statistically significant,10 which has been confirmed by the results of more recent intervention-based studies.13 This could be explained by introducing a trade-off model: when TSD diminishes the ability of subjects to perform processing speed tests, subjects have the ability to “choose” how to best manage with such inconvenience. On the one hand, subjects can try to respond faster; however, this would lead to an increase in the number of committed errors or false alarms in simple reaction time tests. On the other hand, taking effort to minimize the level of errors could lead to slower reaction times.14
Most studies show the negative effects of TSD upon cognitive functioning, especially when the task is long and repetitive.7,8 However, there are few data related to the effects of TSD on healthy experts in maintaining high-level attention for prolonged time periods during stressful situations. Studies were conducted on professional drivers,15,16 house officers,17,18 or military troops.19 The visual, auditory, olfactory, and tactile systems of firefighters ought to be highly effective in order to perform their jobs well. Recent advances in neuroimaging methods have allowed researchers to study brain activity while executing various tasks.20–25 Interestingly, neuroimaging data suggest that the pattern of activity while undertaking attention tests differs after sleep deprivation compared to after “normal” sleep; increased activity was observed in the anterior cingulate and right prefrontal cortex during attention-switching tests after TSD.26 State Instability Hypothesis was proposed to explain variability in results of sustained attention tasks during TSD.27 It proposes that homeostatic drive for sleep, endogenous cues for wakefulness promotion, and the compensatory effort undertaken by the subject to perform affect greater variability in attention level dynamics.27
Sleep is considered as crucial in learning processes.28 However, the entire function of sleep is yet to be fully understood. Therefore, it is important to examine cognitive functioning in a group of participants whose usual role is to undertake tasks that require high levels of attention and short response times to environmental cues while maintaining high quality and as low as possible a number of committed errors. Moreover, in the case of firefighter, these actions are performed under TSD condition as their shifts usually last 24 hours. Therefore, the aim of this study was to examine the influence of sleep deprivation upon cognitive functioning in a group of firefighters.
Subjects and methods
Study group
The study included 60 volunteers – all of them were active male fire brigade officers working in fire brigade units in the Kujawsko-Pomorskie Voivodeship. Their age ranged from 23 to 50 years (Table 1). Interestingly, all participants had to pass fitness test to become professional firefighters, which is repeated annually. The study was approved by the Ethics Committee, Ludwik Rydygier Memorial Collegium Medicum in Bydgoszcz, Nicolaus Copernicus University, Torun, Poland. Written informed consent was obtained from all participants. Due to technical reasons, some data (n=5) were missing; therefore, data on 55 participants were analyzed in this study.
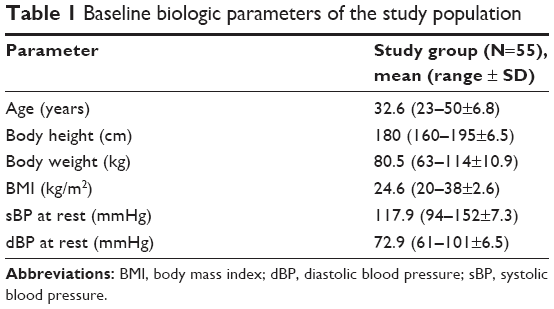 | Table 1 Baseline biologic parameters of the study population |
The subjects met the following criteria for enrollment into the study group: 1) active service as a fire brigade officer and 2) positively evaluated health status following a standard comprehensive physical examination. In addition to giving their voluntary consent to participate in the study, the main enrollment criteria included sex (males only were chosen to exclude potential role of menstrual cycle on the outcome), absence of comorbidity, and absence of reported sleep disorders (Pittsburgh Sleep Quality Index <5).29 The exclusion criteria consisted of factors that could possibly modify the response upon TSD: shift work, extreme morning/evening chronotype, any caffeine or alcohol taken during the study or within 12 hours before the test, drug dependence, participation in sports at a competitive level, receiving any medication/supplements during the study, and potential disorders of the cardiovascular system observed during the test experiment. Pretest of the subjects’ health state assessment included the basic neurologic, clinical examination and evaluation of the autonomic nervous system using the Autonomic Symptom Profile.30
Cognitive function measurement
To measure the cognitive function, the computerized battery test – Test Sprawności Operacyjnej (software version 4.6.0.44744, Speednet sp. z. o. o.,51 was used.31 The following tests were included: simple reaction time (SRT), choice reaction time (CRT), visual attention test (VAT); visual version of match to sample), and delayed matching to sample (DMS). SRT measures visual information processing speed, CRT is a decision-making test, VAT measures visual sustained attention, and DMS is a test of visual form of short-term memory test. Too fast, too slow, or inadequate (wrong or double-pressed key) responses are treated as an error in this battery. At the beginning of every test, text instruction is displayed until the participant confirms that he/she read it fully by pressing a “space” key on the keyboard. The type of the stimuli is randomly picked from one of five sets: geometric shapes, plant and animal shapes, arrows, letters, or numbers. Proper and distractor stimuli are randomly selected by the software before each trial; all are presented on a white background on 15.6″ screen.
SRT measures the reaction time to stimuli which appear 20 times at random intervals in the same place (center of the screen). “Space” button should be pressed as fast as possible on the stimulus; otherwise, one should refrain from reaction (go/no-go test). The test contains 75% of “go” stimuli relative to 25% of “no-go”; the stimuli are exposed in a random order. The “no-go” stimuli come from the same set as the desired (“go”) stimulus. The “go” stimulus is exposed before the tests start, until the participant confirms that he/she is ready to start to undertake the test by pressing a “space” key. Each participant has 3 seconds to react; otherwise, prolonged reaction is treated as an error.
CRT is very similar to SRT, except that CRT requires two-choice reaction for 30 trials. The “m” key on the keyboard is used to react as fast as possible on proper stimulus. Any other stimuli require pressing “z” as fast as possible. A wide range of distractors is used: some of them have only one distinctive feature compared to the actual target (eg, color or shape), while other distractors have more than one distinctive feature. Fifty percent of the stimuli are distractors, which are exposed in a random order. Each participant has 3 seconds to react; otherwise, prolonged reaction is treated as an error.
The VAT, like the CRT, requires two-choice reaction (“m” or “z” button). The stimuli are cards in the form of vertical rectangles, with each containing two symbols on it which are randomly selected from one of five sets. Participants have to quickly compare the five cards placed on the upper part of the screen with one card which appears at the center of the screen. If the card at the center is the same as one of the upper five cards, then the participant has to press “m” as fast as possible; otherwise, “z” button should be pressed. The whole set of upper cards on the screen is changed three times during each trial (three sets of 20 stimuli each, every set contains stimuli from a different category). Response longer than 3 seconds is classified as an error. Fifty percent of the stimuli are distractors, which are exposed in a random order.
DMS is very similar to VAT with the only one exception being the set of stimuli in the form of five cards on the upper part of the screen is exposed for 10 seconds and disappears. Then, at the center of the screen, one card appears at a time. Participants have to remember if this card was in the set of five cards on the upper part of the screen. If so, the correct response is to press “m”, otherwise “z” should be pressed. Participants have 3 seconds for the response; otherwise, lack of response is treated as an error. The whole set of upper cards on the screen is changed three times during each trial (three sets of 11 stimuli each, every set contains stimuli from a different category). There is 45.5% of distractors in overall 33 stimuli.
The whole battery test consists of subtests in the following order: SRT, CRT, SRT, VAT, DMS, and SRT. It is worth noting that the SRT test is repeated three times during the test. Overall, there is ~12 minutes interval between the start of the whole battery test and the start of the last SRT test. Moreover, there is ~2 minutes 20 seconds interval between the start time of the first and the second SRT tests. Therefore, the Test Sprawności Operacyjnej is a very elegant tool to measure the influence of cognitive fatigue on SRT performance through comparison of participants’ results in three subsequent attempts to SRT test. On the basis of meta-analysis,10 the results of simple visual task could be potentially the most suitable for the effects of TSD examination. We will use SRT_1, SRT_2, and SRT_3 abbreviations for simplicity.
Study protocol
The whole examination was performed in the chronobiology laboratory while maintaining constant conditions (constant routine; temperature 22°C, humidity 60%, light <10 lx). As Table 2 shows, subjects arrived at the laboratory at 07:30 am after they had their typical sleep at home the previous night (sleep prescribed by the participants and monitored by actigraphy, total sleep time=421.2±68.2 minutes) and stayed awake until 06:00 pm on the next day (Day 2), that is, for 31 hours. After a normal night of sleep (the rested state), the subjects underwent training in test procedures. Following arrival in the laboratory at 07:30 am on Day 2 (Day 1=typical sleep), the volunteers began regular cognitive testing throughout the sleep deprivation period, during which eight measurements of cognitive functioning were undertaken. The first two neuropsychological test performances (between 09:00 am and 01:00 pm) were treated as a “practice” to minimize the “practice effect”6 and therefore were not taken into the analysis. The next six measurements started from 04:00 pm–06:00 pm to the last time point at 04:00 pm–06:00 pm on the next day (Day 2). Trained staff were present to make sure that subjects would stay awake during the whole period of TSD. In between cognitive assessments, subjects were allowed to undertake most of the regular daily life activities (reading, writing, talking, and playing games). Subjects ate the same meals at the same time of day (8:00 am, 12:00 noon, 03:00 pm, 07:30 pm). Water (100 mL) was administered at hourly intervals during the protocol. Additionally, the device Actigraph GT3X was used during the experiment to monitor subjects’ sleep deprivation and motor activity to exclude the potential effect of increased physical activity during TSD on the measured outcome.32,33 The device is routinely used in children and in young people; in patients with cardiovascular, neurologic, or orthopedic disorders; and for diagnosing and treating sleep disorders.34,35
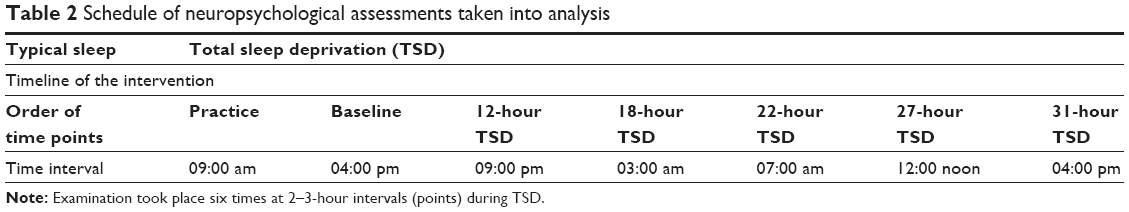 | Table 2 Schedule of neuropsychological assessments taken into analysis |
Statistical methods
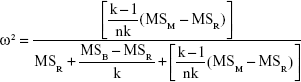
All statistical analyses were performed using statistical package (StatSoft, Inc. [2014], STATISTICA [data analysis software system], version 13.1. www.statsoft.com).52 Differences in the means of physical activity level between normal sleep and sleep deprivation were measured using dependent t-test for dependent samples. Data on the impact of sleep deprivation upon cognitive functioning were submitted to analysis of variance (ANOVA) with repeated measures and post hoc analysis using Bonferroni correction was applied. Mauchly’s test was used to check the assumption of sphericity, the Huynh–Feldt correction was applied, and the ε value and also the corrected value of degrees of freedom are reported where appropriate. Error bars on graphical representation of results indicate standard error. To calculate the overall effect size, the following equation for omega squared (ω2) was used.36 ω2 Value is reported in case of statistically significant results only. MSM is the mean square for the model, MSR is the residual mean square, MSB is the mean square between, k is the number of conditions in the experiment and n is the number of participants.
|
Results
All effects are reported as significant at p<0.05. Actigraph measurement revealed no significant differences in the physical activity of subjects between normal sleep and sleep deprivation: in the number of steps (384.8±240.0 vs 385.1±90.4, p>0.05), in the % of time spent on sitting (69.7±5.9 vs 69.7±3.0, p>0.05), in the % of slight activity (19.7±3.2 vs 21.1±2.1, p>0.05), in the % of moderate activity (7.2±3.1 vs 5.9±2.1), in the % of intensive activity (2.9±2.9 vs 3.5±1.1), and in the % of very intensive activity (0 vs 0.1±0.2, p>0.05).
Mean, min, max SD, and standard error values of every cognitive function subtests results (every attempt included) are provided in Table S1.
In the case of correct responses in SRT_2 test, Mauchly’s test indicated that the assumption of sphericity had been violated (χ2(14)=41.6, p<0.05); therefore, the degrees of freedom were corrected using Huynh–Feldt estimates of sphericity (ε=0.78). Repeated measures ANOVA confirmed that there was a significant effect of TSD on the number of correct responses in SRT_2 test (F[3.90, 210.64]=3.60, p=0.008, ω2=0.03). Bonferroni correction during post hoc analysis indicated significant difference in the number of correct responses between the first (04:00 pm) and the fifth (27th hour of TSD) time points in the second attempt of this test (Figure 1A). There were no statistically significant effects of TSD on errors committed in SRT_1 and SRT_3 tests (p>0.05).
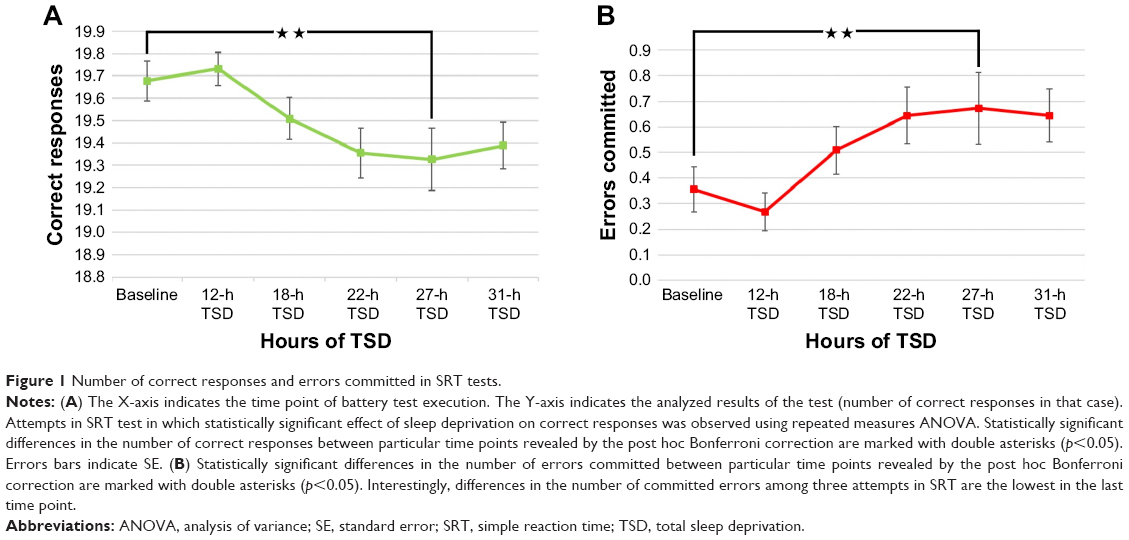 | Figure 1 Number of correct responses and errors committed in SRT tests. |
Moreover, the results showed that TSD significantly affected the number of errors committed in the SRT_2 test (ε=0.80, F[3.99, 215.57]=3.61, p=0.007, ω2=0.03). Bonferroni correction during post hoc analysis indicated significant difference in the number of correct responses between the baseline and 27th hour of TSD in the second attempt of this test (Figure 1B). There were no statistically significant effects of TSD on errors committed in SRT_1 and SRT_3 tests.
The reaction time in all (correct and incorrect) responses and the reaction time in correct responses in the SRT test were not significantly affected by the TSD (p>0.05; Figure 2A). Additionally, significant effect of TSD on the reaction time was observed in correct and all responses (Figure 2B) in the CRT test (ε=0.91, F[4.53, 244.67]=2.54, p=0.03, ω2=0.007 and ε=0.89, F[4.43, 239.26]=2.64, p=0.03, ω2=0.008, respectively).
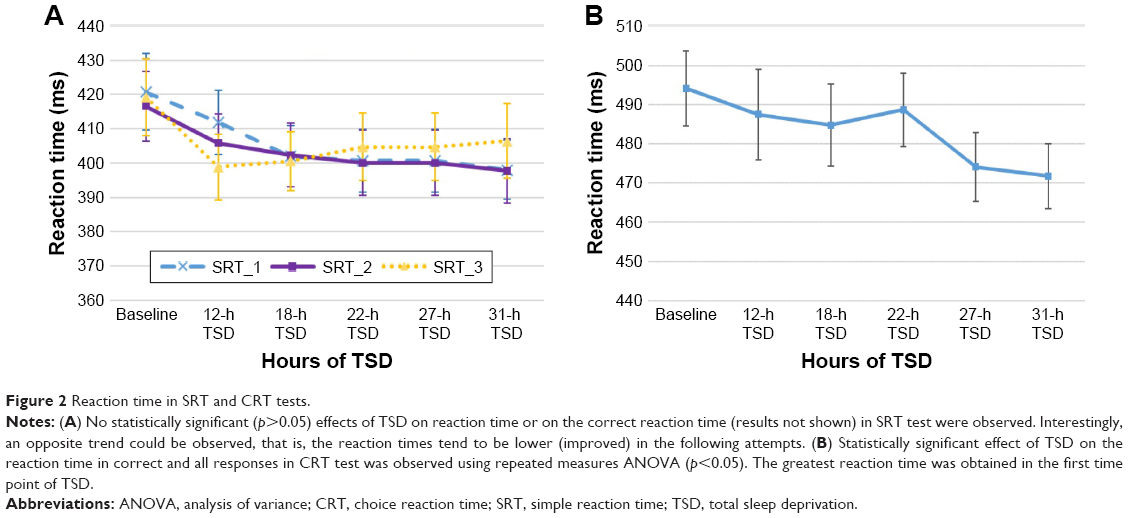 | Figure 2 Reaction time in SRT and CRT tests. |
In the case of the DMS test, statistically significant effect of TSD was observed in the number of committed errors (F[5, 270]=2.29, p=0.046, ω2=1.1; Figure 3); however, it was not observed in the case of correct responses (p>0.05). Bonferroni correction during post hoc analysis indicated no significant differences between time points in the case of errors committed or in the number of correct responses. The results showed that the reaction time in correct and all responses in DMS test were not significantly affected by the TSD (all results: p>0.05; data not shown).
 | Figure 3 Number of errors committed in delayed matching to sample (DMS) test. |
TSD significantly affected the subjects’ performance of the CRT test in the case of number of correct responses (F[5, 270]=3.63, p=0.003, ω2=0.02) and in the number of errors committed (ε=0.90, F[4.50, 242.94]=4.07, p=0.002, ω2=0.03; data not shown). Bonferroni correction revealed significant differences between the first and second time points and between the fourth and the last time points (Figure 4).
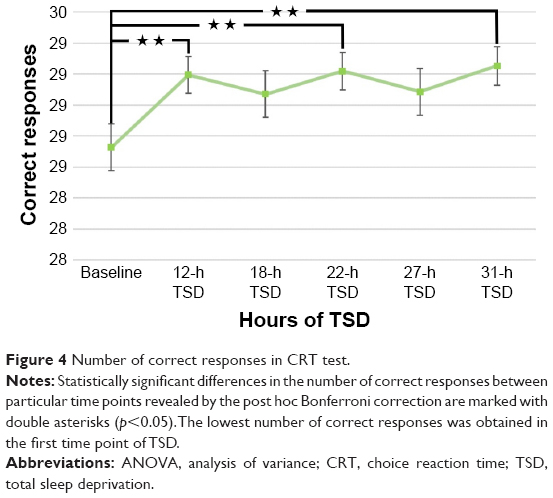 | Figure 4 Number of correct responses in CRT test. |
The effect of TSD on VAT reaction time and correct reaction time was observed (F[5, 270]=10.59, p<0.001, ω2=0.04; Figure 5 and F[5, 270]=9.87, p<0.001, ω2=0.04; data not shown, respectively). Bonferroni correction during post hoc analysis indicated significant differences in reaction time for all (Figure 5) and for correct responses (data not shown) between the baseline and the third, fourth, fifth, and the last time points, as well as between the second and the last two time points.
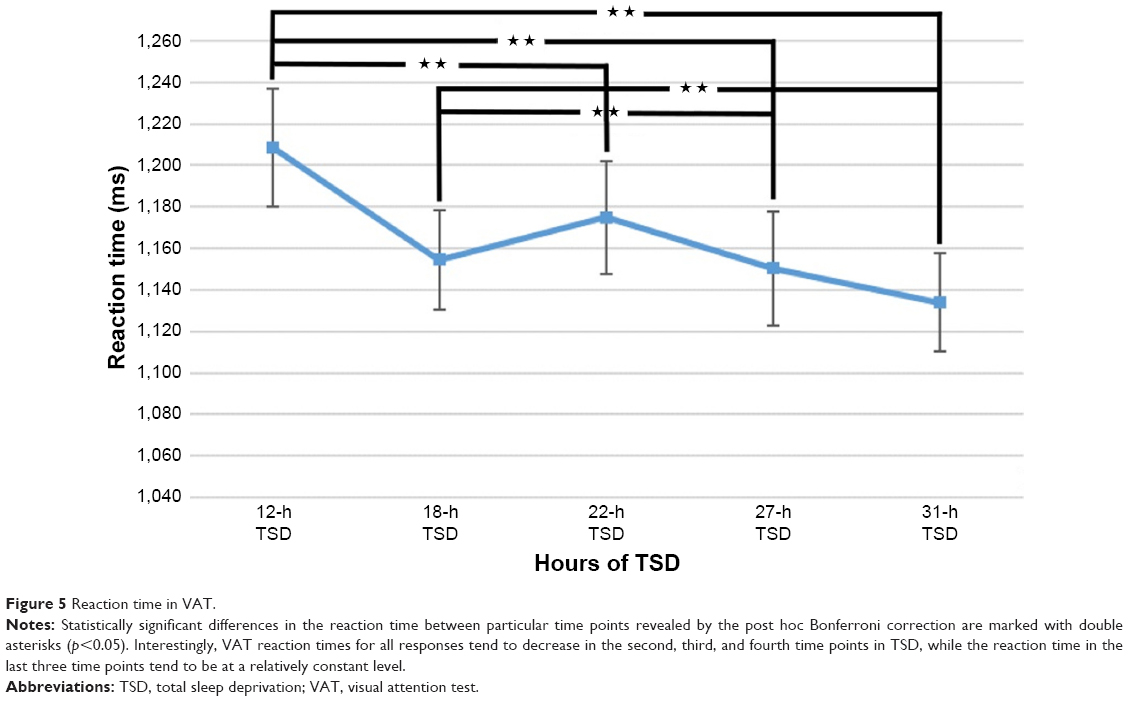 | Figure 5 Reaction time in VAT. |
Discussion
This study has shown significant overall differences between means of the number of errors and, consequently, the number correct responses in the second attempt of SRT (SRT_2) test during sleep deprivation. Worse results in terms of number of committed errors and correct responses, but not in the reaction time, are consistent with our assumptions that the effects of TSD will be manifest in the performance of the most repetitive test in terms of a trade-off model for speed or correctness of response.10 Interestingly, the number of errors increased noticeably after 12 hours of TSD and reached its peak at the 27th hour of TSD.
Moreover, our results showed an effect of TSD on the number of errors committed in DMS test. Interestingly, two “peaks” occurred in the number of errors during the study: late evening before deprived sleep (12th hour of TSD) and afternoon of the day after sleep deprivation (27th hour of TSD). This is in accordance with previous reports. In case of short-term memory tests which are based on recognition, statistically significant (p<0.01) combined effect size of TSD (-0.378) was reported.37 In contrast, moderate-range average effect sizes for complex attention and working memory tests were reported.37
Our study confirmed a completely inverse relation of the influence of TSD on cognitive functioning in the remaining subtests, which could be considered as more complex. Using repeated measures ANOVA with adjustment for Bonferroni post hoc correction, we confirmed that the sample group obtained better results in terms of the greater number of correct responses in the CRT test as well as a shorter reaction time for all responses (correct and error) and correct reaction time in the VAT during TSD. Graphical presentation showed that these results were improved during following time points of TSD. This is in accordance with the results of a previous meta-analysis,10 which confirmed that TSD has relatively less impact upon cognitive tests characterized by greater complexity. Moreover, the State Instability Hypothesis assumes that compensatory effort exerted by participants to get the best test results is one of the elements, which together with drive for sleep and endogenous circadian promotion of wakefulness affect cognitive lapses during TSD.27 The last element was controlled during the study by using constant routine protocol; however, increased patient motivation and greater control of drive for sleep due to adaptation to TSD because of the work pattern could potentially explain the observed results in group of firefighters. Our findings are consistent with the results of studies included in a previous systematic review.37 Firstly, it was noted that studies exploring the influence of TSD upon cognitive functioning did not show a large decline, probably because of compensation effects.37 This observation could be explained by enhanced self-drive and motivation of participants while undertaking cognitive testing. In our studies, based upon a constant routine protocol, participants had a limited variety of activities during sleep deprivation. Therefore, participants could perceive a ~5-hour interval between consecutive cognitive tests as boring, in contrast to the time of testing, which could be considered to be more exciting and could, in turn, immediately increase participants’ alertness.
It is worth mentioning the “flow” concept, which is an interesting as yet unexplored phenomena.38 It is tempting to state that cognitive tasks which are subjectively highly challenging (but not too demanding) and perceived as interesting could be executed with higher motivation. These authors showed that the combined effect size of TSD’s influence on simple attention and vigilance tasks was the largest among all the categories studied, which compares favorably with the results of our study. The SRT test could be perceived as the “easiest” and the “most boring” test; therefore, motivation of participants could be the lowest in this particular subtest.37 Such potential factors were noted in the late 70s during a series of studies on the effects of TSD39,40 and have been consequently repeated over decades.41 In recent years, various network theories have described patterns of brain activity while performing tasks. In the case of functional analysis during attention tests, there are sparse data regarding how the tactile system20 as well as the olfactory system function.
Results of a study on brain network functioning showed that subcortical and cerebellar network functioning in young TSD participants is similar to that in old patients under normal conditions.42 Authors conclude that TSD could serve as a model of cognitive aging in the above-mentioned networks.42 Moreover, TSD reduced selectivity in parahippocampal area and diminished firing of frontoparietal and ventral visual task-related areas could possibly lead to disturbances of selective and sustained attention, respectively.43 Changes in the level of single neuron activity in the medial temporal lobe preceding cognitive lapses under conditions of TSD were observed.44 Interestingly, sporadic short-term TSD events are rather not related to long-term maladaptation at the nervous system level.45 However, in a systematic review on the influence of sleep loss on driving performance in young drivers, half of the analyzed studies showed detrimental effects.46
Additionally, in the examination of visual processing changes during TSD, an important role of features such as visual angle and duration of being awake was underlined.47 Interestingly, it has been shown that groups of single neurons could be “asleep” in sleep deprivation (SD) condition, affecting the cognitive functioning negatively.48 Moreover, two different dynamic patterns on the cortical level, one occurring during wake and rapid eye movement sleep and the second one occurring during non-rapid eye movement sleep, have been reported.49
Practice effect was shown to be significant in tests without alternative version, while results of SRT test or CRT test tended to not differ in test–retest paradigm.50 Taking this into account, all of the subtests used in the above-mentioned studies should be relatively less vulnerable to the practice effect. Therefore, it can be assumed that two practice sessions that have been provided should be sufficient to minimize potential learning effect; however, its role could not be excluded.
Conclusion
To the knowledge of the authors, this study is the first one on the effects of TSD on cognitive functioning in a group of firefighters. Our results showed that not all of the examined cognitive domains were affected negatively by TSD; however, worse results in SRT test during TSD could translate into higher risk of committing a seemingly minor error during performing a firefighter routine and repetitive task, which in turn can result in substantial catastrophe. Therefore, further studies on firefighters should focus on development of methods which would be useful in prediction of cognitive lapse occurrence and in prevention. Moreover, the quantity of cognitive assessments and the time interval between them should be reconsidered in methodology of further studies on the effects of TSD. Probably, increasing number of assessments during acute SD could increase the chance that the observed changes in cognitive performance are caused by the effects of reinforced learning not by SD per se. In addition, the study protocol should allow to adjust obtained results by the effects of circadian rhythm.
Disclosure
The authors report no conflicts of interest in this work.
References
Robinson ES, Bills AG. Two factors in the work decrement. Can J Exp Psychol. 1926;9:415–443. | ||
Poffenberger AT. The effects of continuous mental work. Am J Psychol. 1928;12(5):459. | ||
Wilkinson RT. Effects of up to go hours’ sleep deprivation on different types of work. Appl Ergon. 1964;7:175–186. | ||
Manly T, Owen AM, McAvinue L, et al. Enhancing the sensitivity of a sustained attention task to frontal damage: convergent clinical and functional imaging evidence. Neurocase. 2003;9:340–349. | ||
Dinges DF, Kribbs NB. Performing while sleepy: effects of experimentally-induced sleepiness In: Monk TH, editor. Human Performance and Cognition. Sleep, Sleepiness and Performance. Oxford, UK: John Wiley & Sons; 1991;97–128. | ||
Harrison Y, Horne J. Sleep loss impairs short and novel language tasks having a prefrontal focus. J Sleep Res. 1998;7:95–100. | ||
Lo JC, Groeger JA, Santhi N, et al. Effects of partial and acute total sleep deprivation on performance across cognitive domains, individuals and circadian phase. PLoS One. 2012;7:e45987. | ||
Joo EY, Yoon CW, Koo DL, Kim D, Hong SB. Adverse effects of 24 hours of sleep deprivation on cognition and stress hormones. J Clin Neurol. 2012;8:146–150. | ||
Jung CM, Ronda JM, Czeisler CA. Comparison of sustained attention assessed by auditory and visual psychomotor vigilance tasks prior to and during sleep deprivation. J Sleep Res. 2011;20:348–355. | ||
Lim J, Dinges DF. A meta-analysis of the impact of short-term sleep deprivation on cognitive variables. Psychol Bull. 2010;136:375–389. | ||
Baulk SD, Reyner LA, Horne JA. Driver sleepiness–evaluation of reaction time measurement as a secondary task. Sleep. 2001;24:695–698. | ||
Drummond SP, Brown GG, Salamat JS, Gillin JC. Increasing task difficulty facilitates the cerebral compensatory response to total sleep deprivation. Sleep. 2004;27:445–451. | ||
Jackson ML, Croft RJ, Kennedy GA, Owens K, Howard ME. Cognitive components of simulated driving performance: sleep loss effects and predictors. Accid Anal Prev. 2013;50:438–444. | ||
Müller U, Steffenhagen N, Regenthal R, Bublak P. Effects of modafinil on working memory processes in humans. Psychopharmacology (Berl). 2004;177:161–169. | ||
Stoohs RA, Guilleminault C, Itoi A, Dement WC. Traffic accidents in commercial long-haul truck drivers: the influence of sleep-disordered breathing and obesity. Sleep. 1994;17:619–623. | ||
McCartt AT, Rohrbaugh JW, Hammer MC, Fuller SZ. Factors associated with falling asleep at the wheel among long-distance truck drivers. Accid Anal Prev. 2000;32:493–504. | ||
Marcus CL, Loughlin GM. Effect of sleep deprivation on driving safety in housestaff. Sleep. 1996;19:763–766. | ||
Steele MT, Ma OJ, Watson WA, Thomas HA, Muelleman RL. The occupational risk of motor vehicle collisions for emergency medicine residents. Acad Emerg Med. 1999;6:1050–1053. | ||
Tharion WJ, Shukitt-Hale B, Lieberman HR. Caffeine effects on marksmanship during high-stress military training with 72 hour sleep deprivation. Aviat Space Environ Med. 2003;74:309–314. | ||
Langner R, Eickhoff SB. Sustaining attention to simple tasks: a meta analytic review of the neural mechanisms of vigilant attention. Psychol Bull. 2013;139(4):870–900. | ||
Nachev P, Kennard C, Husain M. Functional role of the supplementary and pre-supplementary motor areas. Nat Rev Neurosci. 2008;9:856–869. | ||
Hasselmo ME, Sarter M. Modes and models of forebrain cholinergic neuromodulation of cognition. Neuropsychopharmacology. 2011;36:52–73. | ||
Åkerstedt T, Gillberg M. Subjective and objective sleepiness in the active individual. Int J Neurosci. 1990;52:29–37. | ||
Lafrance C, Dumont M. Diurnal variations in the waking EEG: comparisons with sleep latencies and subjective alertness. J Sleep Res. 2000;9:243–248. | ||
Shenhav A, Botvinick MM, Cohen JD. The expected value of control: an integrative theory of anterior cingulate cortex function. Neuron. 2013;79:217–240. | ||
Ptak R. The frontoparietal attention network of the human brain action, saliency, and a priority map of the environment. Neuroscientist. 2012;18:502–515. | ||
Drummond S, Gillin JC, Brown GG. Increased cerebral response during a divided attention task following sleep deprivation. J Sleep Res. 2001;10:85–92. | ||
Maquet P. The role of sleep in learning and memory. Science. 2001;294:1048–1052. | ||
Buysse DJ, Reynolds CF, Monk TH, Berman SR, Kupfer DJ. The Pittsburgh Sleep Quality Index: a new instrument for psychiatric practice and research. Psychiatry Res. 1989;31:193–213. | ||
Suarez GA, Opfer-Gehrking TL, Offord KP, Atkinson EJ, O’brien PC, Low PA. The autonomic symptom profile a new instrument to assess autonomic symptoms. Neurology. 1999;52:523–528. | ||
Dąbrowiecki Z, Ejsmont R. Zastosowanie testu sprawności operacyjnej (TSO) do wykrywania obniżenia zdolności do wykonywania pracy w warunkach wysokiej odpowiedzialności. Dwunasta konferencja Polskiego Towarzystwa Medycyny i Techniki Hiperbarycznej; Lidzbark Warmiński; 04–05 December 2010. | ||
Santos-Lozano A, Santin-Medeiros F, Cardon G, et al. Actigraph GT3X: validation and determination of physical activity intensity cut points. Int J Sports Med. 2013;34:975–982. | ||
ActiGraph R&D and Software Departments. ActiLife Users Manual. Pensacola, FL, USA: ActiGraph; 2009. | ||
Tweedy SM, Trost SG. Validity of accelerometry for measurement of activity in people with brain injury. Med Sci Sports Exerc. 2005;37:1474–1480. | ||
Tryon WW. Issues of validity in actigraphic sleep assessment. Sleep. 2004;27:158–165. | ||
Field A. Discovering Statistics Using SPSS. London. Sage publications; 2009:478. | ||
Harrison Y, Horne JA. The impact of sleep deprivation on decision making: a review. J Exp Psychol Appl. 2000;6:236–249. | ||
Csikszentmihalyi M, LeFevre J. Optimal experience in work and leisure. J Pers Soc Psychol. 1989;56:815–822. | ||
Kjellberg A. Effects of sleep deprivation on performance of a problem-solving task. Psychol Rep. 1975;37:479–485. | ||
Kjellberg A. Sleep deprivation and some aspects of performance: I. Problems of arousal changes. Waking Sleeping. 1977;1:139–143. | ||
Harrison Y, Horne JA. One night of sleep loss impairs innovative thinking and flexible decision making. Organ Behav Hum Decis Process. 1999;78:128–145. | ||
Posner MI, Petersen SE. The attention system of the human brain. Annu Rev Neurosci. 1990;13:25–42. | ||
Petersen SE, Posner MI. The attention system of the human brain: 20 years after. Annu Rev Neurosci. 2012;35:73–89. | ||
Mouton PR, Pakkenberg B, Gundersen HJ, Price DL. Absolute number and size of pigmented locus coeruleus neurons in young and aged individuals. J Chem Neuroanat. 1994;7:185–190. | ||
Devilbiss DM, Waterhouse BD. Norepinephrine exhibits two distinct profiles of action on sensory cortical neuron responses to excitatory synaptic stimuli. Synapse. 2000;37:273–282. | ||
Sara SJ. The locus coeruleus and noradrenergic modulation of cognition. Nat Rev Neurosci. 2009;10:211–223. | ||
Howells FM, Stein DJ, Russell VA. Synergistic tonic and phasic activity of the locus coeruleus norepinephrine (LC-NE) arousal system is required for optimal attentional performance. Metab Brain Dis. 2012;27:267–274. | ||
Paukert M, Agarwal A, Cha J, Doze VA, Kang JU, Bergles DE. Norepinephrine controls astroglial responsiveness to local circuit activity. Neuron. 2014;82:1263–1270. | ||
Meisel C, Klaus A, Vyazovskiy VV, Plenz D. The interplay between long-and short-range temporal correlations shapes cortex dynamics across vigilance states. J Neurosci. 2017;18;37(42):10114–24. | ||
Lemay S, Bédard MA, Rouleau I, Tremblay PL. Practice effect and test-retest reliability of attentional and executive tests in middle-aged to elderly subjects. The Clin Neuropsychol. 2004;1;18(2):284–302. | ||
Biostat.com.pl [homepage on the Internet]. Rybnik: Biostat Sp. z o.o.. Available from: http://www.biostat.com.pl/news/nowa_aplikacja_tso_stat_-181.php/. Accessed March 10, 2018. | ||
statsoft.com [homepage on the Internet]. Palo Alto: TIBCO Software Inc., Available from: http://www.statsoft.com/Products/STATISTICA-Features/. Accessed March 10, 2018. |
Supplementary material
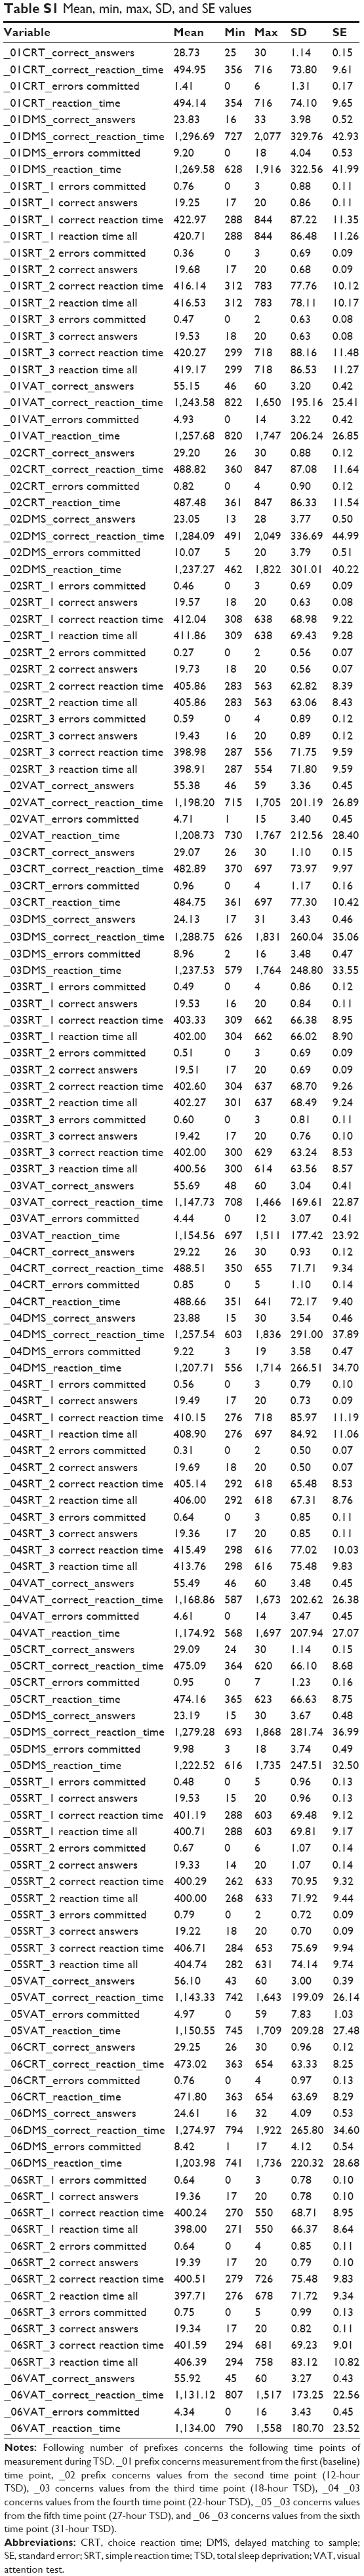 | Table S1 Mean, min, max, SD, and SE values |
 © 2018 The Author(s). This work is published and licensed by Dove Medical Press Limited. The
full terms of this license are available at https://www.dovepress.com/terms
and incorporate the Creative Commons Attribution
- Non Commercial (unported, 3.0) License.
By accessing the work you hereby accept the Terms. Non-commercial uses of the work are permitted
without any further permission from Dove Medical Press Limited, provided the work is properly
attributed. For permission for commercial use of this work, please see paragraphs 4.2 and 5 of our Terms.
© 2018 The Author(s). This work is published and licensed by Dove Medical Press Limited. The
full terms of this license are available at https://www.dovepress.com/terms
and incorporate the Creative Commons Attribution
- Non Commercial (unported, 3.0) License.
By accessing the work you hereby accept the Terms. Non-commercial uses of the work are permitted
without any further permission from Dove Medical Press Limited, provided the work is properly
attributed. For permission for commercial use of this work, please see paragraphs 4.2 and 5 of our Terms.