Back to Journals » Patient Preference and Adherence » Volume 12
The evaluation of pharmaceutical pictograms among elderly patients in community pharmacy settings – a multicenter pilot study
Authors Merks P ![]() , Świeczkowski D, Balcerzak M
, Świeczkowski D, Balcerzak M ![]() , Drelich E, Białoszewska K
, Drelich E, Białoszewska K ![]() , Cwalina N, Krysinski J
, Cwalina N, Krysinski J ![]() , Jaguszewski M, Pouliot A, Vaillancourt R
, Jaguszewski M, Pouliot A, Vaillancourt R
Received 27 August 2017
Accepted for publication 28 November 2017
Published 14 February 2018 Volume 2018:12 Pages 257—266
DOI https://doi.org/10.2147/PPA.S150113
Checked for plagiarism Yes
Review by Single anonymous peer review
Peer reviewer comments 2
Editor who approved publication: Dr Johnny Chen
Piotr Merks,1,2,* Damian Świeczkowski,3,* Marcin Balcerzak,4 Ewelina Drelich,4 Katarzyna Białoszewska,5 Natalia Cwalina,3 Jerzy Krysinski,1 Miłosz Jaguszewski,3 Annie Pouliot,6 Regis Vaillancourt6
1Department of Pharmaceutical Technology, Collegium Medicum in Bydgoszcz, Nicolaus University in Torun, Bydgoszcz-Torun, Poland; 2Piktorex Sp. z.o.o., Warsaw, Poland; 3First Department of Cardiology, Medical University of Gdansk, Gdansk, Poland; 4Farenta Polska, Warsaw, Poland; 5Department of Medical Psychology, Medical University of Warsaw, Warsaw, Poland; 6Children’s Hospital of Eastern Ontario, Ottawa, ON, Canada
*These authors contributed equally to this work
Introduction: The search for new ways to optimize the use of medications by patients has led the pharmaceutical community to promote the idea of introducing pictograms into routine practice. The main intention of pictograms is to ease patient adherence and to reduce potential risks or errors associated with the use of medications.
Purpose: To evaluate a series of pharmaceutical pictograms for patient comprehension.
Patients and methods: The study was conducted in community pharmacies within a European Union country that belongs to the professional research network. Structured interviews were used to evaluate the pictograms for patient comprehension. This consisted of an assessment of the following: the transparency and translucency of the pictograms, health literacy, and pictogram recall. Participants were also given the opportunity to provide feedback on how to improve the pictograms. The primary endpoint was pictogram comprehension. Secondary outcomes included recall of the pictograms and pictogram translucency.
Results: The study included 68 patients with whom face-to-face interviews were performed. Low transparency results (≤25%) and extensive patient feedback in initial interviews led to the withdrawal of certain pictograms (n=15) from the evaluation. Among the pictograms included in the final stage of our research, 22 pictograms (62.8%) obtained an acceptable transparency level ≥66%. All pictograms passed the short-term recall test with positive results.
Conclusion: A majority of the designed and modified pictograms reached satisfactory guessability scores. Feedback from patients enabled modification of the pictograms and proved that patients have an important voice in the discussion regarding the design of additional pictograms.
Keywords: pharmaceutical pictograms, elderly population, health literacy, community pharmacy, Poland
Introduction
Medication use instructions, such as the leaflets accompanying medicinal products, are often written at a high readability level. This can lead to the misuse of certain medications, low treatment adherence, and as a result, inferior treatment outcomes.1–3 It is not surprising that the current trend observed in scientific research conducted in the area of social pharmacy is to seek tools that can optimize the use of medications, especially among patients with low health literacy, including geriatric patients and the chronically ill.4,5
One of the methods used to increase the degree of understanding of drug-related information is through the use of pharmaceutical pictograms. Pictograms consist of appropriately designed visual forms of health-related information illustrating various aspects associated with the use of medicines, for example, the dosage, form of medication, or specific precautions.6 Clear and easily understood pictograms or infographics should be included as part of each drug information leaflet, as they have been shown by multiple studies to have the potential to improve comprehension and the patient’s recall of drug-related information. Pictograms, if well developed and validated, have a real potential to support health literacy.4,7 Katz et al, in a review of the literature, showed that pictograms, when used in combination with a simple explanation, significantly improved patient comprehension of medication use instructions.7 Montagne provided recommendations aimed at improving the evaluation of pictograms. For instance, 1) pictograms should be shown to patients in random order; 2) the interviewers should collect patient feedback as it is crucial in improving the quality of pictograms; and finally, 3) each session should not exceed 60 minutes and include no more than 50 pictograms.8 Pictograms should not be used as the sole method of instructing patients about their medications. Good Labeling and Minimum Labeling, as suggested by the International Pharmaceutical Federation, should be used at all times, even when no national guidelines are available.9
Validation is not only necessary but also plays a very important role, as the degree of understanding regarding the pictograms may be different among various cultural and social groups. It is essential to carry out the validation process within the patient group which will ultimately use the pictograms.10,8
The aim of this study was to evaluate and adapt a series of pharmaceutical pictograms among Polish patients in the setting of a community pharmacy practice. The selected pictograms from this study that have achieved satisfactory parameters will then be extensively evaluated in further research. This research is the initial step in a complex research project whose aim is to introduce pictograms into routine community pharmacy practice in the context of the Polish health care system.
Patients and methods
Settings
Evaluation of the pharmaceutical pictograms (step 1) was carried out in August 2016 in five community pharmacies located in four different regions of Poland. Each pharmacy was a participant in the research network “Farenta Polska”.11 Eligible patients ≥65 years, whose health allowed them to participate in the 25-minute structured one-on-one interviews, took part in the research. Exclusion criteria of the study included the occurrence of dementia or other significant cognitive disorders. Patients were identified by qualified interviewers (a qualified pharmacist trained in the study protocol by Farenta Polska) based on their knowledge and expertise. Interviewers assessed the eligibility of the patient for participation, subsequently qualifying or disqualifying the patient for the study. Each patient then gave informed verbal consent for their participation in the research study. Prior to initiating the research interview, the patient was informed about the nature and purpose of the use of pictograms and the course of the research. Patients were financially compensated for their time while participating in the study.
This study was approved by the Ethics Committee at the Collegium Medicum in Bydgoszcz, Poland, which is part of the Nicolaus University located in Torun, Poland.
Study design
Each interview consisted of four parts: a pictogram transparency test; an evaluation of the translucency of the drug-related information that was presented on the pictograms, with simultaneous collection of patient feedback on the possible modifications to the pictograms; a health literacy assessment; and finally, a recall test.12 The collected sociodemographic data included the patient’s year of birth, sex, level of education completed, and place of residence. The responses were collected via an electronic system.
In the first stage of evaluation, patients were asked to imagine that the pictograms shown to them were displayed on the packaging of a medicinal product. They were then asked to guess the pictogram’s meaning (their understanding of the image/transparency/guessability). Each interview included testing of 12 pictograms. All of the pictograms were presented to each patient in random order. Each pictogram was printed on a single A4 page in black and white. Data were evaluated by three independent consultants, who, on the basis of the patient’s recorded narration, classified the patient’s response into one of the following five categories: correct answer, partially correct answer, incorrect answer, opposite answer, and I don’t know/I can’t guess. According to the International Organization for Standardization (ISO), the standard to test the comprehensibility of graphical symbols, ISO 9186, provides a measure of the extent to which a pictogram communicates its intended message.13 Pictograms should be understood by more than 66% of the participants to be considered as validated.13 The next stage of the evaluation consisted of assessing the translucency of the information. Prior to this step, each participant was informed about the proper meaning of the shown pictogram. In the context of medical information, translucency is the degree to which, in the interviewed person’s opinion, the image corresponds to its intended meaning.12 Each patient used a scale ranging from 1 to 7 to assess the extent to which in his/her view the image corresponded to its intended meaning, as described ealier.12 For this purpose, an analog scale was used, where 1 was described as a complete lack of correlation and 7 a very strong correlation. Achievement of a result >5 in the evaluation of the pictogram transparency was set as the minimum acceptable level of the correlation between the image and its meaning. Upon completion of the assessments of transparency and translucency, each patient could comment on how to improve the pictogram to better reflect the intended meaning. The patient’s suggestions were recorded by the interviewer in the Farenta Polska system simultaneously with the assessment of transparency. This information will be used in subsequent stages of the research, primarily to improve pictograms that did not receive satisfactory results during the evaluation process. As part of the study, a health literacy test was then performed. Farenta Polska received permission to use the Polish version of the Newest Vital Sign UK questionnaire.14 The final element of the evaluation was a recall test. After completing the health literacy test, patients were asked to recall the meaning of the pictograms shown earlier. Pictograms were again displayed randomly as in the previous stage of this evaluation during transparency testing. The aim of this test was to assess the short-term memory of patients participating in the study. Patients’ responses were categorized into one of the following categories: correct answer, partially correct, incorrect, reverse answer, or “I do not know”.
After each evaluation session, the obtained data were analyzed in order to identify trends in the guessability tests (the percentage of pictograms able to be guessed by the participant) and in patient feedback on how to further modify the pictograms. If the meaning of a pictogram or family of pictograms was not correctly guessed by the majority of patients, a decision was made to discontinue its further evaluation and to introduce changes to the pictogram by members of the research group. If the meaning of a pictogram or group of pictograms was guessed correctly by the majority of patients (≥90%), it was decided to reduce the frequency of its presentation to patients in order to increase the intensity of evaluation of the other pictograms (including the newly modified pictograms).
Results
Characteristics of the study population
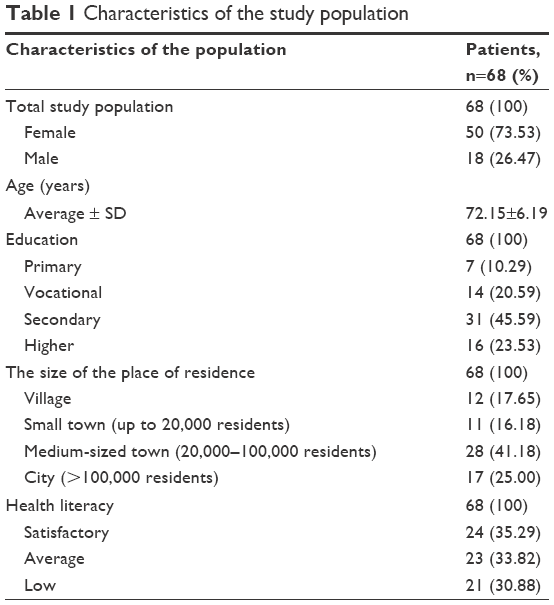
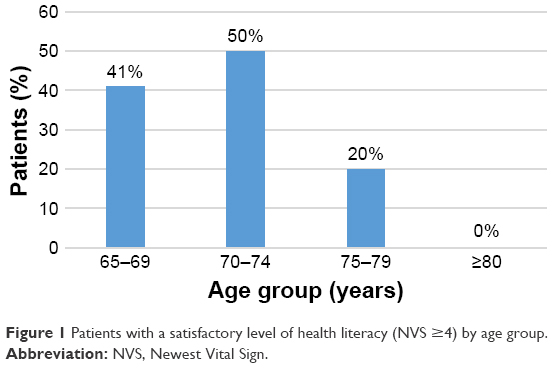
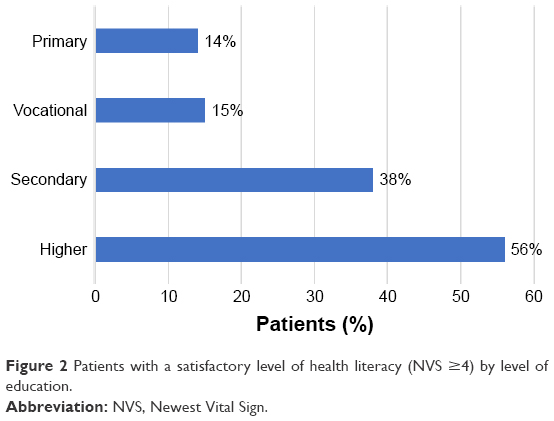
The research study included 68 patients from five different pharmacies in the Mazowieckie, Małopolskie, Opolskie (n=2), and Pomorskie provinces in Poland. The study population consisted mostly of women (73.53%), individuals with a secondary education (45.59%), and residents from medium-sized towns (41.18%). Health literacy was defined as satisfactory in 35.29% of participants and average in 33.82% of cases. Due to the exclusion criteria (memory problems), one patient was disqualified from participating in the research study. The detailed characteristics of the study population are summarized in Table 1 and Figures 1 and 2.
 | Table 1 Characteristics of the study population |
 | Figure 1 Patients with a satisfactory level of health literacy (NVS ≥4) by age group. |
 | Figure 2 Patients with a satisfactory level of health literacy (NVS ≥4) by level of education. |
Evaluation of pharmaceutical pictograms
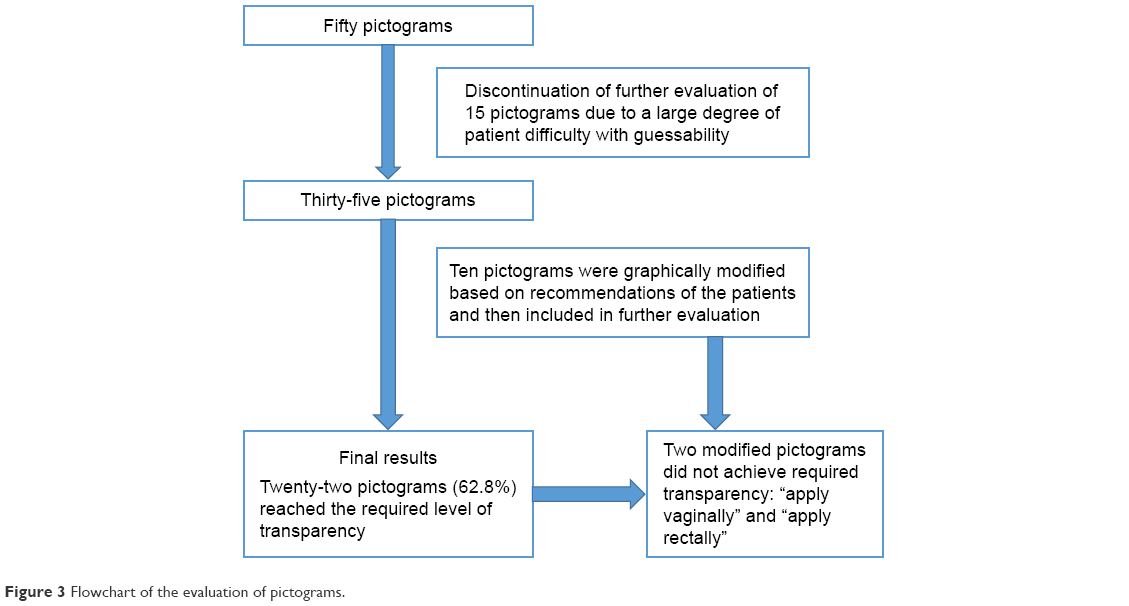
The study included 68 patients with whom face-to-face interviews were performed with the aim of pictogram evaluation. In the beginning of our research, we included 50 pictograms in the validation process. After data analysis of the first 11.5% of interviews, a decision was made to discontinue further evaluation of 15 pictograms due to a large degree of patient difficulty with guessability (Supplementary materials). This change was agreed upon between all investigators. Extensive feedback from the research participants enabled or allowed future redesign of these withdrawn pictograms. Among the 35 pictograms included in the final stage of the study, 10 were modified in direct cooperation with the graphic designers initially involved in designing the study’s pictograms. These 35 pictograms were then evaluated on the basis of constant analysis of the collected data. This led to alterations of the selection of material for further processing. Twenty-two pictograms (62.8%) were guessed correctly by ≥66% of the patients. Thirteen pictograms (37.2%) did not reach the required level of transparency. Among the newly modified pictograms, the vast majority achieved satisfactory transparency, with only two pictograms guessed incorrectly by the required percentage of participants (“apply vaginally” and “apply rectally”). All pictograms passed the short-term memory recall test. Figure 3 presents the flowchart of the evaluation process. Table 2 summarizes the results of the successful evaluation of pictograms, arranged from the highest to lowest scores in the guessability test.
 | Figure 3 Flowchart of the evaluation of pictograms. |
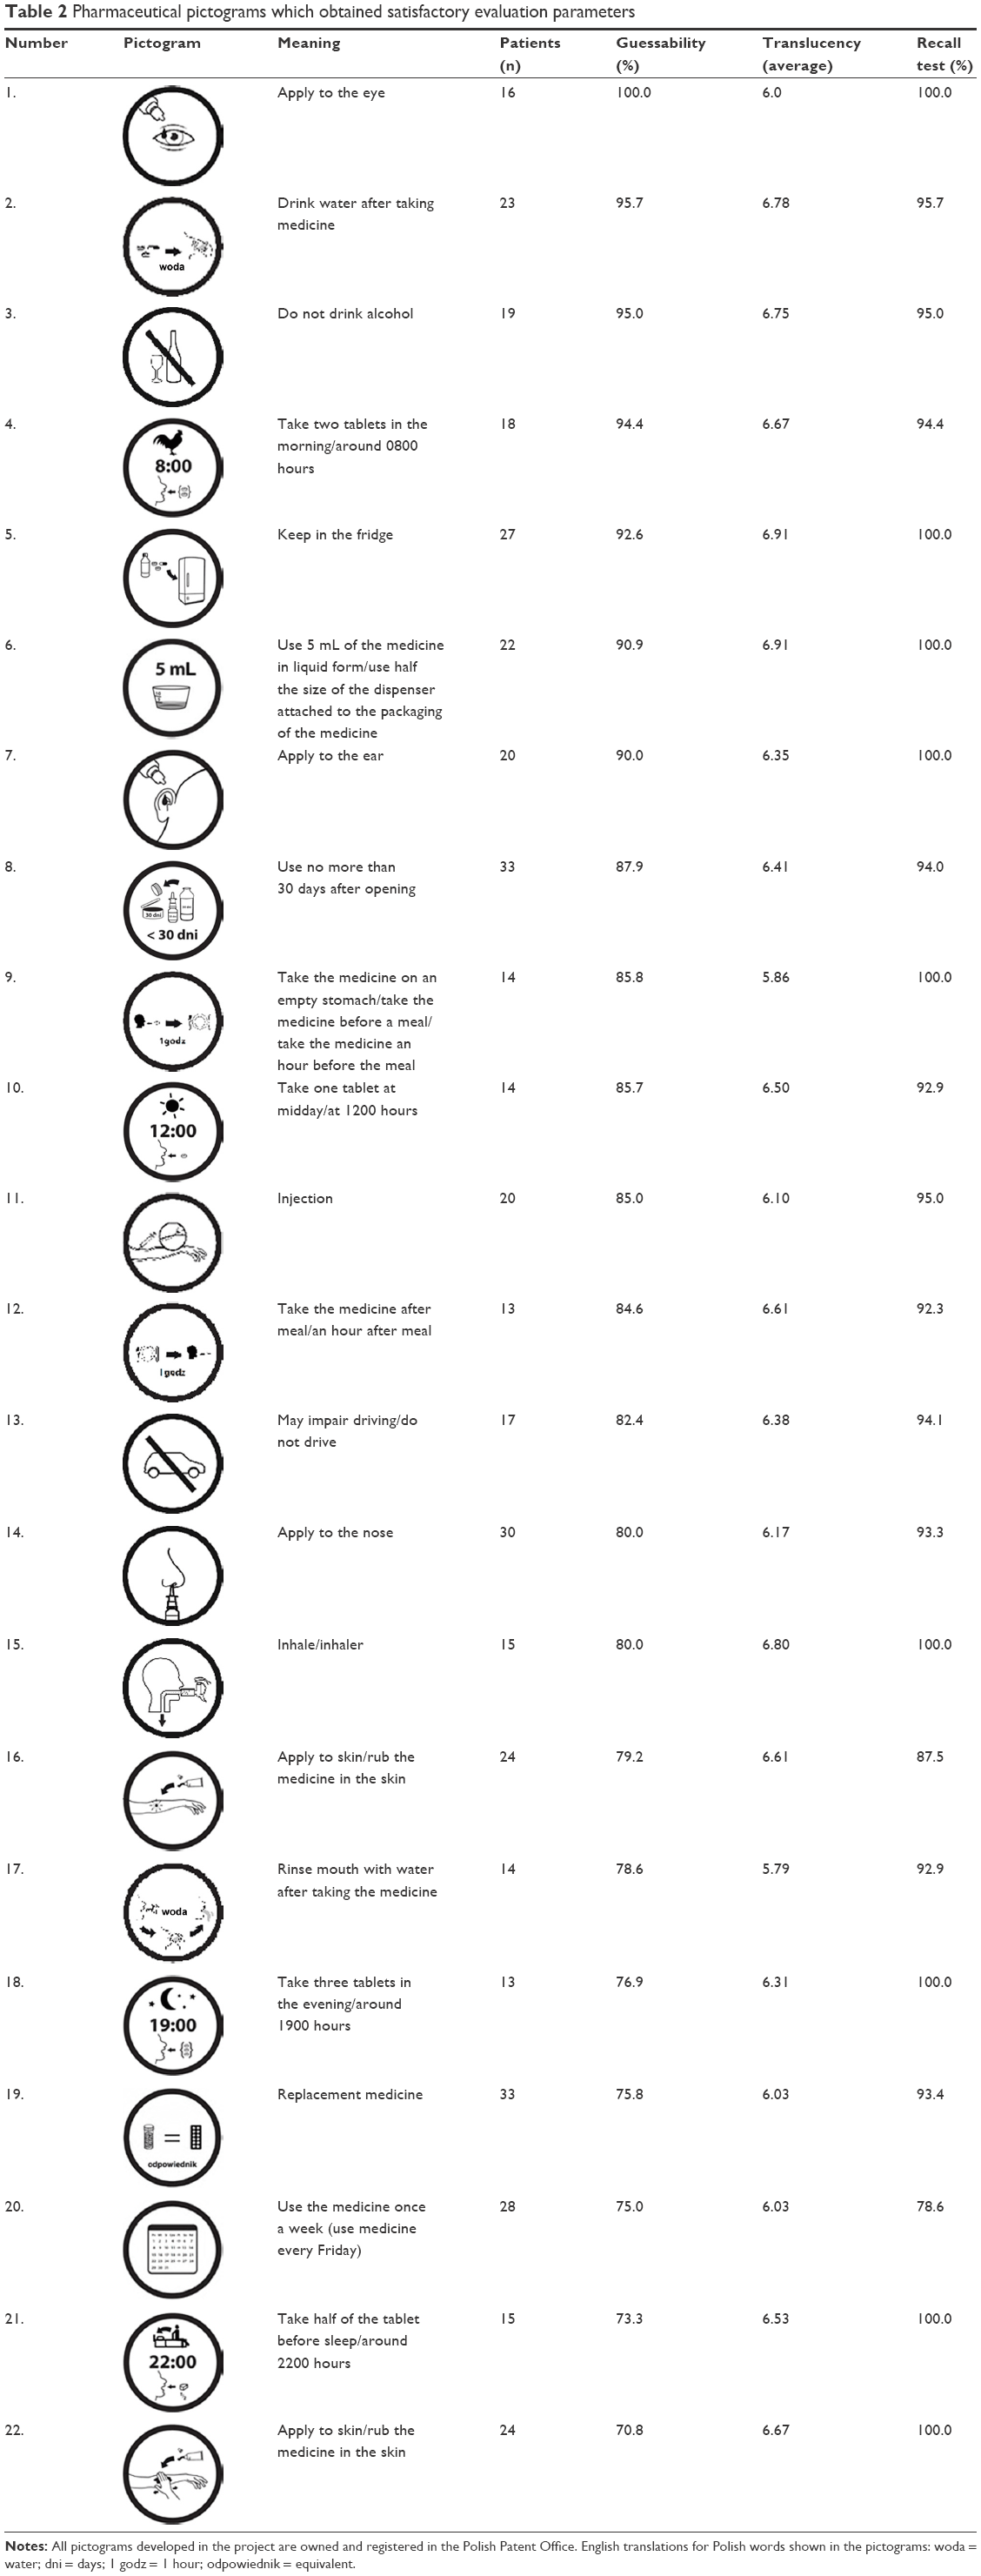 | Table 2 Pharmaceutical pictograms which obtained satisfactory evaluation parameters |
Modification of pharmaceutical pictograms
The pictogram containing the medical information “use 5 mL liquid form of the medicine/use half the size of the dispenser attached to the packaging of the medicine” (pictogram 1 in Supplementary materials) was modified during the course of our research. After the first series of interviews, based on the patients’ comments, a three-dimensional image of the dispenser was used, as it allowed for better indication of the liquid form of the medicine. A scale was also added to the image of the dispenser. It should be noted that in some cases, modifications suggested by the patients did not result in a satisfactory transparency improvement. This especially concerned the pictograms “apply vaginally” (pictogram 12 in Supplementary materials), requesting a more detailed illustration of the place of application, and “apply rectally” (pictogram 13 in Supplementary materials), illustrating the place of application in such way so as to not confuse it with vaginal application. Simple pictograms conveying messages about the number of tablets to be taken (use 1, 2, and 3 tablets) and the specific time of taking the medication (in the morning, at noon, in the evening, before sleep) were seen as confusing, and patients often requested to combine the information about the number of tablets and their time of use. Redesigned pictograms contained information about both the time of day a medication should be taken as well as the number of tablets in a single dose. These modified pictograms passed patient evaluation successfully. With regard to the pictogram “applied to the skin” (pictogram 14 in Supplementary materials), the symbol of a tube was added to indicate that the medication is an ointment/cream/gel or other form of medicine which is to be rubbed into the skin. In some cases, a combination of graphical design and written information was used to improve transparency.
One suggestion was to include additional written information to aid in explaining the meaning of the pictogram, as in the pictogram “take half of a tablet before sleep” (pictogram 7 in Supplementary materials) or “use the medicine once a week” (pictogram 3 in Supplementary materials). A different suggestion was to change the shape of the body shown in the pictogram to make it present the sex of a person more clearly, which research participants considered important in the case of vaginal medications. There were also numerous suggestions to introduce color into the pictograms. The patients’ suggestions are shown in the Supplementary materials. Additionally, pictograms that obtained unsatisfactory results in our evaluation have patient remarks included in the Supplementary materials with the aim of their use in later stages of the research project.
Discussion
This research is one of the first attempts to evaluate pictograms in countries where the role of the pharmacist is limited solely to dispensing medicines and pharmaceutical care is a rarity. In Poland, many changes in pharmacy practice are taking place, including intensified efforts to disseminate pharmaceutical care, the introduction of advanced pharmaceutical services into the routine community pharmacy practice, and the implementation of a medicine use review. Such changes show that this study is particularly relevant and constitutes an important voice in the discussion about modern pharmaceutical services. The first fundamental result of this research is the evaluation of 22 pharmaceutical pictograms that can now be introduced into pharmaceutical practice or subjected to further validation in selected cohorts of patients, for example, patients over the age of 80, or in patients with a specific chronic disease, for example, cardiovascular diseases. This research, thanks in part to the patients’ various suggestions, enabled modification of the pictograms which did not obtain satisfactory results initially, and thus, they can be subject to further validation in the future. The evaluation method, in addition to providing scientific evidence confirming the credibility of the messages shown within the pictograms, also enables collection of feedback from the participants, which leads to potential modification of certain images. A unique support throughout the process was the use of new technologies and devices such as smartphones to aid in information gathering, as seen in the Wolpin et al’s research.15
In recent years, there has been a growing interest in the use of images as an alternative and/or complementary source of medical information. Studies show that the introduction of images to medication leaflets increases the level of patient safety, supplements the information available in the text, and improves understanding of medical information.16,17 Analogous conclusions can be drawn from Ng et al where geriatric patients preferred written information that was supplemented with pictograms, which significantly increased their ability to understand and memorize the relevant medical information.18 It is worth noting that pictograms can provide support not only in the case of leaflets added to medicinal products, but also via other forms of drug-related information, including highly specialized information, or the one dedicated to patients with specific health needs, for example, dialysis patients.19,20 A recently published study proved that pictograms have a significant role in preventing dosing errors.21 Chan et al investigated studies aimed at using pictograms as a tool to reduce errors during liquid medication administration and concluded that pictograms may be beneficial for patients; however, undoubtedly, further high-quality research is warranted.22
In our study, satisfactory results were obtained for 22 out of 50 pictograms (44.0%). This result is poorer than the results seen in research conducted among Canadian patients.12 This outcome may be due to differences in the level of patient health literacy as well as the specifics of the national health care systems. Better results in guessability were achieved in the validation of pictograms among patients diagnosed with type 2 diabetes.23 Moreover, in our study, modification or redesigning of certain pictograms contributed to an improvement in the transparency of the pictograms, which has also been observed in the study conducted by Mok et al.24 The search for ways to improve the designed pictograms within the semiotic analysis is currently taking place, but only further validations performed with the Polish patient population will enable us to determine image elements that can raise the pictograms’ transparency/translucency in the future.15,25
This research provides both practical implications and recommendations for future research. Whenever possible, pictograms should be accompanied by a short text explaining the pictogram, to support its understanding as well as the memorization of medical information. Good results obtained in the recall tests of previously seen pictograms may mean that when the same image is used in the future, it will lead to the recall of specific drug-related information. Based on the feedback obtained from the patients in our study, round frames should be removed from the pictograms as they can resemble prohibitory traffic signs. This similarity could lead to the pictograms being read inversely to their intended meaning. Such framing should be used only in warning pictograms (eg, for precautions, or adverse results). Pictograms should be colorful to draw the patients’ attention to them. The use of color may allow some elements to be better displayed (eg, the color of cheese or fruit). The colors used in pictograms should be determined individually; however, their use can be consistent with, for example, the colors used for traffic signs.
Unsuccessful validation can be due to various reasons. Elderly patients have vastly different life experiences and can interpret pictograms based on their current health situation.26 Two pictograms were inappropriately deemed by patients as relevant to the elderly population. The pictogram “be cautious while using in pregnancy” was often misinterpreted, with elderly patients focusing more on the curved back and the hand placed there (Supplementary materials) rather than on the baby bump. Many patients stated that a hand placed on the back must indicate back pain. Another pictogram, showing the proper way to use a sublingual tablet, was misinterpreted as an action maintaining dental hygiene with regard to dentures (Supplementary materials).
This study has some limitations due to the nature of research carried out in community pharmacies in Poland. These include limited access to the patient’s medical records. Assessment of a patient’s neurologic condition was performed by pharmacists who did not have access to the patient’s medical history; therefore, such an assessment cannot be considered fully reliable. Nevertheless, this method of verification allowed for a definite exclusion of patients in the middle and advanced stages of diseases that impact memory and cognitive functions. The results of the recall test are connected only to the participants’ short-term memory. Under the current conditions of Polish pharmaceutical practice, it is not possible to extend this phase of the research to determine long-term memory recall. Also, according to the ISO 9186 standards, each individual pictogram should be validated among 50 participants, a number which was not achieved in our study. However, once again, we emphasize that our research is a pilot analysis, and that further studies will be conducted. The 22 pictograms that achieved satisfactory results during this project will be included in future validation processes among a specific group of patients – those suffering from cardiovascular diseases. This continued research will be conducted in line with ISO guidelines.
Conclusion
Our research facilitated satisfactory evaluation of 22 out of 50 pictograms. The feedback information obtained from patients throughout our study will help modify future pictograms and proves that patients have an important voice in the discussion regarding the design of additional pictograms. Their feedback also aids in guiding further research. Future research should focus on demonstrating the impact of pictograms’ use and their relationship to adherence as well as hard endpoints. The validation process should be recognized not only as useful but also vital to the future incorporation of pictograms in pharmaceutical care. The validation of pictograms in patients with a specific chronic disease, for example, heart failure or neurological disorders, as well as further research carried out among the geriatric population are needed.
Acknowledgments
The pictogram validation study was sponsored by the Warsaw-based Piktorex Sp. z.o.o., which has received financial support from the LQT Fund S.A. in Gdansk and from The National Centre of Research and Development in Warsaw, on the basis of the Contract on Support within the Systemic Project “Bridge Alfa”, concluded on December 3, 2015. This financial support is nonrefundable public aid within the meaning of section § 30 Paragraph 3 in relation to section § 31 of the Regulation of the Minister of Education and Higher Education of February 25, 2015, regarding conditions for granting public aid, and de minimis aid by The National Centre of Research and Development (reference number of the aid program SA. 35857 [2012/X]), exempt from notification obligation, provided for in Art. 108 of the Treaty on the functioning of the European Union, pursuant to Art. 21 of the Commission Regulation (EU) number 651/2014 of June 14, 2014, declaring certain categories of aid compatible with the internal market in application of Articles 107 and 108 of the Treaty. All pictograms developed in the project are owned and registered in the Polish Patent Office. It must be emphasized that this publication was created by Piktorex Sp. z.o.o. as a result of obligatory conditions to obtain financial support from the LQT Fund S.A. in Gdansk and from The National Centre of Research and Development in Warsaw, on the basis of the Contract on Support within the Systemic Project “Bridge Alfa”, concluded on December 3, 2015. A Polish version of the Newest Vital Sign questionnaire was prepared by Słońska Z, Borowiec A, and Lignowska L, based on the reference of Rowlands et al,14 as part of the European Health Literacy Survey.27
Author contributions
PM designed the study and supervised the project, DŚ designed the study, and prepared the manuscript, MB and ED collected the data, and JK, AP, RV, and MJ supervised the project. All authors had a substantial role in the completed study, contributed to the manuscript in a significant manner, and contributed toward data analysis, drafting and critically revising the paper, gave final approval of the version to be published, and agree to be accountable for all aspects of the work.
Disclosure
PM is a research assistant at the Department of Pharmaceutical Technology, Collegium Medicum in Bydgoszcz, Nicolaus University in Torun, and is a current employee of Piktorex Sp. z.o.o. DŚ has received an honorarium from Piktorex Sp. z.o.o. MB and ED are current employees of Farenta Polska. The authors report no other conflicts of interest in this work.
References
Dowse R, Ehlers M. Medicine labels incorporating pictograms: do they influence understanding and adherence? Patient Educ Couns. 2005;58(1):63–70. | ||
Malloy-Weir L, Cooper M. Health literacy, literacy, numeracy and nutrition label understanding and use: a scoping review of the literature. J Hum Nutr Diet. 2017;30(3):309–325. | ||
Swieczkowski D, Mogielnicki M, Cwalina N, et al. Medication adherence in patients after percutaneous coronary intervention due to acute myocardial infarction: from research to clinical implications. Cardiol J. Epub 2016 Jul 21. | ||
van Beusekom M, Bos M, Wolterbeek R, Guchelaar HJ, van den Broek J. Patients’ preferences for visuals: differences in the preferred level of detail, type of background and type of frame of icons depicting organs between literate and low-literate people. Patient Educ Couns. 2015;98(2):226–233. | ||
Montagne M. Pharmaceutical pictograms: a model for development and testing for comprehension and utility. Res Soc Adm Pharm. 2013;9(5):609–620. | ||
Barros IMC, Alcântara TS, Mesquita AR, Santos AC, Paixão FP, Lyra DP Jr. The use of pictograms in the health care: a literature review. Res Social Adm Pharm. 2014;10(5):704–719. | ||
Katz MG, Kripalani S, Weiss BD. Use of pictorial aids in medication instructions: a review of the literature: a review of the literature. Am J Health Syst Pharm. 2006;63(23):2391–2397. | ||
Montagne M. Pharmaceutical pictograms: a model for development and testing for comprehension and utility. Res Social Adm Pharm. 2013;9(5):609–620. | ||
International Pharmaceutical Federation. FIP Guidelines for the Labels of Prescribed Medicines [Internet]. 2001. Available from: http://www.fip.org/www/uploads/database_file.php?id=256&table_id. Accessed August 20, 2017. | ||
Kheir N, Awaisu A, Radoui A, El Badawi A, Jean L, Dowse R. Development and evaluation of pictograms on medication labels for patients with limited literacy skills in a culturally diverse multiethnic population. Res Social Adm Pharm. 2014;10(5):720–730. | ||
Farenta Polska [Internet]. 2017. Available from: https://www.farenta.com/pl/. Accessed August 20, 2017. | ||
Berthenet M, Vaillancourt R, Pouliot A. Evaluation, modification, and validation of pictograms depicting medication instructions in the elderly. J Health Commun. 2016;21(Suppl 1):27–33. | ||
International Organization for Standardization. Standard 9186: Graphical Symbols – Testing Methods – Part 1: Methods for Testing Comprehensibility. Geneva: ISO [Internet]. 2007. Available from: http://www.iso.org. Accessed August 20, 2017. | ||
Rowlands G, Khazaezadeh N, Oteng-Ntim E, Seed P, Barr S, Weiss BD. Development and validation of a measure of health literacy in the UK: the newest vital sign. BMC Public Health. 2013;13:116. | ||
Wolpin SE, Nguyen JK, Parks JJ, et al. Redesigning pictographs for patients with low health literacy and establishing preliminary steps for delivery via smart phones. Pharm Pract (Granada). 2016;14(2):686. | ||
van Beusekom MM, Grootens-Wiegers P, Bos MJ, Guchelaar HJ, van den Broek JM. Low literacy and written drug information: information-seeking, leaflet evaluation and preferences, and roles for images. Int J Clin Pharm. 2016;38(6):1372–1379. | ||
Tong V, Raynor DK, Aslani P. “It’s all there in black and white” – or is it? Consumer perspectives on the proposed Australian medicine information box over-the-counter label format. Heal Expect. 2016;19(4):948–961. | ||
Ng AWY, Chan AHS, Ho VWS. Comprehension by older people of medication information with or without supplementary pharmaceutical pictograms. Appl Ergon. 2017;58:167–175. | ||
Mateti UV, Nagappa AN, Attur RP, et al. Preparation, validation and user-testing of pictogram-based patient information leaflets for hemodialysis patients. Saudi Pharm J. 2015;23(6):621–625. | ||
Mateti UV, Nagappa AN, Attur RP, et al. Preparation, validation and user-testing of pictogram-based patient information leaflets for hemodialysis patients. Saudi Pharm J. 2015;23(6):621–625. | ||
Yin HS, Parker RM, Sanders LM, et al. Pictograms, units and dosing tools, and parent medication errors: a randomized study. Pediatrics. 2017;140(1):e20163237. | ||
Chan HK, Hassali MA, Lim CJ, Saleem F, Tan WL. Using pictograms to assist caregivers in liquid medication administration: a systematic review. J Clin Pharm Ther. 2015;40(3):266–272. | ||
Doucette D, Vaillancourt R, Berthenet M, Li LS, Pouliot A. Validation of a pictogram-based diabetes education tool in counselling patients with type 2 diabetes. Can Pharm J (Ott). 2014;147(6):340–344. | ||
Mok G, Vaillancourt R, Irwin D, Wong A, Zemek R, Alqurashi W. Design and validation of pictograms in a pediatric anaphylaxis action plan. Pediatr Allergy Immunol. 2015;26(3):223–233. | ||
Korenevsky A, Vaillancourt R, Pouliot A, et al. How many words does a picture really tell? Cross-sectional descriptive study of pictogram evaluation by youth. Can J Hosp Pharm. 2013;66(4):219–226. | ||
Hanson E, Hartzema A. Evaluating pictograms as an aid for counseling elderly and low-literate patients. J Pharm Mark Manag. 1995;9(3):41–54. | ||
The European Health Literacy Project (HLS-EU); European Health Literacy Survey. Available from: https://www.healthliteracyeurope.net/hls-eu. Accessed January 12, 2018. |
 © 2018 The Author(s). This work is published and licensed by Dove Medical Press Limited. The
full terms of this license are available at https://www.dovepress.com/terms
and incorporate the Creative Commons Attribution
- Non Commercial (unported, 3.0) License.
By accessing the work you hereby accept the Terms. Non-commercial uses of the work are permitted
without any further permission from Dove Medical Press Limited, provided the work is properly
attributed. For permission for commercial use of this work, please see paragraphs 4.2 and 5 of our Terms.
© 2018 The Author(s). This work is published and licensed by Dove Medical Press Limited. The
full terms of this license are available at https://www.dovepress.com/terms
and incorporate the Creative Commons Attribution
- Non Commercial (unported, 3.0) License.
By accessing the work you hereby accept the Terms. Non-commercial uses of the work are permitted
without any further permission from Dove Medical Press Limited, provided the work is properly
attributed. For permission for commercial use of this work, please see paragraphs 4.2 and 5 of our Terms.