Back to Journals » International Journal of Nanomedicine » Volume 13
The epigenetic mechanisms of nanotopography-guided osteogenic differentiation of mesenchymal stem cells via high-throughput transcriptome sequencing
Authors Lv L, Liu Y, Zhang P, Bai X, Ma X, Wang Y, Li H ![]() , Wang L, Zhou Y
, Wang L, Zhou Y
Received 22 March 2018
Accepted for publication 29 June 2018
Published 20 September 2018 Volume 2018:13 Pages 5605—5623
DOI https://doi.org/10.2147/IJN.S168928
Checked for plagiarism Yes
Review by Single anonymous peer review
Peer reviewer comments 2
Editor who approved publication: Dr Linlin Sun
Longwei Lv,1 Yunsong Liu,1 Ping Zhang,1 Xiangsong Bai,1 Xiaohan Ma,1 Yuejun Wang,1 Hongyi Li,2 Li Wang,3 Yongsheng Zhou1
1Department of Prosthodontics, Peking University School and Hospital of Stomatology, National Engineering Laboratory for Digital and Material Technology of Stomatology, National Clinical Research Center for Oral Disease, Beijing Key Laboratory of Digital Stomatology, Beijing, People’s Republic of China; 2The key Laboratory of Advanced Functional Materials, Ministry of Education of China, College of Materials Science and Engineering, Beijing University of Technology, Beijing 100124, China; 3State Key Laboratory of Cardiovascular Disease, Fuwai Hospital, National Center for Cardiovascular Diseases, Chinese Academy of Medical Sciences and Peking Union Medical College, Beijing 100037, People’s Republic of China
Background: Nanotopography directs stem cell fate; however, the underlying mechanisms, especially those at the epigenetic level, remain vague. The TiO2-nanotube array, a classical example of nanotopography, is a good model to investigate topography–cell interactions because of its good controllability and easy manufacturing process. Previously, we found that a TiO2-nanotube array with an optimal diameter promoted osteogenic differentiation of human adipose-tissue-derived stem cells (hASCs).
Methods: We used RNA sequencing and bioinformatics to reveal the overall gene expression profile of hASCs on TiO2-nanotube arrays.
Results: Bioinformatics analyses revealed that the epigenetic regulatory network plays an important role in TiO2-nanotube-guided osteogenic differentiation. Changes in cell adhesion and cytoskeletal reorganization are linked to epigenetic alterations, including upregulation of KDM4E and downregulation of histone deacetylases. Meanwhile, microRNAs, including miR-24-1-5p, miR-24–3 p, miR-154–3 p, miR-154–5 p, miR-433–5 p, miR-589–3 p, and miR-589–5 p were downregulated, whereas miR-186–5 p and miR-770–5 p were upregulated. Long non-coding RNAs, including LINC00941, LINC01279, and ZFAS1, were downregulated in this process.
Conclusion: Using next-generation sequencing, we illustrated the overall picture of the regulatory mechanisms of TiO2 nanotubes, thus providing a basis for future clinical applications of nanotopography in the field of bone tissue engineering. Our results offer insights into material-based nanomedicine and epigenetic therapy.
Keywords: TiO2 nanotubes, RNA sequencing, osteogenic differentiation, epigenetics, histone modification, non-coding RNA
Corrigendum for this paper has been published.
Introduction
Cell–topography interactions are considered a promising management strategy to precisely control seed cell function and differentiation in the field of bone tissue engineering and bone regeneration.1 Meanwhile, the bone itself has an elegant structural hierarchy in the nanometer range; therefore, nanotopography can provide a similar niche that mimics the natural bone structure and promotes the osteogenic differentiation of mesenchymal stem cells at the healing site.2 However, a thorough picture of the underlying mechanism of how nanotopography directs stem cell fate – which is important for material safety evaluation and new material design – remains incomplete. During the past decade, mechanisms involving signaling pathways have attracted increased research attention. However, whether the epigenetic regulatory network plays a role in nanotopography-controlled cell behavior – and how it exerts these effects – remains to be determined.
Epigenetics refers to heritable changes in gene expression patterns that do not alter DNA sequences. The epigenome helps to stabilize cell status. It is perturbed and altered with the onset of stem cell differentiation.3 DNA methylation, chromatin remodeling, and non-coding RNAs are three main methods of epigenetic regulation. For example, chromatin remodeling is an essential step in transcription control. Besides transcriptional regulation by transcription factors, gene expression can be turned on or off by chromatin remodeling – a process modulated by a number of posttranslational modifications of nucleosomal histones, such as histone acetylation and methylation. Acetylation and methylation of histones are dynamic processes, balanced by the activities of histone acetyltransferases (HATs)/histone deacetylases (HDACs), and histone methyltransferases/histone demethylases, respectively.4 Meanwhile, non-coding RNAs play important roles in various biochemical processes, such as chromatin structure, transcription, and translation.5,6 Therefore, determining how nanotopography influences these epigenetic regulatory methods – and their interactions with canonical signaling pathways – is paramount to revealing the regulatory network of nanotopography-guided osteogenic differentiation of seed cells.
A TiO2-nanotube-array thin film – a classical nanotopography surface – is an excellent model to investigate topography–cell interactions because of its good controllability in terms of dimension and its relatively simple manufacturing process. In a previous study, we confirmed that TiO2 nanotubes promoted osteogenic differentiation of human adipose-tissue-derived stem cells (hASCs), and 70 nm was the optimal diameter of the nanotubes.1 Meanwhile, we discovered that TiO2 nanotubes accelerated osteogenic differentiation of hASCs by enhancing methylation of histone H3 at lysine 4 (H3K4) at the promoter regions of osteogenesis-related genes by inhibiting a histone demethylase – retinoblastoma binding protein 2 (RBP2).1 However, a detailed depiction of how TiO2 nanotubes influence cell behavior remains to be determined, and will be crucial for further nanotopography-related studies, nanomaterial design, and their future clinical applications.
Therefore, in the present study, we investigated the response of hASCs to TiO2 nanotubes using RNA sequencing (RNA-seq). Global changes in gene expression profiles will provide a more comprehensive illustration of the regulatory network between canonical signaling pathways and epigenetic regulation.
Materials and methods
Preparation of TiO2 nanotubes and surface characterization
Pure titanium (Ti) disks (23×23 mm for six-well-plate cell culture, 10×10 mm for 24-well-plate cell culture, 99.6% purity, Leiden, Beijing, People’s Republic of China) were cleaned in acetone, ethanol, and deionized water successively, for 15 minutes each, using an ultrasonic cleaning machine. TiO2 nanotubes were obtained by anodization using graphite foil as the counter cathode under an anodization voltage of 20 V in an aqueous solution with 1 M (NH4)H2PO4 and 0.08 M (NH4)HF2 under magnetic stirring at a constant speed at 20°C for 2 hours. After anodization, the specimens were rinsed with distilled water three times and dried in air at 80°C. Heat treatment was then undertaken at 450°C for 2 hours. All specimens were sterilized in an autoclave at 120°C for 30 minutes for the further experiments.
The surface morphology of the TiO2-nanotube-array thin films was characterized using field emission scanning electron microscopy (FESEM; Hitachi, S4800, Tokyo, Japan). Moreover, atomic force microscopy (AFM) was used to evaluate the morphology of the surfaces. Before AFM measurement, different samples were rinsed with ethanol and Milli-Q water, and dried in the air. The measurements were conducted under contact mode in dry conditions, with a spring constant of 0.12 N/m, a scan rate of 1 Hz, and a scan area of 20×20 μm. Measurements were run in triplicate for each sample. Static contact angles were measured using an SL200 contact angle system (Kino Industry, New York, NY, USA) at room temperature.
Before using them for cell culture, both TiO2 nanotubes-coated Ti discs and the control group smooth Ti discs were disinfected by autoclaving.
The hASCs culture and osteogenic induction hASCs were purchased from ScienCell (San Diego, CA, USA). DMEM, fetal bovine serum (FBS), and a 100× penicillin and streptomycin mixture were purchased from Gibco (Grand Island, NY, USA). The hASCs were cultured in fresh DMEM containing 10% (v/v) FBS, 100 U/mL penicillin G, and 100 mg/mL streptomycin at 37°C in an incubator with an atmosphere consisting of 95% air, 5% CO2, and 100% relative humidity. Cells at the fourth passage were used for the experiments. The osteogenic medium comprised fresh DMEM containing 10% (v/v) FBS, 100 U/mL penicillin G and 100 mg/mL streptomycin (Sigma-Aldrich, St Louis, MO, USA), 10 nM dexamethasone (Sigma-Aldrich), 10 mM β-glycerophosphate, and 50 μg/mL L-ascorbic acid (Sigma-Aldrich).
For cell adhesion and spreading on TiO2 nanotubes, the hASCs were seeded in 24-well plates on TiO2 nanotubes or Ti surfaces and observed after 2, 4, and 24 hours of cell culture. Before scanning electron microscopy (SEM) observation, samples were washed with PBS and fixed overnight in cacodylate-buffered 4% glutaraldehyde at 4°C. The specimens were postfixed in 1% OsO4 for 1.5 hours, dehydrated with a graded series of ethanol, dried in a critical point dryer (Micro Modul YO-230, Thermo Fisher Scientific, Waltham, MA, USA), mounted onto aluminum stubs, sputter-coated with gold, and viewed under a field emission SEM.1
Before observation under a confocal microscope, samples were rinsed with PBS and fixed in 4% paraformaldehyde for 20 minutes at room temperature, and permeabilized with 0.1% Triton X-100 for 15 minutes. The samples were then washed three times in PBS and incubated with fluorescein isothiocyanate (FITC)-labeled phalloidin for 25 minutes at 37°C, and nuclei were counterstained with DAPI before being visualized under a Confocal Zeiss Axiovert 650 microscope (Carl Zeiss Microimaging, Oberkochen, Germany) at wavelengths of 488 nm (green, FITC-labeled phalloidin) and 405 nm (blue, DAPI).1 Images were captured for each sample using an LSM 5 Exciter confocal imaging system (Carl Zeiss). Cell spreading areas were calculated using the ImageJ NIH software (rsb.info.nih.gov/ij/) from three random images of three different samples of each group.
To assess the immunofluorescence of osteogenic-related proteins, hASCs were seeded in 24-well plates on TiO2 nanotubes or Ti surfaces. After 7 days of osteoinduction, the samples were rinsed with PBS and fixed in 4% paraformaldehyde for 20 minutes at room temperature, permeabilized with 0.1% Triton X-100 for 15 minutes, and blocked with 0.8% bovine serum albumin (BSA) for 1 hour at room temperature. Thereafter, the samples were incubated with 1:200 anti-osteocalcin (Santa Cruz Biotechnology, Dallas, TX, USA) or 1:200 anti-RUNX2 (runt-related transcription factor 2) primary antibodies (12556, Cell Signaling Technology, Beverly, MA, USA) overnight at 4°C. Samples were rinsed and then incubated in 1:500 anti-rabbit secondary antibodies (4,412S, Cell Signaling Technology) for 1 hour at room temperature. The samples were washed with 0.8% BSA and the nuclei were counterstained with DAPI before being visualized under the confocal microscope at wavelengths of 488 nm (green, osteocalcin or RUNX2) and 405 nm (blue, DAPI).1
RNA-seq and bioinformatics
Total RNA was extracted from the hASCs using a GeneJet RNA purification kit (Thermo Fisher Scientific). One microgram of RNA was used for sequencing library generation using a TruSeq Stranded Total RNA Library Prep Kit (Illumina, San Diego, CA, USA) according to the manufacturer’s instructions. All libraries were sequenced on a NextSeq sequencer (Illumina) using the 35 nt paired-end sequencing protocol. The RNA-seq experiments were repeated twice using hASCs from two different individuals.
Identification of differentially expressed genes (DEGs) was done using the Limma package on the R platform. Differential gene expression presenting a log2 fold-change (log2FC) ≥ |1|, eg, expression changes ≥2 or ≤0.5, and P<0.05 identified a DEG. To avoid bias from different analysis platforms, we used the online software DAVID Bioinformatics Resources 6.7 (https://david.ncifcrf.gov/)7 and Ingenuity Pathways Analysis (IPA, Ingenuity Systems) platform (www.ingenuity.com) for gene expression analyses. Pathway analyses, including Kyoto Encyclopedia of Genes and Genomes (KEGG) pathway analysis and canonical pathway analysis based on IPA, were conducted. Gene Ontology (GO) enrichment analyses, including biological processes (BP), cellular components (CC), and molecular functions (MF), were conducted using the DAVID online software. For the KEGG and GO analyses, P<0.05 was considered significant, and the results are shown as log10 (P-value). Additionally, we identified the enriched networks, molecular functions, and pathways in the IPA platform via a license from Ingenuity Systems.8,9
RNA extraction, reverse transcription, and quantitative real-time PCR (qRT-PCR) hASCs were seeded in six-well plates on TiO2 nanotubes or Ti surfaces. Total cellular RNAs were isolated 7 days after osteoinduction using the TRIzol reagent (Invitrogen, Carlsbad, CA, USA) and were used for first-strand cDNA synthesis using a Reverse Transcription System (Takara, Dalian, People’s Republic of China). Quantification of all gene transcripts was done by qRT-PCR using a Power SYBR Green PCR Master Mix (Roche, Basel, Switzerland) and an ABI PRISM 7500 Real-Time PCR Detection System (Applied Biosystems, Foster City, CA, USA). The following thermal settings were used: 95°C for 10 minutes, followed by 40 cycles of 95°C for 15 seconds and 60°C for 1 minute. The internal controls for mRNAs and microRNAs were GAPDH and U6, respectively. The primers used are listed in Table 1. The microRNA sequences are listed in Table 2, and the primers for the microRNAs were purchased from Ribo Biotechnology Inc. (Guangzhou, People’s Republic of China). The cycle threshold values (Ct values) were used to calculate the fold differences using the 2−ΔΔCt relative expression method.10
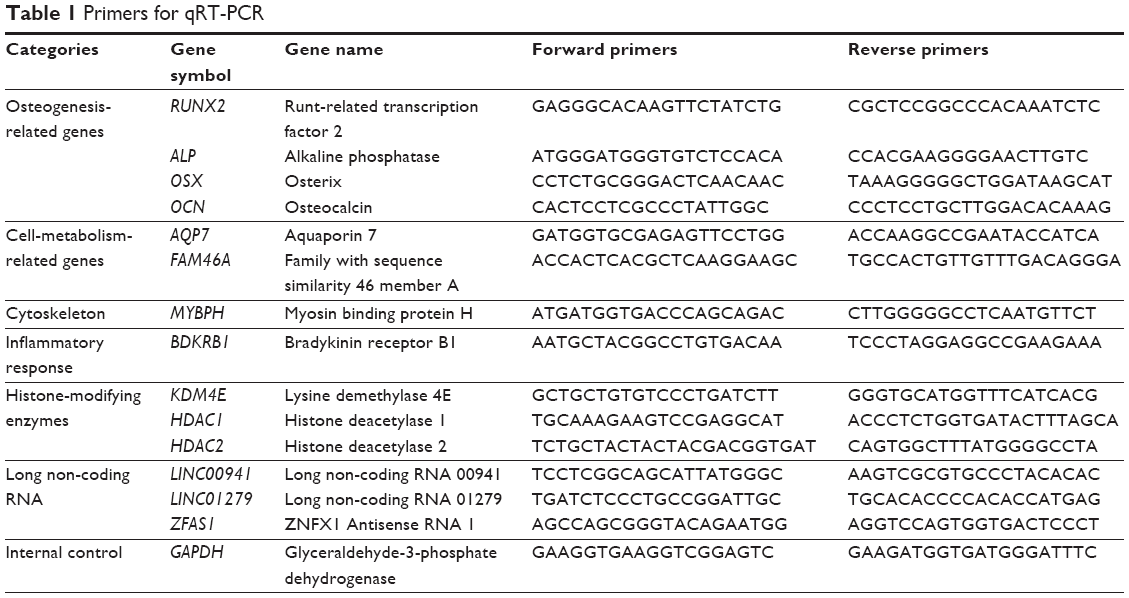 | Table 1 Primers for qRT-PCR |
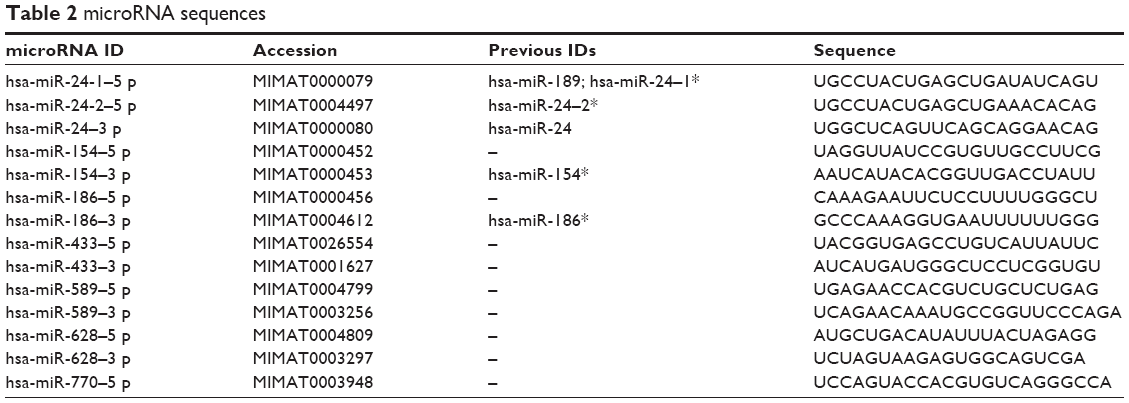 | Table 2 microRNA sequences |
Statistical analysis
All results are presented as the mean ± SD; data were analyzed using the SPSS 19.0 software (SPSS Inc., Chicago, IL, USA) by ANOVA plus Tukey’s test. For all tests, P-values less than 0.05 were considered indicative of statistically significant differences.
Results
Surface characterization of TiO2 nanotubes
According to the SEM images, a TiO2-nanotube-array thin film was formed on the surface of the Ti substrate using anodic oxidation at 20 V for 2 hours and annealed at 450°C for 2 hours. The outer diameter of the nanotubes was approximately 70 nm (Figure 1A). AFM demonstrated that the surface roughness of the TiO2 nanotubes increased as compared with that of the smooth Ti (Figure 1B). Contact angle measurement demonstrated that the TiO2 nanotubes were more hydrophilic than the smooth Ti surfaces (Figure 1C shows hASCs adhesion on TiO2 nanotubes).
 | Figure 1 Surface characterization, cell morphology, and osteoinductive ability of TiO2 nanotubes. |
The morphology and number of adhered cells were observed using FITC–phalloidin staining (Figure 1D), whereas the fine structures, such as pseudopodia, of each adhered cell were revealed using SEM (Figure 1E). After only 2 hours of hASC culture, cells formed obvious lamellipodia on the TiO2 nanotube surfaces. In contrast, cells on the smooth Ti surfaces stayed round with no pseudopodium, and there were far fewer adhering cells than on the TiO2 nanotube surfaces. After 4 hours of culture, even longer and net-like pseudopodia of hASCs appeared on the TiO2 nanotube surfaces, whereas the cells remained round with few pseudopodia on the smooth Ti surfaces. At 24 hours of culture, cells had extended to a larger polygonal morphology with longer pseudopodium on TiO2 nanotube surfaces, whereas on smooth Ti surfaces, the cells adopted spindle shapes. The cell spreading areas increased with prolonged adherence time, whereas the spreading areas were much larger on the TiO2 nanotubes than on the smooth Ti surfaces (Figure 1F).
Enhanced osteogenic differentiation by TiO2 nanotubes
Osteogenic-related gene expression, including runt-related transcription factor 2 (RUNX2) and osteocalcin (OCN), was enhanced on TiO2 nanotubes after 7 days of osteoinduction (Figure 1G). RUNX2 and OCN protein levels, detected by immunofluorescence, showed similar results. After 7 days of cell culture, hASCs in osteoinduction medium (OM) cultured on TiO2-nanotube surfaces demonstrated markedly stronger RUNX2 and OC-positive staining than those cultured on Ti surfaces (Figure 1H). For hASCs in proliferation medium (PM) cultured on TiO2 nanotube surfaces, we observed sporadic green fluorescence, compared with little fluorescence signal on the Ti surfaces (Figure 1G).
Gene expression profiling by RNA-seq
To gain an insight into the potential mechanisms governing the osteogenic process of TiO2 nanotubes, gene expression profiles of hASCs cultured on TiO2 nanotubes in proliferation medium (NPM), TiO2 nanotubes in osteoinduction medium (NOM), Ti with proliferation medium (TPM), and Ti with osteoinduction medium (TOM) were analyzed using RNA-seq. Differences in gene expression between the TiO2 nanotubes and Ti were analyzed by comparing NPM and TPM, and NOM and TOM expression profiles (Figure 2A). Expression heat maps based on normalized log2 RPKM (reads per kilobase of transcript per million mapped reads) of representative DEGs of NPM vs TPM and NOM vs TOM are shown in Figure 2B. Meanwhile, differences in gene expression before and after osteoinduction were also compared: TOM vs TPM and NOM vs NPM. The expression heat map based on normalized log2 (average RPKM) of representative DEGs in the four groups (TPM, NPM, TOM, and NOM) is shown in Figure 2C. Statistics for the identified DEGs are summarized in Tables 3 and S1&–S4. For the NPM vs TPM comparison, there were 740 DEGs, including 313 upregulated and 427 downregulated DEGs, and the number of annotated DEGs based on Entrez Gene IDs for human was 661 (Figure 2A and B, Tables 3, S1). For the NOM vs TOM comparison, there were 438 DEGs, including 275 upregulated and 163 downregulated DEGs, and the number of annotated DEGs on Entrez Gene information for human was 398 (Figure 2A and B, Tables 3, S2). For the TOM vs TPM comparison, there were 2,053 annotated DEGs (Figure 2A, Tables 3, S3), and for NOM vs NPM there were 2,314 annotated DEGs (Figure 2A, Tables 3, S4). The number of overlapping DEGs among the four comparison pairs was 11 (Figure 2A), and the log2FC ratios of the eleven genes are shown in Figure 2D. qRT-PCR was used to confirm the expression levels of representative DEGs (Figure 2E). Aquaporin 7 (AQP7) – an aquaglyceroporin that facilitates glycerol and water transport – was upregulated upon culturing on TiO2 nanotubes. Moreover, other aquaporins, such as AQP1, AQP9, and AQP6, were involved in this process (Figure 2B and C). Family with sequence similarity 46 member A (FAM46A), which belongs to the nucleotidyltransferase (NTase) fold superfamily and is a SMAD signaling pathway-related protein, is probably involved in TGF-β signaling,11 and its expression was downregulated by TiO2 nanotubes. The expression of myosin binding protein H (MYBPH) – a representative DEG in actin cytoskeleton signaling – was upregulated by the TiO2 nanotubes. The expression of bradykinin receptor B1 (BDKRB1), a representative DEG in the complement and coagulation cascades pathway, was downregulated by the TiO2 nanotubes.
 | Figure 2 Distribution of differentially expressed genes (DEGs) and canonical pathway analysis by Ingenuity Pathways Analysis. |
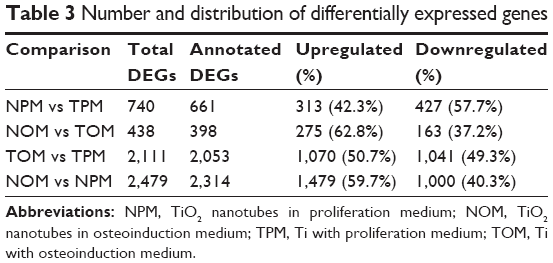 | Table 3 Number and distribution of differentially expressed genes |
Canonical pathways analysis and verification of representative DEGs by qRT-PCR
Canonical pathway analysis by IPA identified that cell adhesion and cellular morphology-related pathways – including actin cytoskeleton signaling, integrin linked kinase (ILK) signaling, RhoA signaling, and regulation of actin-based motility by Rho – were positively regulated by TiO2 nanotubes, according to the activation z-score (Figure 2F). Cell migration and chemotaxis-related pathways, such as chemokine C-X-C motif receptor-4 signaling, were activated by TiO2 nanotubes in the presence of OM. Inflammation-related pathways, including production of nitric oxide and ROS in macrophages, and interleukin 6 (IL-6) signaling were activated on both TiO2 nanotubes and Ti surfaces when cultured in OM. Thus, in the proliferation medium, the inflammatory response decreased in comparison with TiO2 nanotubes with Ti (NPM vs TPM), whereas inflammatory responses were activated by both OM and TiO2 nanotubes when comparing NOM vs TOM, TOM vs TPM, and NOM vs NPM. Cell-metabolism-related pathways, including cAMP signaling and its downstream protein kinase A signaling, were also upregulated by TiO2 nanotubes.
KEGG analysis revealed that a significant proportion of DEGs were associated with complement and coagulation cascades, cell adhesion molecules, extracellular matrix (ECM) receptor interaction, and the phosphoinositide 3-kinase (PI3K)-Akt signaling pathway (Figure 3A). Figure 3B shows the up- and downregulated DEGs in the complement and coagulation cascades.
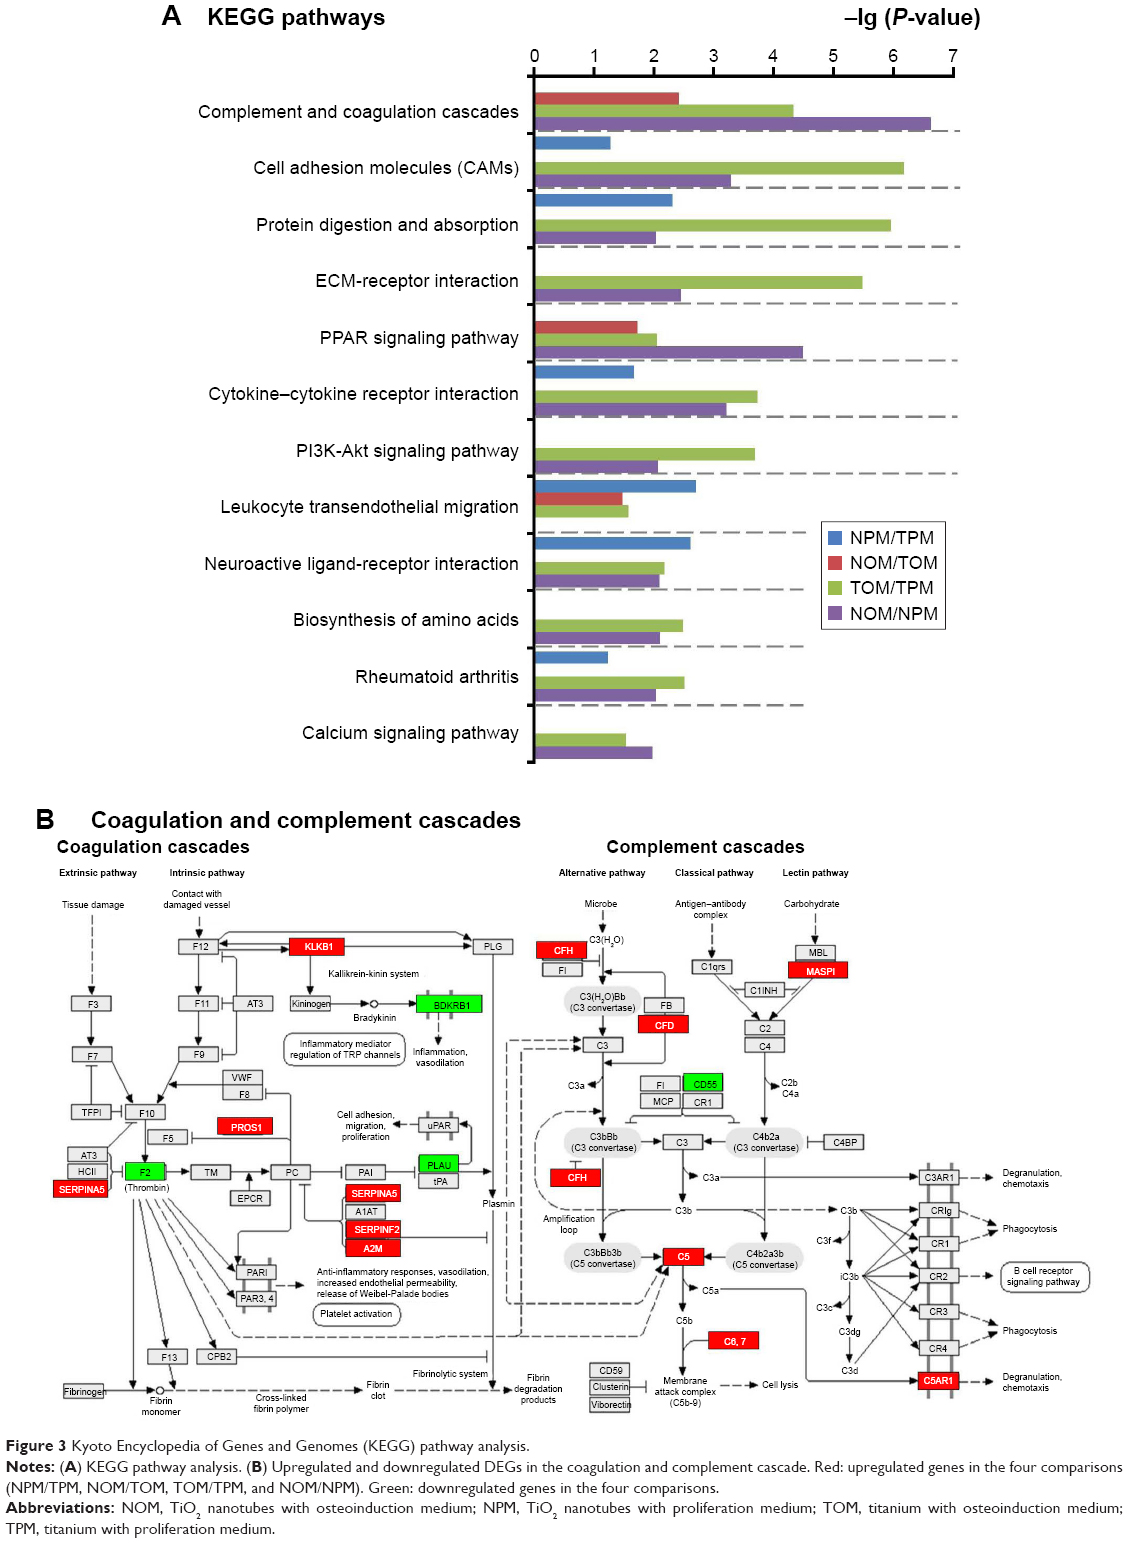 | Figure 3 Kyoto Encyclopedia of Genes and Genomes (KEGG) pathway analysis. |
GO analysis
GO enrichment analyses, including biological process (BP), cellular component (CC), and molecular function (MF), were conducted using the DAVID online software. According to the GO analyses of NPM vs TPM and NOM vs TOM, the cell adhesion, cytoskeleton, cell metabolism, and cellular interactions were significantly influenced (P<0.05, −lg P>1.3) by TiO2 nanotubes (Figure 4A–F). Meanwhile, GO analysis indicated potential epigenetic regulation from TiO2 nanotubes, because there were changes in transcriptional repressor activity and RNA polymerase II core promoter proximal sequence-specific binding (Figure 4E).
 | Figure 4 Gene Ontology (GO) analyses. |
Network analysis and epigenetic regulation
Network analysis between NPM and TPM (Figure 5A) using IPA showed that ERK1/2 – which is related to laminin, MAPK, PI3K, and SMAD – might play an important role in this process. In addition, we found that the levels of downstream factors of HDAC, including MT1F (metallothionein 1F), MT1B (metallothionein 1B), LRP2 (LDL receptor related protein 2), and TNFSF4 (TNF superfamily member 4), were downregulated by TiO2 nanotubes. We then examined gene expression of HDAC1 and HDAC2 using qRT-PCR, which showed that both were downregulated by TiO2 nanotubes (Figure 5C). Therefore, TiO2 nanotubes might influence histone acetylation by suppressing HDAC expression.
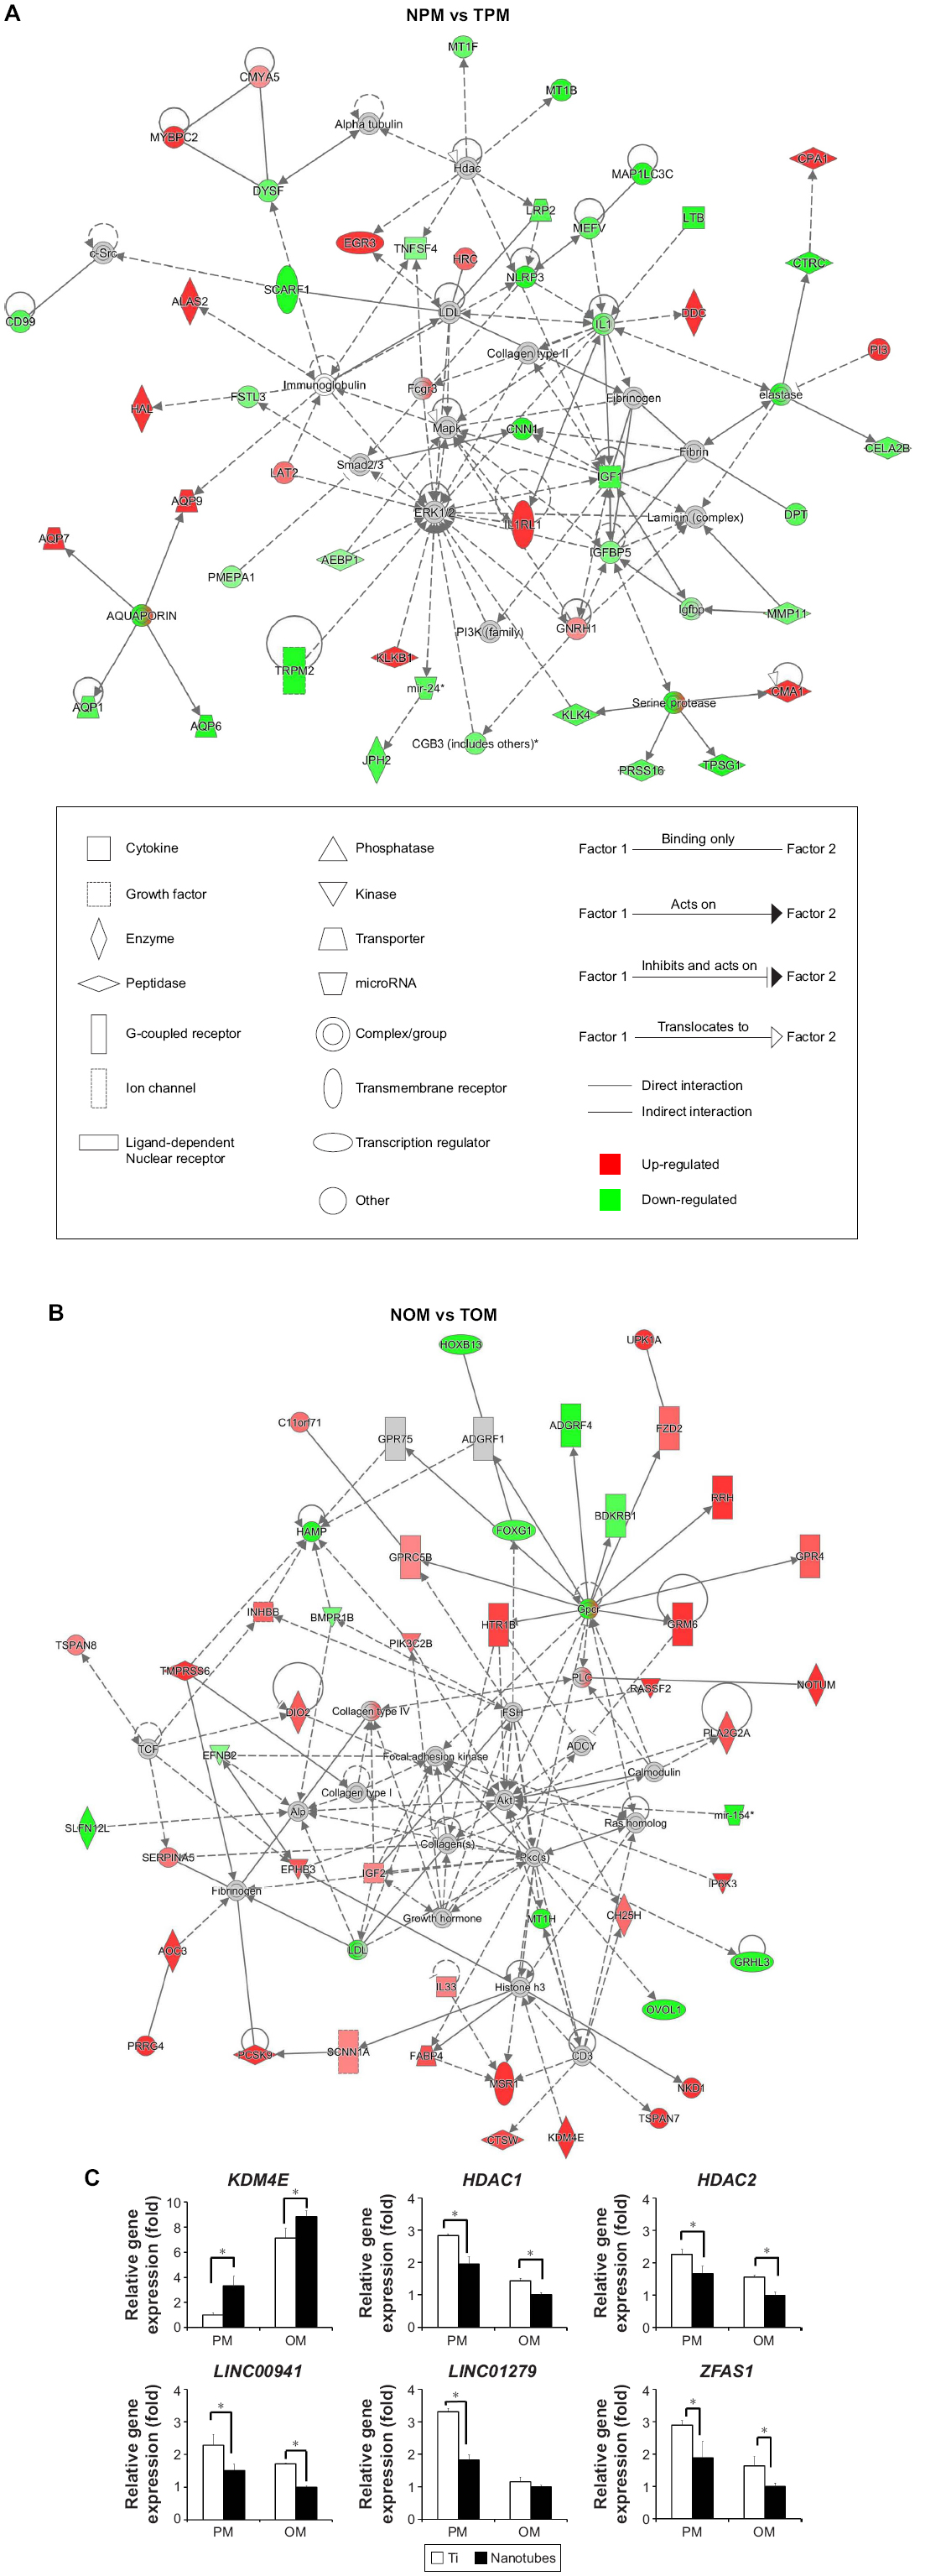 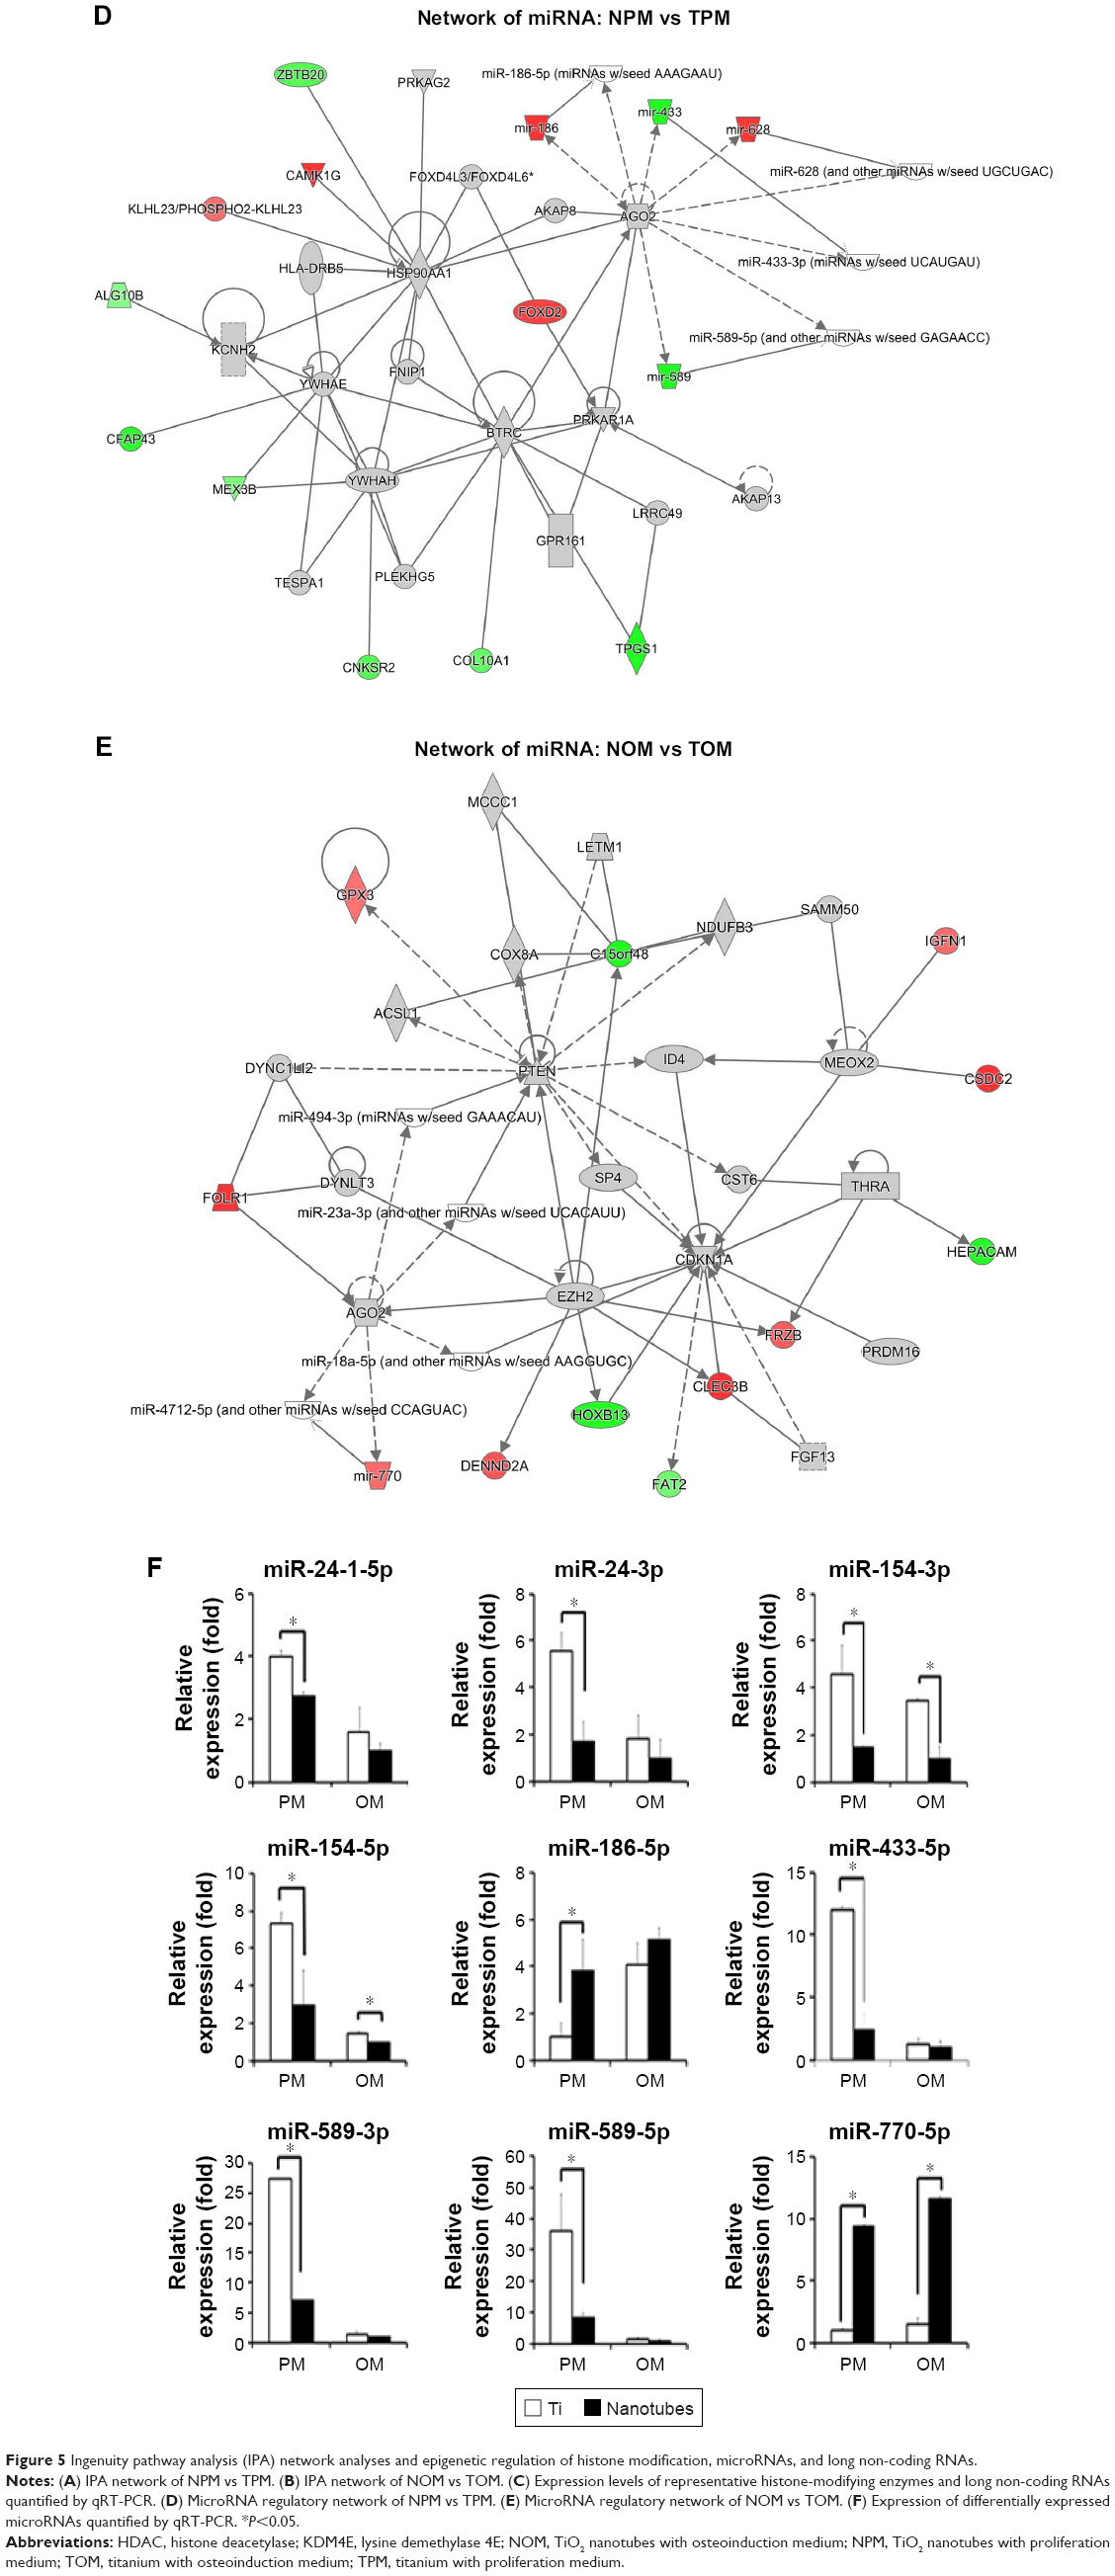 | Figure 5 Ingenuity pathway analysis (IPA) network analyses and epigenetic regulation of histone modification, microRNAs, and long non-coding RNAs. |
Network analysis between NOM and TOM (Figure 5B) by IPA showed that Akt, which is related to FAK, PKC, and RAS, might play an important role in this process. Moreover, we found that the expression of lysine demethylase 4E (KDM4E; also known as KDM5E, JMJD2E, or KDM4DL) – a histone lysine demethylase that catalyzes demethylation of di- and trimethylated lys9 of histone H3 – was significantly upregulated by TiO2 nanotubes (Figure 5C), which indicated a lower methylation level of H3K9 and gene activation. Meanwhile, the expression levels of downstream factors of histone H3, including EPHB3 (Ephrin receptor B3), NKD1 (naked cuticle homolog 1), MSR1 (macrophage scavenger receptor 1), and SCNN1A (sodium channel epithelial one alpha subunit), were upregulated by TiO2 nanotubes. Therefore, TiO2 nanotubes might influence histone methylation via upregulation of KDM4E.
Meanwhile, epigenetic regulation of long non-coding RNAs (lncRNAs), and microRNAs was influenced by TiO2 nanotubes. The expression levels of lncRNAs, including LINC00941, LINC01279, and ZFAS1, were downregulated by TiO2 nanotubes (Figure 2C), which was verified by qRT-PCR (Figure 5C). MicroRNAs, such as miR-186 (including miR-186–3 p and miR-186–5 p), miR-628 (including miR-628–3 p and miR-628–5 p), and miR-770 (miR-770–5 p), were classified as upregulated DEGs, whereas miR-24–1 (including miR-24-1–5p and miR-24–3 p), miR-154 (including miR-154–3 p and miR-154–5 p), miR-433 (including miR-433–3 p and miR-433–5 p), and miR-589 (including miR-589–3 p and miR-589–5 p) were classified as downregulated DEGs (Figures 2B and C, 5A, B, and D–F). We verified the expression of these microRNAs using qRT-PCR, and found that the expression levels of miR-186–5 p and miR-770–5 p were indeed upregulated by TiO2 nanotubes. However, the expression levels of miR-24-1-5p, miR-24–3 p, miR-154–3 p, miR-54–5 p, miR-433–5 p, miR-589–3 p, and miR-589–5 p were downregulated (Figure 5F); no significant differences could be observed for miR-433–3 p and miR-628–5 p. Although miR-628–3 p was upregulated by TiO2 nanotubes in the proliferation medium, it was downregulated in OM. These results indicated that miR-628–3 p could be influenced by nanotopography, but might not be involved in the process of nanotopography-induced osteogenic differentiation. Therefore, the epigenetic regulatory network might play an important role in TiO2-nanotube-guided osteogenic differentiation.
Discussion
Cell adhesion and cytoskeleton reorganization are linked to epigenetic alterations
In this study, we found that cell morphologies on TiO2 nanotubes were distinct from those on smooth Ti surfaces. Specifically, cells on TiO2 nanotubes were more spread out, with longer and netted pseudopodia (Figure 1D–F). Furthermore, the extension and distribution of actin filaments was altered as a result of cell morphological changes, according to FITC–phalloidin staining (Figure 1D). Bioinformatics analyses revealed that cytoskeleton components, including actin, α-tubulin, laminin, fibrin, and RhoA, were significantly influenced by TiO2 nanotubes (Figures 2F and 5A). However, RhoA-related signaling pathways are tightly related to the extension of actin filaments and stress fiber formation. In fact, the moment a cell adheres to a substrate, their interactions begin.4 The cell spreads and thus the cell shape changes under the guidance of the material substrate. Subsequently, the cytoskeleton reorganizes, and the forces generated by the cytoskeleton components, including actin, myosin, and α-tubulin, are transmitted to the nucleus via physical links of laminin on the nuclear envelope.12 This is why biomaterial topography – an external signal – can alter the internal epigenetic state in the nucleus of stem cells and thus pass these traits to their descendant cells.
Furthermore, canonical pathways – including FAK, MAPK, PI3K-AKT, Rho, and ERK pathways, which are closely related to cell adhesion and cell morphology – were involved in the TiO2-nanotube-guided osteogenic differentiation (Figures 2B, 3A, and 5A, B). These results further corroborated existing reports that topographies influence cell behavior through canonical pathways, including the FAK,13 MAPK,14,15 PI3K-AKT,16 Rho/ROCK,17–19 ERK,15,16 Wnt,20 and YAP/TAZ21 signaling pathways. In addition, these pathways share crosstalk with each other and play important roles in biomaterial-directed cell adhesion, migration, proliferation, and differentiation.
Moreover, cellular interactions play an important role in this process. GO analyses revealed significant changes in cell junctions, cell–cell signaling, ECM organization, and extracellular exosomes (Figure 4A–F). Therefore, cytoskeletal changes, epigenetic alterations, and regulation of canonical pathways in cells that are in direct contact with the nanotopography are relayed to surrounding cells through cell synapse and cell–cell junctions, as well as by the secretion of cytokines or exosomes into the extracellular region. Therefore, TiO2 nanotubes-guided osteogenic differentiation begins with cell adhesion and changes in cell morphology, and then extends to surrounding cells through physical links, such as cell–cell junctions and the ECM, as well as by alterations to the microenvironment by secretion of exosomes and chemoattractants.
Histone modification, a paramount epigenetic mechanism in cell–material interactions
Chromatin remodeling plays an important role in cellular deformability, genome integrity, transcription control, and cell functions.4 Histone modifications, including acetylation, methylation, phosphorylation, and adenosine diphosphate (ADP) ribosylation, are important methods of chromatin remodeling. The modification status of histones is a dynamic process balanced by a group of histone-modifying enzymes. For example, the acetylation status is balanced by the activities of HATs and histone HDACs, whereas the methylation of histones is balanced by histone methyltransferase and histone demethylase. Generally, higher methylation levels of H3K4, lower methylation levels of H3K9 and H3K27, and histone acetylation lead to gene activation. By contrast, H3K4 demethylation, H3K9 and H3K27 methylation, and histone deacetylation lead to gene repression.4
In a previous study, we revealed an epigenetic mechanism by which TiO2 nanotubes promote osteogenic differentiation of hASCs by enhancing the H3K4 methylation level at the promoter regions of osteogenesis-related genes through inhibiting histone demethylase retinoblastoma protein 2 (RBP2).1 In this study, we provided a more comprehensive picture of TiO2-nanotube-directed epigenetic alterations, including upregulation of KDM4E – a histone demethylase of H3K9 – and downregulation of HDAC (Figure 5C). These changes might lead to epigenetic alterations, such as lower methylation level of H3K9 and higher acylation levels of histones, indicating transcription activation. Furthermore, other studies have reported that topography could regulate histone modification. Microgrooves22,23 and aligned nanofibers24 can cause a decrease in HDAC activity, accompanied by increased histone acetylation. Cytoplasmic actomyosin and nuclear matrix protein lamin A/C are important transducers in this process, because inhibition of lamin A/C disrupts this process,25 and cytoplasmic-to-nuclear redistribution of HDAC depends on actomyosin.26 Meanwhile, topography may provide a solution in somatic cell reprograming to replace chemical drugs.24,27–29 Topographies of microgrooves or aligned nanofibers provoke an increase in AcH3, H3K4me2, and H3K4me3 through downregulation of HDAC activity28 and upregulation of the expression of the WD repeat domain 5 (WDR5) – a subunit of H3 methyltransferase – thus significantly enhancing reprograming efficiency in fibroblasts.24 Therefore, using biomaterials to direct cell behaviors is a promising method in the clinical application of human cells.24,27,28
Non-coding RNAs, newly discovered epigenetic regulation exerted by nanotopography
Although traditional microarray analyses have been used frequently,30 next-generation sequencing provides an unprecedented opportunity to analyze the complex networks of non-coding RNAs. Recent research progress into miRNAs – representing highly conserved non-coding RNAs with lengths ranging from 18 to 23 nt – has clarified that signaling networks are even more precise and complex, with miRNAs participating in almost every cellular process. For example, miRNAs play important roles during osteogenic differentiation. Our group has demonstrated that miR-375 promotes the osteogenic differentiation of hASCs via the YAP1/DEPTOR/AKT regulatory network,31 whereas miR-34a promotes osteogenic differentiation of hASCs via the RBP2/NOTCH1/CYCLIN D1 coregulatory network.32 Given the pivotal role of miRNAs in regulatory circuitries that control self-renewal and pluripotency of stem cells, the important roles of miRNAs in cell–substrate interactions need to be investigated systematically.
In this study, we found that miRNAs, including miR-186–5 p and miR-770–5 p, were upregulated, whereas miR-24-1-5p, miR-24–3 p, miR-154–3 p, miR-154–5 p, miR-433–5 p, miR-589–3 p, and miR-589–5 p were downregulated (Figure 5F). GO analysis demonstrated that RNA polymerase II core promoter proximal region sequence-specific binding was influenced by TiO2 nanotubes (Figure 4E). RNA polymerase II catalyzes the transcription of DNA to synthesize precursors of mRNAs and most microRNAs, and a wide range of transcription factors are required for it to bind to upstream gene promoters and begin transcription.33–35 In this study, miR-186–5 p was upregulated by both TiO2 nanotubes and osteoinduction medium, indicating that miR-186–5 p might play a positive role in the osteogenic differentiation of hASCs, whereas inhibition of miR-186–5 p was reported to contribute to high-glucose-induced injury in cardiomyocytes.36 Meanwhile, miR-770–5 p was upregulated by TiO2 nanotubes, indicating that miR-770–5 p is a potential positive regulator of osteogenic differentiation. The lncRNA MEG3 is the host gene of miR-770–5 p,37 and MEG3 was reported to promote osteogenic differentiation.38 By contrast, miR-24-1-5p and miR-24–3 p were downregulated by both TiO2 nanotubes and osteoinduction medium, indicating that miR-24-1-5p and miR-24–3 p are negative regulators of osteogenic differentiation, and can be downregulated by nanotopography. Meanwhile, miR-154–3 p and miR-154–5 p were downregulated by both TiO2 nanotubes and osteoinduction medium, and it has been reported that miR-154–5 p negatively regulates ASCs osteogenic differentiation under tensile stress through the Wnt/PCP pathway by directly targeting Wnt11.39 Both our results and those of existing studies indicated that miR-154–5 p is likely to be a negative regulator of osteogenic differentiation and is related to cellular stress. The expression of miR-433–5 p was significantly downregulated by both TiO2 nanotubes and osteoinduction medium in this study, and miR-433 was reported to suppress BMP2-induced osteoblast differentiation by decreasing the level of RUNX2 transcription.40 Therefore, miR-433–5 p is a potential negative regulator of osteogenic differentiation, and nanotopography promoted osteogenic differentiation by inhibiting miR-433–5 p. However, other studies have provided evidence that biomaterials influence microRNAs. For example, 10 μm-wide microgrooved poly(3-hydroxybutyrate-co-3-hydroxyhexanoate) promoted osteogenic differentiation of MSCs, and the miRNA microarrays revealed that 18 differentially expressed miRNAs, such as let-7a, let-7i, miR-196a, miR-93, and miR-351, contributed comprehensively to the cellular regulation process, including MAPK and SMAD signaling pathways.41
The lncRNAs are defined as transcripts longer than 200 nt that are not translated into protein. In recent years, lncRNAs have emerged as an important class of regulators of gene expression and epigenetic regulation.6,42,43 In our previous study, some lncRNAs were observed to regulate the osteogenic differentiation of MSCs. For example, lncRNA MEG338 and lncRNA H1944 are positive regulators of osteogenic differentiation. LncRNA H19 promotes osteoblast differentiation via the TGF-β1/SMAD3/HDAC signaling pathway by deriving miR-675. Meanwhile, lncRNA MIR31HG45 and lncRNA MIAT46 are negative regulators of osteogenic differentiation. LncRNA MIR31HG directly interacts with IκBα and participates in nuclear factor kappa-light-chain-enhancer of activated B cells (NF-κB) activation, which builds a regulatory circuit with NF-κB and inhibits osteogenic differentiation.45 However, there have been no reports on how biomaterials influence lncRNAs because of the complexity of material processing and the large number of cells needed for lncRNA experiments. In this study, we found that the expression levels of lncRNAs, including LINC00941, LINC01279, and ZFAS1, were downregulated by TiO2 nanotubes, which was verified by qRT-PCR. LncRNA ZFAS1 was upregulated in cancer cells and promoted cancer metastasis;47,48 however, its function in the process of osteogenic differentiation remains unknown. Meanwhile, LINC00941 and LINC01279 are newly identified lncRNAs whose functions require further study.
The inflammatory response: an inevitable and indispensable process for bone regeneration
The process of bone repair begins with inflammatory responses.49 In the past, inflammation was viewed as a negative factor in bone regeneration. In contrast, inflammation and its triggered immune response are indispensable for new bone formation, because the essence of bone regeneration is a balance between osteogenesis and bone resorption. Biomaterials can have profound impacts on the host immune response; thus, the concept emerged to design biomaterials that are able to trigger desired immunological outcomes and to support the healing process.50 However, engineering immune-modulating biomaterials requires an in-depth understanding of the host inflammatory and wound healing response to the implanted materials. Fortunately, high-throughput experiments provide a promising resolution. In this study, dendritic cell maturation and IL-6 signaling were negatively regulated by TiO2 nanotubes without osteoinduction, whereas the production of nitric oxide and ROS in macrophages, IL-6 signaling, and dendritic cell maturation were positively regulated by TiO2 nanotubes in OM, according to the IPA pathway analysis (Figure 2F). KEGG pathway analysis demonstrated that complement and coagulation cascades were significantly influenced by TiO2 nanotubes (Figure 3A and B). These results provide deeper insight into the inflammatory process by which TiO2 nanotubes interact with the host cells.
Perspectives and applications
Based on next-generation sequencing, this research produced an overview of the mechanism by which nanotopography guides cell behavior, including both epigenetic regulation and chemical pathway interactions from the aspect of intracellular alterations and intercellular interactions (Figure 6). Meanwhile, different platforms to analyze the results of high-throughput sequencing, including DAVID (KEGG pathway and GO analyses) and IPA (canonical pathway analyses and network analyses), were used in this study to avoid the potential bias caused by the limitations of one single platform. Cell adhesion, changes in cell morphology, and cytoskeleton reorganization are modulated by nanotopography, which is link to epigenetic alteration through mechanical transduction between the cytoskeleton and the nuclear skeleton. Subsequently, changes in the nucleus and epigenetic alterations guide cell functions, including cell proliferation and lineage commitment.26,51
 | Figure 6 Regulatory network of TiO2-nanotube-guided osteogenic differentiation. |
Epigenetic regulation of biomaterials not only plays an important role in regenerative medicine, but also is a potential tool for biomaterial safety evaluation.52–54 Epigenetic alteration is a mechanism that can explain the long-lasting and noteworthy effects on cells exerted by biomaterials. Meanwhile, epigenetic regulation is a process that breaks through the barrier of cell lineage commitment. Furthermore, assessing epigenetic alterations might be applied as new model system to directly assess transgenerational effects or screen potential stem cell populations with favorable traits for stem cell therapy. This would enhance the range of safe assessment tools to evaluate new materials in the field of material-based nanomedicine.
Moreover, epigenetic therapy has become a promising method in cancer treatment55 and tissue engineering.10 Given that biomaterials can regulate the epigenetic state, new materials can be precisely designed to target different diseases epigenetically. Therefore, an overall picture of material characteristics and epigenetic alteration is important for biomaterial design. In addition, it is beneficial to use biomaterials for epigenetic therapy, which shows promise in nanomedicine.
Conclusion
A TiO2-nanotube-array thin film on a Ti substrate with a diameter of 70 nm promotes osteogenic differentiation of hASCs. RNA-seq and bioinformatics analyses revealed that the epigenetic regulatory network plays an important role in TiO2-nanotube-guided osteogenic differentiation. Changes in cell adhesion and cytoskeleton reorganization are associated with epigenetic alterations, including upregulation of KDM4E and downregulation of HDAC. Meanwhile, microRNAs, including miR-186–5 p and miR-770–5 p, miR-24-1-5p, miR-24–3 p, miR-154–3 p, miR-154–5 p, miR-433–5 p, miR-589–3 p, and miR-589–5 p, and lncRNAs, including LINC00941, LINC01279 and ZFAS1, are closely related to this process. Using next-generation sequencing, an overall picture of the TiO2 nanotubes’ regulating mechanism was revealed, thereby providing the basis for future clinical applications of nanotopography in the field of bone tissue engineering and nanomedicine.
Acknowledgments
This work was supported by the National Natural Science Foundation of China (grant nos 31600787 and U1607110); the Project for Culturing Leading Talents in Scientific and Technological Innovation of Beijing (grant no Z171100001117169); the Young Elite Scientist Sponsorship Program of China Academy of Space Technology (CAST; grant no 2015QNRC001); the Beijing Municipal Commission of Education Foundation (grant no KZ201610005002); and the Peking University School of Stomatology for Talented Young Investigators (grant no PKUSS20150107).
Disclosure
The authors report no conflicts of interest in this work.
References
Lv L, Liu Y, Zhang P, et al. The nanoscale geometry of TiO2 nanotubes influences the osteogenic differentiation of human adipose-derived stem cells by modulating H3K4 trimethylation. Biomaterials. 2015;39:193–205. | ||
Gong T, Xie J, Liao J, Zhang T, Lin S, Lin Y. Nanomaterials and bone regeneration. Bone Res. 2015;3:15029. | ||
Bintu L, Ishibashi T, Dangkulwanich M, et al. Nucleosomal elements that control the topography of the barrier to transcription. Cell. 2012;151(4):738–749. | ||
Lv L, Tang Y, Zhang P, Liu Y, Bai X, Zhou Y. Biomaterial Cues Regulate Epigenetic State and Cell Functions-A Systematic Review. Tissue Eng Part B Rev. 2018;24(2):112–132. | ||
Hobert O. Gene regulation by transcription factors and microRNAs. Science. 2008;319(5871):1785–1786. | ||
Fatica A, Bozzoni I. Long non-coding RNAs: new players in cell differentiation and development. Nat Rev Genet. 2014;15(1):7–21. | ||
Huang Daw, Sherman BT, Lempicki RA. Systematic and integrative analysis of large gene lists using DAVID bioinformatics resources. Nat Protoc. 2009;4(1):44–57. | ||
Juss J, Herre J, Begg M, et al. Genome-wide transcription profiling in neutrophils in acute respiratory distress syndrome. Lancet. 2015;385(Suppl 1):S55. | ||
Wang L, du Y, Ward JM, et al. INO80 facilitates pluripotency gene activation in embryonic stem cell self-renewal, reprogramming, and blastocyst development. Cell Stem Cell. 2014;14(5):575–591. | ||
Lv L, Ge W, Liu Y, et al. Lysine-specific demethylase 1 inhibitor rescues the osteogenic ability of mesenchymal stem cells under osteoporotic conditions by modulating H3K4 methylation. Bone Res. 2016;4:16037. | ||
Barragán I, Borrego S, Abd El-Aziz MM, Abd Emetal, et al. Genetic analysis of FAM46A in Spanish families with autosomal recessive retinitis pigmentosa: characterisation of novel VNTRs. Ann Hum Genet. 2008;72(Pt 1):26–34. | ||
Jain N, Iyer KV, Kumar A, Shivashankar GV. Cell geometric constraints induce modular gene-expression patterns via redistribution of HDAC3 regulated by actomyosin contractility. Proc Natl Acad Sci U S A. 2013;110(28):11349–11354. | ||
Teo BK, Wong ST, Lim CK, et al. Nanotopography modulates mechanotransduction of stem cells and induces differentiation through focal adhesion kinase. ACS Nano. 2013;7(6):4785–4798. | ||
Liu W, Wei Y, Zhang X, Xu M, Yang X, Deng X. Lower extent but similar rhythm of osteogenic behavior in hBMSCs cultured on nanofibrous scaffolds versus induced with osteogenic supplement. ACS Nano. 2013;7(8):6928–6938. | ||
Trappmann B, Gautrot JE, Connelly JT, et al. Extracellular-matrix tethering regulates stem-cell fate. Nat Mater. 2012;11(7):642–649. | ||
Mcmurray RJ, Gadegaard N, Tsimbouri PM, et al. Nanoscale surfaces for the long-term maintenance of mesenchymal stem cell phenotype and multipotency. Nat Mater. 2011;10(8):637–644. | ||
Kilian KA, Bugarija B, Lahn BT, Mrksich M. Geometric cues for directing the differentiation of mesenchymal stem cells. Proc Natl Acad Sci U S A. 2010;107(11):4872–4877. | ||
Mcbeath R, Pirone DM, Nelson CM, Bhadriraju K, Chen CS. Cell shape, cytoskeletal tension, and RhoA regulate stem cell lineage commitment. Dev Cell. 2004;6(4):483–495. | ||
Seo CH, Jeong H, Feng Y, et al. Micropit surfaces designed for accelerating osteogenic differentiation of murine mesenchymal stem cells via enhancing focal adhesion and actin polymerization. Biomaterials. 2014;35(7):2245–2252. | ||
Wang W, Zhao L, Ma Q, Wang Q, Chu PK, Zhang Y. The role of the Wnt/β-catenin pathway in the effect of implant topography on MG63 differentiation. Biomaterials. 2012;33(32):7993–8002. | ||
Aragona M, Panciera T, Manfrin A, et al. A mechanical checkpoint controls multicellular growth through YAP/TAZ regulation by actin-processing factors. Cell. 2013;154(5):1047–1059. | ||
Li Y, Chu JS, Kurpinski K, et al. Biophysical regulation of histone acetylation in mesenchymal stem cells. Biophys J. 2011;100(8):1902–1909. | ||
Thakar RG, Cheng Q, Patel S, et al. Cell-shape regulation of smooth muscle cell proliferation. Biophys J. 2009;96(8):3423–3432. | ||
Downing TL, Soto J, Morez C, et al. Biophysical regulation of epigenetic state and cell reprogramming. Nat Mater. 2013;12(12):1154–1162. | ||
Roca-Cusachs P, Alcaraz J, Sunyer R, Samitier J, Farré R, Navajas D. Micropatterning of single endothelial cell shape reveals a tight coupling between nuclear volume in G1 and proliferation. Biophys J. 2008;94(12):4984–4995. | ||
Talwar S, Jain N, Shivashankar GV. The regulation of gene expression during onset of differentiation by nuclear mechanical heterogeneity. Biomaterials. 2014;35(8):2411–2419. | ||
Horna D, Ramírez JC, Cifuentes A, Bernad A, Borrós S, González MA. Efficient cell reprogramming using bioengineered surfaces. Adv Healthc Mater. 2012;1(2):177–182. | ||
Morez C, Noseda M, Paiva MA, Belian E, Schneider MD, Stevens MM. Enhanced efficiency of genetic programming toward cardiomyocyte creation through topographical cues. Biomaterials. 2015;70:94–104. | ||
Yoo J, Kim J, Baek S, Park Y, Im H, Kim J. Cell reprogramming into the pluripotent state using graphene based substrates. Biomaterials. 2014;35(29):8321–8329. | ||
Yu W, Zhang Y, Xu L, Sun S, Jiang X, Zhang F. Microarray-based bioinformatics analysis of osteoblasts on TiO2 nanotube layers. Colloids Surf B Biointerfaces. 2012;93:135–142. | ||
Chen S, Zheng Y, Zhang S, Jia L, Zhou Y. Promotion Effects of miR-375 on the Osteogenic Differentiation of Human Adipose-Derived Mesenchymal Stem Cells. Stem Cell Rep. 2017;8(3):773–786. | ||
Fan C, Jia L, Zheng Y, et al. MiR-34a Promotes Osteogenic Differentiation of Human Adipose-Derived Stem Cells via the RBP2/NOTCH1/CYCLIN D1 Coregulatory Network. Stem Cell Rep. 2016;7(2):236–248. | ||
Robinson PJ, Trnka MJ, Bushnell DA, et al. Structure of a Complete Mediator-RNA Polymerase II Pre-Initiation Complex. Cell. 2016;166(6):1411–1422. | ||
Fazal FM, Meng CA, Murakami K, Kornberg RD, Block SM. Real-time observation of the initiation of RNA polymerase II transcription. Nature. 2015;525(7568):274–277. | ||
Bernecky C, Herzog F, Baumeister W, Plitzko JM, Cramer P. Structure of transcribing mammalian RNA polymerase II. Nature. 2016;529(7587):551–554. | ||
Jiang J, Mo H, Liu C, et al. Inhibition of miR-186-5p contributes to high glucose-induced injury in AC16 cardiomyocytes. Exp Ther Med. 2018;15(1):627–632. | ||
Guo W, Dong Z, Liu S, et al. Promoter hypermethylation-mediated downregulation of miR-770 and its host gene MEG3, a long non-coding RNA, in the development of gastric cardia adenocarcinoma. Mol Carcinog. 2017;56(8):1924–1934. | ||
Li Z, Jin C, Chen S, et al. Long non-coding RNA MEG3 inhibits adipogenesis and promotes osteogenesis of human adipose-derived mesenchymal stem cells via miR-140-5p. Mol Cell Biochem. 2017;433(1–2):51–60. | ||
Li J, Hu C, Han L, et al. MiR-154-5p regulates osteogenic differentiation of adipose-derived mesenchymal stem cells under tensile stress through the Wnt/PCP pathway by targeting Wnt11. Bone. 2015;78:130–141. | ||
Kim EJ, Kang IH, Lee JW, Jang WG, Koh JT. MiR-433 mediates ERRγ-suppressed osteoblast differentiation via direct targeting to Runx2 mRNA in C3H10T1/2 cells. Life Sci. 2013;92(10):562–568. | ||
Wang Y, Jiang XL, Yang SC, et al. MicroRNAs in the regulation of interfacial behaviors of MSCs cultured on microgrooved surface pattern. Biomaterials. 2011;32(35):9207–9217. | ||
Ulitsky I, Bartel DP. lincRNAs: genomics, evolution, and mechanisms. Cell. 2013;154(1):26–46. | ||
Flynn RA, Chang HY. Long noncoding RNAs in cell-fate programming and reprogramming. Cell Stem Cell. 2014;14(6):752–761. | ||
Huang Y, Zheng Y, Jia L, Li W. Long Noncoding RNA H19 Promotes Osteoblast Differentiation Via TGF-β1/Smad3/HDAC Signaling Pathway by Deriving miR-675. Stem Cells. 2015;33(12):3481–3492. | ||
Jin C, Jia L, Huang Y, et al. Inhibition of lncRNA MIR31HG Promotes Osteogenic Differentiation of Human Adipose-Derived Stem Cells. Stem Cells. 2016;34(11):2707–2720. | ||
Jin C, Zheng Y, Huang Y, Liu Y, Jia L, Zhou Y. Long non-coding RNA MIAT knockdown promotes osteogenic differentiation of human adipose-derived stem cells. Cell Biol Int. 2017;41(1):33–41. | ||
Nie F, Yu X, Huang M, et al. Long noncoding RNA ZFAS1 promotes gastric cancer cells proliferation by epigenetically repressing KLF2 and NKD2 expression. Oncotarget. 2017;8(24):38227–38238. | ||
Xia B, Hou Y, Chen H, et al. Long non-coding RNA ZFAS1 interacts with miR-150-5p to regulate Sp1 expression and ovarian cancer cell malignancy. Oncotarget. 2017;8(12):19534–19546. | ||
Hadjidakis DJ, Androulakis II. Bone remodeling. Ann N Y Acad Sci. 2006;1092:385–396. | ||
Franz S, Rammelt S, Scharnweber D, Simon JC. Immune responses to implants – a review of the implications for the design of immunomodulatory biomaterials. Biomaterials. 2011;32(28):6692–6709. | ||
Badique F, Stamov DR, Davidson PM, et al. Directing nuclear deformation on micropillared surfaces by substrate geometry and cytoskeleton organization. Biomaterials. 2013;34(12):2991–3001. | ||
Miousse IR, Currie R, Datta K, et al. Importance of investigating epigenetic alterations for industry and regulators: An appraisal of current efforts by the Health and Environmental Sciences Institute. Toxicology. 2015;335:11–19. | ||
Dearfield KL, Gollapudi BB, Bemis JC, et al. Next generation testing strategy for assessment of genomic damage: A conceptual framework and considerations. Environ Mol Mutagen. 2017;58(5):264–283. | ||
Igarashi K, Ideta-Otsuka M, Narita M. The Current State and Future Development of Epigenetic Toxicology. Yakugaku Zasshi. 2017;137(3):265–271. | ||
Topper MJ, Vaz M, Chiappinelli KB, et al. Epigenetic Therapy Ties MYC Depletion to Reversing Immune Evasion and Treating Lung Cancer. Cell. 2017;171(6):1284–1300. |
 © 2018 The Author(s). This work is published and licensed by Dove Medical Press Limited. The
full terms of this license are available at https://www.dovepress.com/terms
and incorporate the Creative Commons Attribution
- Non Commercial (unported, 3.0) License.
By accessing the work you hereby accept the Terms. Non-commercial uses of the work are permitted
without any further permission from Dove Medical Press Limited, provided the work is properly
attributed. For permission for commercial use of this work, please see paragraphs 4.2 and 5 of our Terms.
© 2018 The Author(s). This work is published and licensed by Dove Medical Press Limited. The
full terms of this license are available at https://www.dovepress.com/terms
and incorporate the Creative Commons Attribution
- Non Commercial (unported, 3.0) License.
By accessing the work you hereby accept the Terms. Non-commercial uses of the work are permitted
without any further permission from Dove Medical Press Limited, provided the work is properly
attributed. For permission for commercial use of this work, please see paragraphs 4.2 and 5 of our Terms.