Back to Journals » Clinical Ophthalmology » Volume 11
The effect of vitreomacular and cataract surgery on oxygen saturation in retinal vessels
Authors Nakano Y ![]() , Manabe K, Osaka R, Takasago Y, Ono A, Kobayashi M, Fujita T, Shiragami C, Hirooka K, Tsujikawa A
, Manabe K, Osaka R, Takasago Y, Ono A, Kobayashi M, Fujita T, Shiragami C, Hirooka K, Tsujikawa A
Received 14 January 2017
Accepted for publication 21 March 2017
Published 21 April 2017 Volume 2017:11 Pages 759—765
DOI https://doi.org/10.2147/OPTH.S132392
Checked for plagiarism Yes
Review by Single anonymous peer review
Peer reviewer comments 2
Editor who approved publication: Dr Scott Fraser
Yuki Nakano, Koichiro Manabe, Rie Osaka, Yukari Takasago, Aoi Ono, Mamoru Kobayashi, Tomoyoshi Fujita, Chieko Shiragami, Kazuyuki Hirooka, Akitaka Tsujikawa
Department of Ophthalmology, Kagawa University Faculty of Medicine, Miki, Japan
Purpose: To evaluate the effects of vitreomacular and cataract surgery on retinal oximetry in vitreomacular disease.
Patients and methods: Thirty-eight eyes with epiretinal membrane (ERM) and 15 with idiopathic macular hole (MH) underwent 25 gauge pars plana vitrectomy combined with cataract surgery and intraocular lens implantation. Retinal oximetry was performed using the Oxymap T1 before, 1 month, and 6 months after surgery. Oxymap T1 simultaneously captures monochrome images of the fundus at two different wavelengths of light. Built-in Oxymap Analyzer software measures the oxygen saturation and vessel diameter.
Results: Mean arterial oxygen saturation significantly increased from 96.8%±6.2% to 100.2%± 5.8% at 1 month and to 99.6%±5.8% at 6 months after surgery (P<0.01). Mean venous oxygen saturation also significantly increased from 54.6%±7.5% to 61.2%±6.4% at 1 month and to 62.6%±5.9% at 6 months after surgery (P<0.01). Mean arteriovenous (A-V) difference decreased from 42.2%±6.6% to 39.0%±7.8% at 1 month and to 37.0%±6.9% at 6 months after surgery (P<0.01). The ERM and MH groups showed similar changes in retinal oxygen saturation. However, there were no significant changes in the caliber of major retinal vessels after surgery (from 125.2±15.2 µm to 124.0±15.4 µm in artery, from 168.7±14.6 µm to 169.8±14.6 µm in vein).
Conclusion: Oxymap T1 was able to measure the increase in oxygen saturation in retinal arteries and veins, which led to a decrease in the A-V difference in oxygen saturation after vitrectomy combined with cataract surgery.
Keywords: oxygen saturation, vitrectomy, vitreomacular disease, retinal vessels
Plain language summary
Why was the study done? Oxygen supply to different parts of the eye is important for normal function. In people with diseases of the eye, eg, diabetic retinopathy, this is abnormal. Surgery to treat eye diseases has been shown to improve the oxygen supply; however, to date, there are limited ways by which we can measure this. This study was performed to evaluate a new commercially available technique for measuring oxygen saturation in the retina.
What did the researchers do and find? This study used Oxymap T1, a newly available non-invasive method, to measure oxygen saturation in the retina of patients with vitreomacular diseases of the eye who were undergoing surgery and cataract repair. It took images of the eye to determine oxygen supply and measure the size of the blood vessels within the eye. We found that oxygen supply increased in the eye following the surgical treatment.
What do these results mean? The Oxymap T1 is a promising tool for measuring oxygen supply to the eye following surgery and cataract repair. However, cataract surgery might influence the measurements and needs to be taken into consideration when using this tool.
Introduction
Sufficient oxygen supply is essential for physiological functioning of the retina. Abnormal retinal oxygenation plays a pivotal role in the pathogenesis of diabetic retinopathy or retinal vein occlusion.1,2 In such ischemic retinal diseases, vitreous surgery has been reported to increase the vitreous oxygen pressure and decrease the levels of various ischemia-induced cytokines within the vitreous cavity.3 In addition, vitreous surgery may contribute to an increase in the retinal oxygen supply, leading to improved oxygen consumption by the retina.4 However, to date, limited methods are available to measure the oxygen concentration in the retina. In vivo measurement of retinal oxygen levels would be of help for the management of such diseases.5
Recently, a non-invasive retinal oximeter Oxymap T1 has become commercially available. Oxymap T1 is based on the principle that deoxyhemoglobin and oxyhemoglobin have different light absorbance profiles at specific wavelengths.6 Because Oxymap T1 utilizes two fundus images at two different wavelengths, the measurement may be influenced by the opacity of the ocular media, especially in patients with cataract. In addition, previous studies have indicated that retinal oximetry is influenced by age, gender, and ethnicity (fundus pigmentation). Several investigators have reported the change in the retinal oximetry using the Oxymap T1 after vitreous surgery.7,8 To date, however, there is insufficient evidence with regard to the effect vitreous surgery has on retinal oximetry. Thus, the purpose of this study was to evaluate the changes in oxygen saturation in the major retinal vessels using the Oxymap T1 after vitreous surgery combined with cataract surgery for vitreomacular diseases.
Patients and methods
The ethics committee at Kagawa University Faculty of Medicine approved this prospective study, which was conducted in accordance with the tenets of the Declaration of Helsinki. Written informed consent was obtained from each subject before any study procedures or examinations were performed. This study is registered at ClinicalTrials.gov (NCT02318641).
Subjects
We recruited 79 eyes of 73 Japanese subjects with vitreomacular disease, who planned to have pars plana vitrectomy combined with cataract surgery performed at Kagawa University Hospital between December 2014 and June 2016. Sixty-one eyes had epiretinal membrane (ERM) and 18 had idiopathic macular hole (MH). Oxygen saturation in the major retinal vessels was measured using the Oxymap T1 (Oxymap ehf, Reykjavik, Iceland).
In this study, the exclusion criteria were as follows: keratoconus, high myopia (more severe than −6 diopters or ocular axial length >26.5 mm), prior intraocular surgery, or any co-existing ocular disease (eg, glaucoma, diabetic retinopathy, retinal vein or artery occlusion, hypertensive retinopathy, age-related macular degeneration, retinal degenerative disease, or senile cataract that diminished image quality). To avoid measurement error, mainly due to cataract, we also excluded eyes whose value of combined image quality in the Oxymap Analyzer was <6.0. Finally, this study comprised 53 eyes of 52 patients.
Surgical procedure
In all cases, we performed 25 gauge pars plana vitrectomy including inner limiting membrane (ILM) peeling under the staining of brilliant blue G. BSS PLUS 500 Intraocular irrigating solution 0.0184% (Alcon Inc., Fort Worth, TX, USA) perfused intraocular by setting regulated 25 mmHg, using Constellation Vision System (Alcon Inc.) After performing the core vitrectomy, posterior vitreous detachment was induced if it did not occur. In cases of idiopathic MH, gas tamponade with 10% sulfur hexafluoride (SF6) was performed at the end of surgery, and patients were placed in a facedown position for 3 days. We also performed cataract surgery with implantation of an intraocular lens, combined with vitrectomy in all patients.
Image acquisition for retinal oximetry
The principle of a commercially available retinal oximeter Oxymap T1 has been described in detail by other researchers.5 In brief, the Oxymap T1 is composed of two digital cameras, an image splitter, and two narrow band-pass filters that are attached to a fundus camera (TRC-50DX; Topcon, Tokyo, Japan). The Oxymap T1 simultaneously captures two fundus images at two different wavelengths of light (570 nm and 600 nm) (Figure 1). Light at 570 nm, which is isosorbetic to deoxyhemoglobin and oxyhemoglobin, is insensitive to oxygen saturation. In contrast, light at 600 nm is more sorbetic to oxyhemoglobin than to deoxyhemoglobin and is sensitive to oxygen saturation.
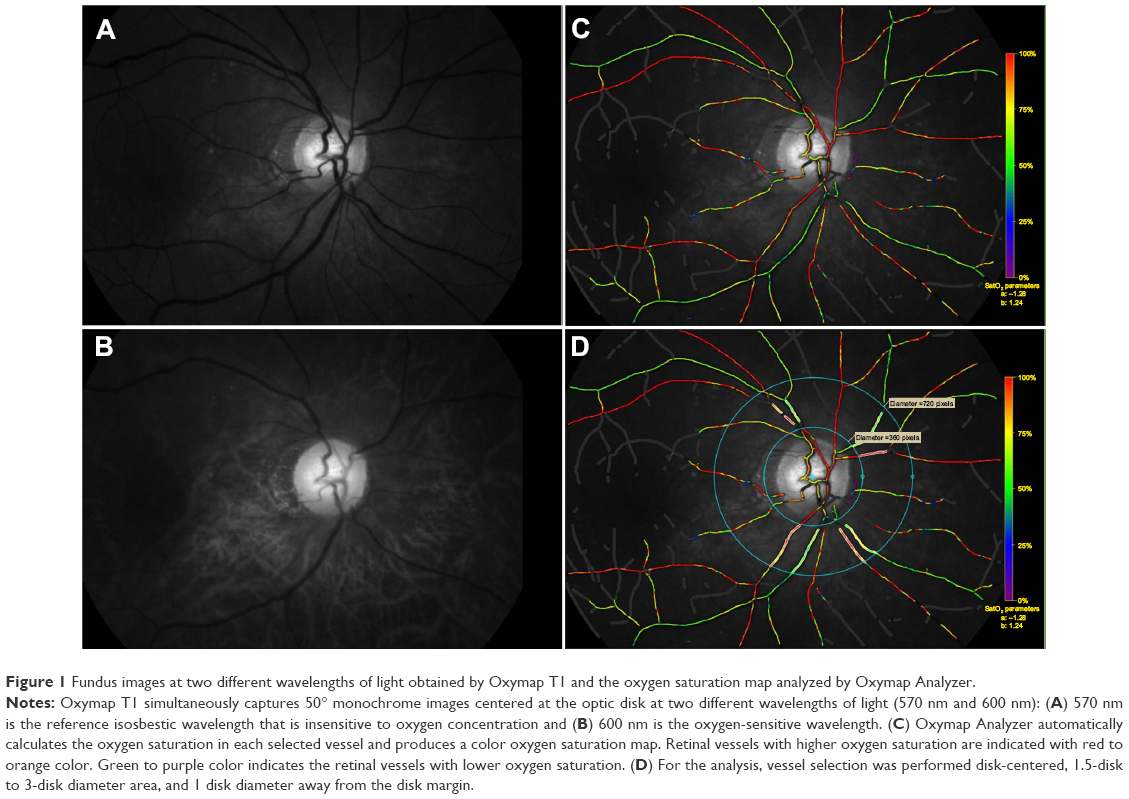 | Figure 1 Fundus images at two different wavelengths of light obtained by Oxymap T1 and the oxygen saturation map analyzed by Oxymap Analyzer. |
After a comprehensive medical interview, all subjects underwent a thorough ocular examination, including autorefractometry, best-corrected visual acuity (BCVA) measurement with a 5 m Landolt chart, slit lamp examination, intraocular pressure measurement, dilated fundoscopy, and optical coherence tomography (Spectralis HRA + OCT; Heidelberg Engineering, Heidelberg, Germany).
After mydriasis with 0.5% tropicamide and 0.5% phenylephrine hydrochloride (Mydrin-P; Santen, Osaka, Japan), each eye included in the study was examined with the Oxymap T1 (Figure 1) in a dark room. The setting used by the Oxymap T1 for image acquisition was as follows: flash intensity was 50 W·s and small aperture and large pupil settings were applied to the fundus camera. Fifty-degree fundus images were obtained using the Oxymap T1, and the image was centered at the optic disk. At each setting, more than two images were obtained per eye. In each patient, this image acquisition was performed before surgery and 1 month and 6 months postoperatively.
Oxygen saturation and vessel diameter measurement from acquired images
Fundus images acquired with the Oxymap T1 were processed using the built-in software Oxymap Analyzer (version 2.5.1, Oxymap Ehf). The software calculates the optical density of the retinal vessels at two wavelengths (570 nm and 600 nm) (Figure 1). The ratio of the optical densities at these two wavelengths has an inverse and approximately linear relationship with oxygen saturation. The resolution of the Oxymap T1 was 9 μm.9
Using each of the acquired images that had been centered at the optic disk, oxygen saturation was calculated in the major retinal arteries and veins in the measurement zone that contained >8 pixels in vessel width. The evaluators set analyzed vessel segments in a standardized manner. For the analysis, vessel selection was performed with the disk centered in a 1.5- to 3-disk diameter area and 1 disk diameter away from the disk margin to avoid uneven retinal background reflections near the optic disk margin (Figure 1).10 All branches and vessel crossings within the measurement area were also manually excluded from the analysis. After detailed selection of the vessel section for the analysis was performed, the Oxymap Analyzer automatically measured the levels of oxygen saturation and vessel diameter in each selected vessel. The oxygen saturation and vessel diameter were calculated in each major retinal artery and vein in four quadrants, and the mean value of quadrants in all four vessels was used in the analysis.
Statistical analysis
All data were collected in an Excel database (Microsoft Office 2010; Microsoft, Redmond, WA, USA). All statistical analyses were conducted using R software (version 3.2.2; R Foundation for Statistical Computing, Vienna, Austria). Wilcoxon tests with the Bonferroni correction and Friedman rank sum test were used to assess the difference among the values obtained at the three time points, before, 1 month, and 6 months after surgery.
Results
In this study, we performed 25 gauge pars plana vitrectomies combined with cataract surgery and implantation of an intraocular lens in 53 eyes with vitreomacular disease. The mean age was 68.2±6.9 years (range, 47–86 years) (Table 1). Anatomical success was achieved in all cases, and no eyes needed any additional surgeries. Mean visual acuity (VA) significantly improved from 0.312±0.241 to 0.129±0.190, 6 months after surgery (P<0.001; Wilcoxon test with Bonferroni correction). Mean intraocular pressure was significantly decreased from 15.5±2.8 mmHg to 14.3±2.6 mmHg, 6 months after surgery (P=0.001).
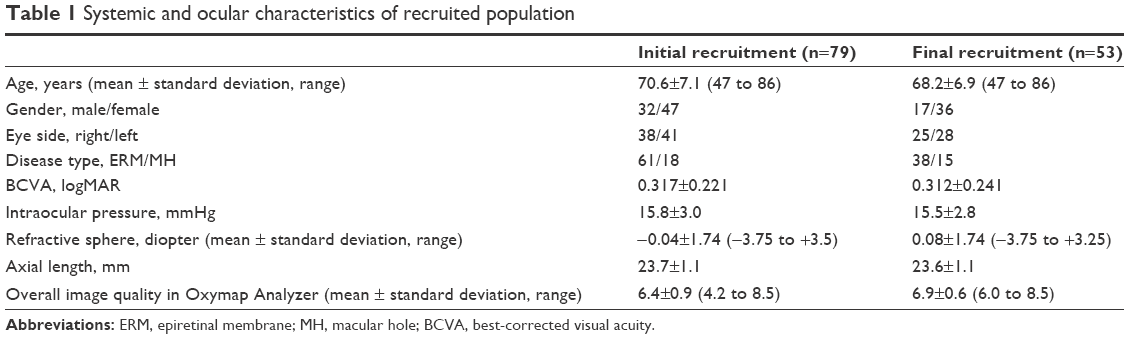 | Table 1 Systemic and ocular characteristics of recruited population |
In all patients, the Oxymap T1 allowed us to capture monochromatic fundus images at two wavelengths, and oxygen saturation and vessel diameters in each major retinal vessel were calculated using the Oxymap Analyzer. Table 2 shows the mean oxygen saturation in the four quadrants before, 1 month, and 6 months after surgery. The mean arterial oxygen saturation significantly increased from 96.8±6.2% to 100.2±5.8% at 1 month and to 99.6±5.8% at 6 months after surgery (P<0.01). Mean venous oxygen saturation also significantly increased from 54.6±7.5% to 61.2±6.4% at 1 month and to 62.6±5.9% at 6 months after surgery (P<0.01). Mean arteriovenous (A-V) difference decreased from 42.2±6.6% to 39.0±7.8% at 1 month and to 37.0±6.9% at 6 months after surgery (P<0.01). Figure 2 shows the change in mean retinal oxygen saturation in the ERM and MH groups. Each group showed similar changes in retinal oxygen saturation.
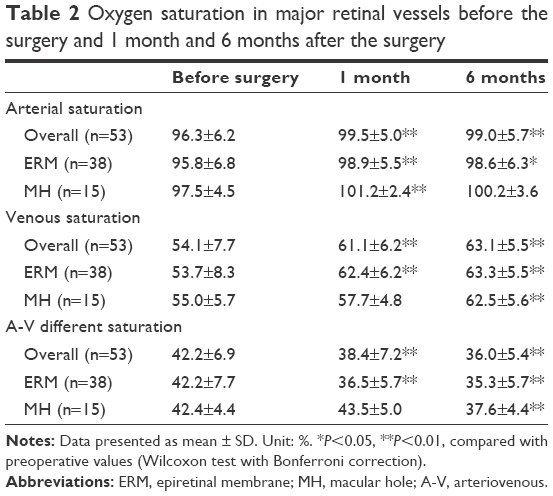 | Table 2 Oxygen saturation in major retinal vessels before the surgery and 1 month and 6 months after the surgery |
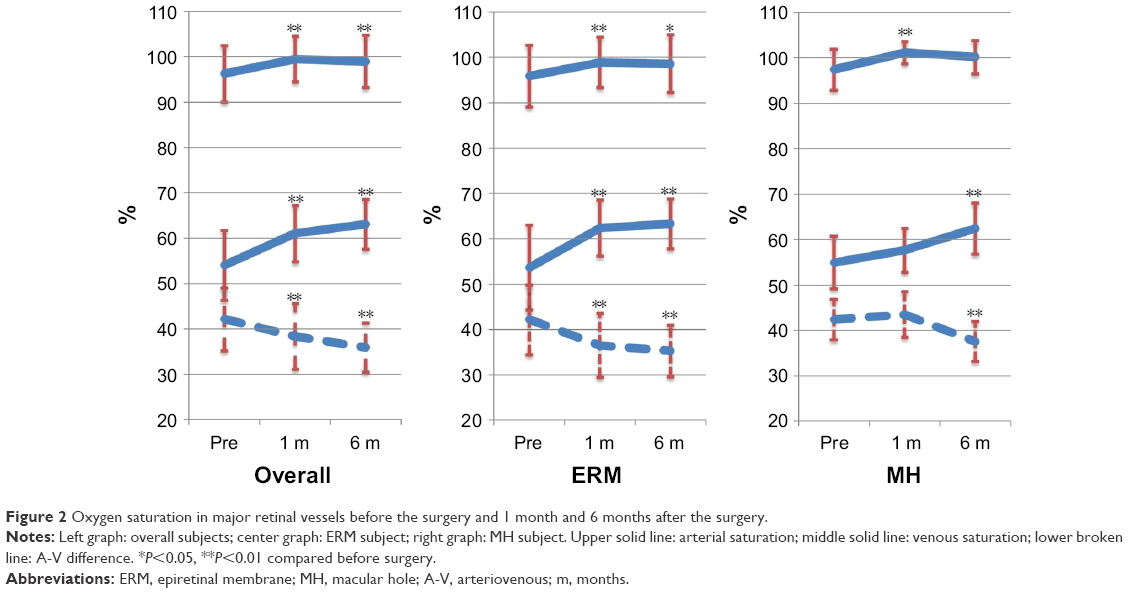 | Figure 2 Oxygen saturation in major retinal vessels before the surgery and 1 month and 6 months after the surgery. |
Table 3 shows mean vessel diameter in the four quadrants before, 1 month, and 6 months after surgery. After surgery, the caliber of major retinal vessels significantly changed. Arterial vessel diameter at 1 month was significantly lower (P=0.031); however, when the Friedman rank sum test was performed, this was not significant (P=0.11). Figure 3 shows the change in mean retinal vessel diameter in the ERM and MH groups. Each group showed no significant changes in the diameter of the major retinal vessels.
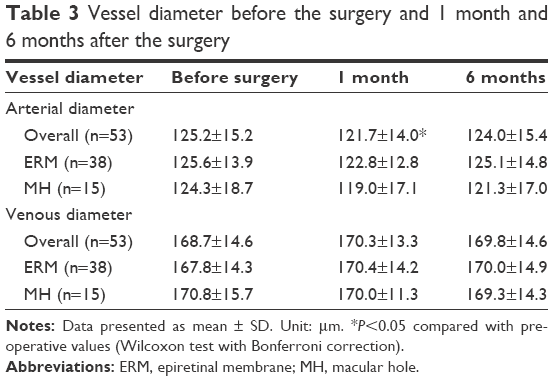 | Table 3 Vessel diameter before the surgery and 1 month and 6 months after the surgery |
 | Figure 3 Vessel diameter before the surgery and 1 month and 6 months after the surgery. |
Discussion
This study measured oxygen saturation and vessel diameter via retinal oximetry using the Oxymap T1 in eyes with ERM and MH undergoing pars plana vitrectomy combined with cataract surgery and intraocular lens implantation. Accumulating evidence revealed that the oxygen concentration in the major retinal vessels might vary depending on age, gender, or ethnicity. Recently, Nakano et al11 reported a normative database of retinal oximetry using the Oxymap T1 in 252 healthy Japanese patients. Those aged 60–79 years had a mean retinal oxygen saturation of 97.4±7.2% in arteries and 51.8±9.0% in veins. In this study, the mean preoperative oxygen saturation was 96.3±6.2% in arteries and 54.1±7.7% in veins. In our patients, the arterial saturation was similar to that reported by Nakano et al. However, our patients had slightly higher levels of oxygen saturation in the major retinal veins. Nakano et al11 reported a mean retinal vessel diameter of 124.6±14.4 μm in arteries and 167.3±14.6 μm in veins. In our patients, the mean retinal vessel diameter was 125.2±15.2 μm in arteries and 168.7±14.6 μm in veins. We believe that our patients had retinal oximetry measurements and vessel diameters that are similar to healthy Japanese subjects.
Based on various experimental studies, it is generally accepted that the oxygen pressure in the vitreous cavity increases after vitrectomy. However, reports on the change in retinal oximetry after vitreous surgery are limited. In this study, oxygen saturation increased postoperatively by 2.8% in arteries and by 9.0% in veins, leading to a reduction in the A-V difference of 6.2%. With the use of the Oxymap T1, Lim et al7 and Šín et al8 reported similar findings that the retinal arterial and venous oxygen saturation were significantly increased after vitrectomy, leading to a decrease in the A-V difference. Based on previous reports and our current findings, retinal oxygen saturation increased in retinal arteries and further increased in retinal veins, and consequently, the A-V difference decreased.
However, the reason for these changes in retinal oximetry after vitreous surgery is uncertain. Maeda et al12 reported that vitreous surgery changed the intraocular oxygen distribution within not only the vitreous cavity but also the lens and anterior chamber. One possibility is that the removal of the vitreous may contribute to the increased retinal oxygen saturation by allowing for the diffusion of oxygen from the anterior segment. Diffused oxygen from the anterior segment may explain the decreased oxygen consumption supplied from the retinal vessels. Another possibility is that an increase in the velocity of blood flow in the retinal microcirculation could lead to a decrease in retinal oxygen intake after vitreous surgery. Using color Doppler imaging, Sullu et al13 showed that blood flow velocity in the central retinal artery increased after vitreous surgery. In addition, Kadonosono et al14 and Yagi et al15 showed that perifoveal capillary blood flow velocity increased after vitrectomy. A decrease in oxygen consumption in the retina postoperatively may be explained by the accelerated blood flow in the retinal microcirculation.
Measurements obtained using the Oxymap T1 are influenced by a translucent opacity, ie, cataract, and vitreous or corneal opacity. Previous reports have shown that the measurement of arterial and venous retinal oxygen saturation tended to be lower in images of poor quality.16,17 To minimize the effects of cataract in this study, we excluded 26 patients, whose “image quality” was <6.0 before surgery. However, all subjects underwent vitrectomy combined with cataract surgery, which would influence the retinal oximetry measurements obtained postoperatively. In our patients, however, the A-V difference was markedly lower after surgery, which could not be explained by cataract surgery alone. We believe that cataract surgery had a minimal influence on the measurements, but it is clearly sure that cataract surgery influenced the result of the change of oxygen saturation.
Using the Oxymap T1, Šín et al8 studied retinal oximetry after vitrectomy in three groups classified by their lens state; pseudophakic, phakic, and phakic eyes that underwent triple surgery including cataract surgery. It is well known that phakic eyes often suffer from nuclear cataract after vitreous surgery. In their report, eyes with postoperative nuclear cataract exhibited higher levels of oxygen saturation in both arteries and veins. Based on their findings, vitrectomy alone for phakic eyes might produce measurement errors postoperatively. Pseudophakic eyes are the most ideal for these experiments, because the lens status does not change after surgery. They also reported that pseudophakic eyes had higher oxygen saturation in arteries and veins after vitrectomy, leading to the reduction in A-V difference. These changes in retinal oximetry were comparable with patients in our study who underwent vitrectomy combined with cataract surgery.
Šín et al8 reported constriction of arterial and venous vessels after vitrectomy, using the Oxymap T1. Lee et al18 reported a similar result using retinal photographs. Olafsdottir et al19 reported a decrease in the vessel diameter of arterioles and veins during 100% oxygen breathing using the Oxymap T1. After vitreous surgery, oxygen saturation is likely to increase in the retina and in the vitreous cavity; therefore, retinal vessels may well show constriction. In our previous study using the Oxymap T1, we found that arteries constricted by 3.4% and veins by 5.0% postoperatively. In this study, there were no changes in the retinal vessel diameter after vitreous surgery. The reason for this discrepancy is uncertain.
This study has a number of limitations. This includes the relatively small number of patients analyzed, particularly MH group (n=15), and the short follow-up period. Recently, Chen et al reported retinal oxygen saturation using the Oxymap T1 after cataract surgery alone. They found that arterial and venous retinal oxygen saturation increased after surgery by 3.1% and 8.1%, respectively, in eyes with grade 1 cataract.20 Cataract surgery even in those who are low grade may influence retinal oximetry measurements. However, postoperative nuclear cataract may also induce increases in retinal oximetry measurements. A fundamental limitation of this study was the design, as we included patients undergoing cataract surgery. It should be kept in mind that the results of this study were affected by not only vitrectomy but also cataract surgery. Further studies in pseudophakic eyes are necessary to confirm the effect of vitreous surgery on retinal oximetry measurements.
Conclusion
Oxymap T1 was able to measure the increase in oxygen saturation in retinal arteries and veins, which led to a decrease in the A-V difference in oxygen saturation in patients who underwent vitrectomy combined with cataract surgery for ERM and MH.
However, cataract surgery influences Oxymap T1 measurements, and this should be kept in mind in these patients.
Acknowledgments
This work has been presented at the 54th annual meeting of the Japanese Retina and Vitreous Society held on December 6, 2015. The authors received no public or private financial support.
Disclosure
A Tsujikawa reports conflicts of interest (financial disclosures) from Pfizer, Bayer, Santen, Novartis, Senju, Alcon, Nidek, AMO Japan, and Japan Society for the Promotion of Science. The other authors report no conflicts of interest in this work.
References
Eliasdottir TS, Bragason D, Hardarson SH, Kristjansdottir G, Stefánsson E. Venous oxygen saturation is reduced and variable in central retinal vein occlusion. Graefes Arch Clin Exp Ophthalmol. 2014;253(10):1653–1661. | ||
Traustason S, la Cour M, Larsen M. Retinal vascular oximetry during ranibizumab treatment of central retinal vein occlusion. Br J Ophthalmol. 2014;98(9):1208–1211. | ||
Stefánsson E. Physiology of vitreous surgery. Graefes Arch Clin Exp Ophthalmol. 2009;247(2):147–163. | ||
Williamson TH, Grewal J, Gupta B, Mokete B, Lim M, Fry CH. Measurement of PO2 during vitrectomy for central retinal vein occlusion, a pilot study. Graefes Arch Clin Exp Ophthalmol. 2009;247(8):1019–1023. | ||
Hardarson SH. Retinal oximetry. Acta Ophthalmol. 2013;91(Thesis 2):1–47. | ||
Traustason S, Kiilgaard JF, Karlsson RA, Hardarson SH, Stefansson E, la Cour M. Spectrophotometric retinal oximetry in pigs. Invest Ophthalmol Vis Sci. 2013;54(4):2746–2751. | ||
Lim LS, Tan L, Perera S. Retinal vessel oxygen saturation increases after vitrectomy. Invest Ophthalmol Vis Sci. 2014;55(6):3851–3856. | ||
Šín M, Chrapek O, Karhanová M, et al. The effect of pars plana vitrectomy and nuclear cataract on oxygen saturation in retinal vessels, diabetic and non-diabetic patients compared. Acta Ophthalmol. 2016;94(1):41–47. | ||
Blondal R, Sturludottir MK, Hardarson SH, Halldorsson GH, Stefánsson E. Reliability of vessel diameter measurements with a retinal oximeter. Graefes Arch Clin Exp Ophthalmol. 2011;249(9):1311–1317. | ||
Beach JM, Schwenzer KJ, Srinivas S, Kim D, Tiedeman JS. Oximetry of retinal vessels by dual-wavelength imaging: calibration and influence of pigmentation. J Appl Physiol. 1999;86(2):748–758. | ||
Nakano Y, Shimazaki T, Kobayashi N, et al. Retinal oximetry in a healthy Japanese population. PLoS One. 2016;11(7):1–12. | ||
Maeda N, Tano Y. Intraocular oxygen tension in eyes with proliferative diabetic retinopathy with and without vitreous. Graefes Arch Clin Exp Ophthalmol. 1996;234(suppl 1):S66–S69. | ||
Sullu Y, Hamidova R, Beden U, Yakupov K, Canbaz S, Danaci M. Effects of pars plana vitrectomy on retrobulbar haemodynamics in diabetic retinopathy. Clin Exp Ophthalmol. 2005;33(3):246–251. | ||
Kadonosono K, Itoh N, Nomura E, Ohno S. Capillary blood flow velocity in patients with idiopathic epiretinal membranes. Retina. 1999;19(6):536–539. | ||
Yagi T, Sakata K, Funatsu H, Hori S. Evaluation of perifoveal capillary blood flow velocity before and after vitreous surgery for epiretinal membrane. Graefes Arch Clin Exp Ophthalmol. 2012;250(3):459–460. | ||
Patel SR, Hudson C, Flanagan JG, Heitmar R. The effect of simulated cataract light scatter on retinal vessel oximetry. Exp Eye Res. 2013;116:185–189. | ||
Hardarson SH, Bragason D, Eysteinsson T, Stefansson E. The effect of cataract on retinal oximetry. Invest Ophthalmol Vis Sci. 2014;55(13):201. | ||
Lee SU, Nam KY, Lee SJ. Surgically induced changes in retinal vessel diameter, retinal nerve fibre layer thickness, and the optic disc after 23-gauge pars plana vitrectomy. Int Ophthalmol. Epub 2016 Aug 4:doi:10.1007/s10792-016-0302-8. | ||
Olafsdottir OB, Eliasdottir TS, Kristjansdottir JV, Hardarson SH, Stefánsson E. Retinal vessel oxygen saturation during 100% oxygen breathing in healthy individuals. PLoS One. 2015;10(6):e0128780. | ||
Chen H, Lin H, Chen W, et al. Preoperative and postoperative measurements of retinal vessel oxygen saturation in patients with different grades of cataracts. Acta Ophthalmol. Epub 2016 Nov 19:1–7. doi:10.1111/aos.13332. |
 © 2017 The Author(s). This work is published and licensed by Dove Medical Press Limited. The
full terms of this license are available at https://www.dovepress.com/terms
and incorporate the Creative Commons Attribution
- Non Commercial (unported, 3.0) License.
By accessing the work you hereby accept the Terms. Non-commercial uses of the work are permitted
without any further permission from Dove Medical Press Limited, provided the work is properly
attributed. For permission for commercial use of this work, please see paragraphs 4.2 and 5 of our Terms.
© 2017 The Author(s). This work is published and licensed by Dove Medical Press Limited. The
full terms of this license are available at https://www.dovepress.com/terms
and incorporate the Creative Commons Attribution
- Non Commercial (unported, 3.0) License.
By accessing the work you hereby accept the Terms. Non-commercial uses of the work are permitted
without any further permission from Dove Medical Press Limited, provided the work is properly
attributed. For permission for commercial use of this work, please see paragraphs 4.2 and 5 of our Terms.