Back to Journals » Psychology Research and Behavior Management » Volume 14
The Effect of Product Image Dynamism on Purchase Intention for Online Aquatic Product Shopping: An EEG Study
Authors Wang J, Wang A, Zhu L, Wang H
Received 8 April 2021
Accepted for publication 3 June 2021
Published 15 June 2021 Volume 2021:14 Pages 759—768
DOI https://doi.org/10.2147/PRBM.S313742
Checked for plagiarism Yes
Review by Single anonymous peer review
Peer reviewer comments 2
Editor who approved publication: Dr Igor Elman
Jiefeng Wang,1 Ailian Wang,2 Lian Zhu,3 Haohan Wang1
1Business School, Ningbo University, Ningbo, Zhejiang Province, People’s Republic of China; 2Laboratory of Applied Brain and Cognitive Sciences, School of Business and Management, Shanghai International Studies University, Shanghai, People’s Republic of China; 3School of Journalism and Communication, Shanghai International Studies University, Shanghai, People’s Republic of China
Correspondence: Lian Zhu; Haohan Wang Email [email protected]; [email protected]
Purpose: The normalization of epidemic prevention and control triggered a fierce scuffle in the e-commerce of fresh food, as well as for aquatic products online shopping. The main difficulty for consumers to buy fresh food online has always been information asymmetry. Previous study reported that the image is still the primary information source to address information asymmetry. Yet, few studies have focused on the image presentation of aquatic products in e-commerce. The current study aims to probe the effect of perceived movement of e-commerce pictures on purchase intention of aquatic products. Further, we examine how consumers’ cognitive conflict and emotion occur when purchasing specific aquatic products with different image dynamism.
Methods: Twenty-eight subjects participated in an experiment with a 2-level product category (fresh vs frozen) × 2-level image dynamism (static vs dynamic) design. During the experiment, participants were asked to rate their purchase intention after they browse the experimental stimulus. We recorded subjects’ electroencephalograms (EEGs) throughout the experiment.
Results: Behaviorally, participants’ purchase intention for the dynamic image was significantly greater than that for the static image, regardless of aquatic product categories. At the neural level, we found that dynamic image produced less cognitive conflict and aroused consumers’ positive feelings, which were reflected in decreased N2 amplitudes and latency as well as increased LPP (late positive potential) amplitude, respectively. This effect was enhanced for fresh aquatic products.
Conclusion: Although picture dynamism only increases perceived movement, it can still induce positive emotions toward the product and lead to a greater purchase intention. The current study emphasized the value of the neuroscience method in revealing consumer cognition and emotion duration product evaluation.
Keywords: image dynamism, ERPs, N2, LPP, aquatic product, purchase intention
Introduction
Due to the sudden epidemic, the e-commerce of fresh products transactions reached 182.12 billion yuan in the first half of 2020, representing an increase of 137.6% year-on-year and exceeding the entire year of 2019. Unlike traditional offline transactions, consumers are spatially separated from products when buying fresh food online. This separation inevitably leads to asymmetric information between buyers and sellers. It has been reported that information asymmetry is the main difficulty for consumers in making purchasing decisions to buy fresh food online, and it has become the main reason why it is hard to establish trust relationships between platform merchants and users.1
Compared with traditional e-commence markets, since the e-commerce of fresh products is a rising trend, only a few scholars have studied this domain. The current research content is mainly about consumer safety awareness,2 consumer confidence in food quality,3 consumption security concerns,4 the reliability of logistics systems5 and consumers’ willingness to pay for organic fresh products.6 There are also some studies on aquatic product e-commerce. For instance, Fabinyi et al (2016) investigated the aquatic product consumption patterns and attitudes towards sustainable development of 300 aquatic product consumers in Beijing and Shanghai.7 Hu et al (2014) surveyed targeting university students about personal consumption preferences for aquatic products.8 Besides, Zhang proposed an improved BP neural network to forecast the aquatic product export volume.9 However, no study has focused on the image presentation of aquatic products in e-commerce, although the image is still the main information source to address information asymmetry.
From the perspective of vividness, studies mostly divided product image presentation into dynamic and static presentation.10 Dynamic presentation simulates the position change and rotation of objects, which present the moving of objects.11,12 Static presentation refers to static and fixed objects. It was reported that dynamic and static presentation of product picture will greatly influence consumer attitudes and behaviors, by helping consumers identify and judge the objects’ visual attributes.11,12 Specifically, compared to static presentations, dynamic presentations can enhance consumers’ attention,13 influence consumers satisfaction,14 and improve product evaluation by helping boost consumers’ imagination and processing of products.10 Therefore, we proposed that the image dynamism of aquatic product may affect online consumers’ decisions. Specifically, we investigated consumers’ purchase intention and attitude toward dynamically and statically presented aquatic product pictures for fresh and frozen food.
Recently, noninvasive neuroscience technology has been a rapid development. Event-related potentials (ERPs), as an essential neuroscience method, were widely used to measure human cognitive and emotional processes. These neuroscience methods are believed to capture the information that cannot be obtained by self-report based scales and interviews.15 Therefore, the current study intends to employ ERPs to investigate the cognitive and emotional processes of consumers during their evaluation of online aquatic product pictures.
According to previous marketing-related neuroscience studies, N2 and LPP (Late positive potential) are two commonly examined ERPs components.16–18 N2 is a typical negative ERP component that reaches its peak at approximately 250–350 ms after the onset of a stimulus and reaches its maximum in frontal areas.19 N2 was first found in the go/no-go paradigm and was explained as related to cognitive control.19 For example, Eimer (1993) found the no-go stimulus can elicit a larger N2 amplitude than the go stimulus in a go/no-go task.20 Furthermore, the N2 component is also found and explained to reflect cognitive control in the consumer neuroscience studies.21–23 Shang et al (2017) work examined the different brain activity when evaluating the product with or without social risk, which found the social risk condition elicited larger N2 amplitude than the condition without social risk. The authors explained that conflict control was caused by the conflict between an inherent desire to purchase the product and discordant information from social interaction, which reflected in the larger N2 amplitude.23 Additionally, the latency of N2 component was reported to be a useful index for tracking the timing to evaluate a stimulus,24,25 and more conflict condition elicits longer latency.19 In the current study, we considered that a dynamic product image might also influence consumers’ evaluation of the product. Accordingly, we hypothesized that static image will produce greater cognitive control during the evaluation of aquatic products and elicit a larger N2 (negative polarity) than dynamic image. As for N2 latency, we expect to observe a greater discrepancy between fresh and frozen aquatic products condition, since it is significantly related to the conflict condition.19 Particularly, compared to static image, dynamic image may enhance consumers’ engagement and evaluations of products.26 Moreover, consumers may expect the fresh aquatic products to be more alive, bouncing, and dynamic than frozen aquatic products. Due to these, they may perceive greater conflicts when encountering static image when purchasing fresh aquatic products, compared to dynamic image. However, this effect may not happen when purchasing frozen aquatic products, since this product give consumers a sense of stillness. Thus, we hypothesized that static image would elicit a longer N2 latency for fresh aquatic products than dynamic image. Furthermore, we expected no N2 latency difference between the static and dynamic image for the frozen aquatic product condition.
LPP is a late-stage ERP component, which reaches its peak between 300 and 800 ms after the onset of a stimulus27 and is also a commonly examined ERP component. It was reported that LPP is sensitive to the cognitive process of emotion regulation,16,28–30 and a larger LPP amplitude indicates stronger emotional arousal.18 Thus, given the emotional arousal sensitivity of LPP, in the current study, we proposed that LPP represents an emotional regulation process for the product picture in the later evaluation stage. We supposed that the LPP amplitude might be larger for dynamic image products than for static products.
In this study, ERP technology was applied to explore consumers’ underlying cognitive mechanisms when making purchase decisions for aquatic products with static vs dynamic dynamism in online shopping. Based on the above discussed, we hypothesized that the picture dynamism of aquatic products might induce different brain activity, which would be found in distinctions in N2 and LPP amplitudes. Furthermore, because the N2 latency can also reflect the conflict, we posited that a static product would elicit a longer N2 latency than the dynamic image condition for fresh products. In contrast, for the frozen product condition, there would be no N2 latency difference between static and dynamic image.
Materials and Methods
Participants
We recruited thirty (15 female) healthy graduate and undergraduate students from Ningbo University with ages ranging from 18–25 (M=20.53, S.D.= 1.89) in the current experiment. All the subjects were right-handed native Chinese speakers with normal or corrected vision and no history of neurological or psychiatric diseases. Data from two male participants were removed due to excessive artifacts. Artifacts are signals recorded by EEG but not generated by brain, such as eye movements, myogenic, shivering, sniffling, and hiccupping. To remain useful ERPs signals, we use several artifact removal techniques to reject and correct artifacts. Excessive artifacts will lose a lot of useful ERP signals. Thus, a total of 28 valid participants were left in this experiment. Each subject received 40 yuan as a participant fee after finishing the experiment. Before the formal experiment, we asked participants to write an informed consent. The study was conducted in accordance with the ethical standards of the institutional research committee and with the 1964 Helsinki Declaration and its later amendments or comparable ethical standards31 and was approved by the internal review committee of the Academy of Neuroeconomics and Neuromanagement at Ningbo University.
Materials
The current study employed a 2×2 within-subjects designs. The first factor referring to aquatic product categories (fresh vs frozen) and the second factor referring to image dynamism (static vs dynamic). There are two kinds of aquatic products in real marketing places, eg, fresh and frozen. For image dynamism, a pilot study was employed to screen static and dynamic aquatic product pictures. We downloaded 60 different pictures of aquatic products from the internet, including common aquatic product categories, such as fish, shrimp, crab. Then, 32 participants recruited from Ningbo University were asked to rate the dynamism of each picture. Twenty dynamic (M=4.880, S.D.=0.367) and twenty static pictures (M=3.422, S.D.=0.408) were chosen. A pairwise t-test was conducted for the dynamism of these two groups of pictures, which showed a significant difference between them [t(1,31)=11.508, p<0.001]. This experiment contained 160 trials, separated into 4 blocks of 40 trials. All trials were presented randomly in each block. We set the size of each picture to 270×360 pixels, and unified the background as gray.
Procedures
A dim, sound-attenuated, electrically shielded room was used for this experiment. The experimental stimuli were presented in the middle of a computer-controlled monitor (1280 × 1024 pixels, 60 Hz). This monitor was display at a distance of 100 cm from the subject and with a visual angle of 2.588°. A keypad was provided to subjects to make a purchase intention rating (press 1 to decrease, press 3 to increase and press 2 to confirmation). All the participants were provided a brief introduction to the experimental process before the formal experiment started. We started the formal experiment after they understood the process.
Each trial began with a fixation cross for 600–800 ms on a blank screen (see Figure 1). Next, an image with a product category (fresh vs frozen) appeared for 1500 ms, followed by a blank screen for 400–600 ms. The product picture (static vs dynamic) was subsequently shown for 1500 ms. Then, the sentence “Please rate your purchase intention” appeared, and the participants had to rate their purchase intention from 1 “very low” to 5 “very high” by pressing a button. Each trial ended with the subjects press the button. We asked participants to minimize eye and muscle movement during the experiment. All the stimulus presentation, triggers and response recording were based on the E-Prime 3.0 software package (Psychology Software tools, Pittsburgh, PA, USA). Before the formal experiment, participants were allowed to conduct 8 practice trials to ensure them familiar with the experimental procedure.
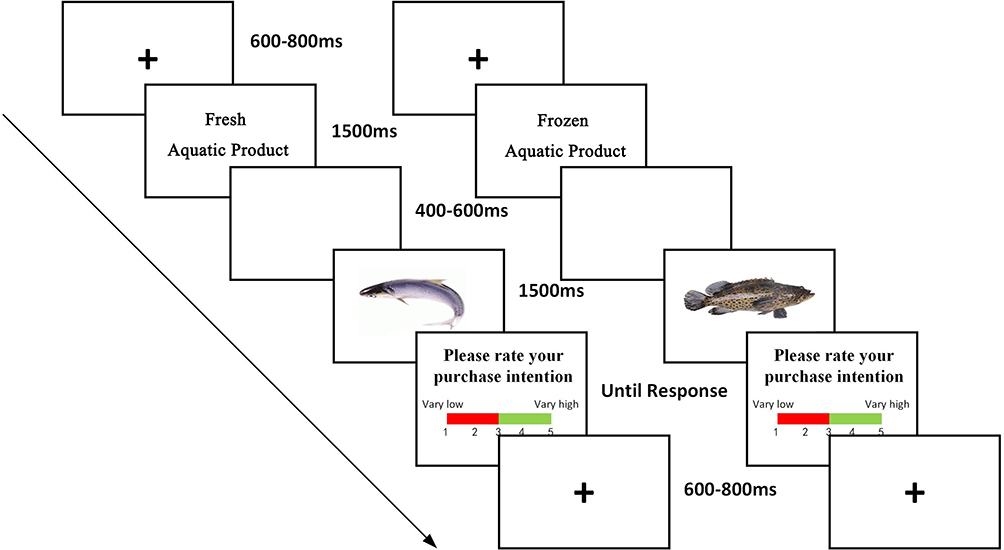 |
Figure 1 A single trial of the experimental procedure. Participants were instructed to report their purchase intention toward four kinds of aquatic products (fresh-static, fresh-dynamic, frozen-static and frozen-dynamic) on a 5-point scale. Electroencephalograms (EEGs) were recorded from the subjects throughout the experiment. |
EEG Data Recording and Analysis
We used a Neuroscan Synamp2 Amplifier (Curry8, Neurosoft Labs, Inc., Virginia, USA) to record Electroencephalograms (EEGs) with a bandpass of 0.05–100 Hz and a sampling rate of 500 Hz. According to the extended international 10–20 system, we placed sixty-four Ag/AgCl electrodes at scalp sites. The reference site was placed on the left mastoid, and the ground site was placed on an electrode between PFz and Fz on the forehead. A pair of electrodes placed above and below the left eye parallel to the pupil recorded the vertical electrooculograms (EOGs), and another pair of electrodes placed 10 mm from the lateral canthi recorded horizontal EOGs. We started recording the EEG data after all the electrode impedances were maintained below 5 kΩ.
Curry 8 (Neurosoft Labs, Inc., Virginia, USA) was also employed in the data analysis stage. We transferred the reference from the left mastoid to the bilateral mastoid. We corrected the EOG artifacts according to the method proposed by Semlitsch et al (1986).32 EEG data were digitally low-pass filtered at 30 Hz (24 dB/octave). Then, the data were segmented from 200 ms before the onset of the product picture to 800 ms after the onset, with the first 200 ms prestimulus used as a baseline. For artifact correction, some trials that contained amplifier clipping, bursts of electromyography activity, or peak-to-peak deflection exceeding ±100 μV were excluded. The EEG epochs were averaged for four conditions (fresh-static, fresh- dynamic, frozen - static, frozen - dynamic) for each participant.
Based on the guidelines proposed by Picton et al33 the mean amplitude and latency of the N2 at the time windows 220–320 ms and 200–400 ms after the onset of the product picture were analyzed. Six electrodes (F1, Fz, F2, FC1, FCz, and FC2) in the frontal area were chose for the N2 analysis. Then, within-subjects repeated-measures ANOVA for the N2 amplitude and latency was performed with 2 product categories (fresh vs frozen) × 2 image dynamism (static vs dynamic) × 6 electrodes (F1, Fz, F2, FC1, FCz, and FC2). Similarly, for the LPP analysis, the mean amplitude and latency in the 520–620 ms and 500–700 ms time windows after product picture onset and six electrodes (CP1, CPz, CP2, P1, Pz, and P2) in the central-parietal area were chosen in the statistical analysis. Repeated-measures ANOVA for LPP amplitude and latency was also performed with 2 product categories (fresh vs frozen) × 2 image dynamism (static vs dynamic) × 6 electrodes (CP1, CPz, CP2, P1, Pz, and P2). We applied the Greenhouse-Geisser correction when the assumption of sphericity was violated.34 A simple effect analysis would be conducted when an interaction effect was significant.
Results
Behavioral Results
A 2 aquatic product categories (fresh vs frozen) × 2 image dynamism (static vs dynamic) repeated-measures ANOVA of purchase intention was conducted, and the results revealed that there were significant main effects for aquatic product categories [F (1, 27) =16.675, p < 0.001,η2=0.382] and that the effect of image dynamism was significant [F (1, 27) = 16.297, p < 0.001,η2=0.3762]. The mean purchase intention for fresh aquatic products (M = 3.158, S.E. = 0.081) was higher than that for frozen aquatic products (M =2.721, S.E. = 0.068), and the mean purchase intention for dynamic image (M = 3.129, S.E. = 0.072) was higher than that for static image (M = 2.750, S.E. = 0.069). The behavioral results are shown in Figure 2.
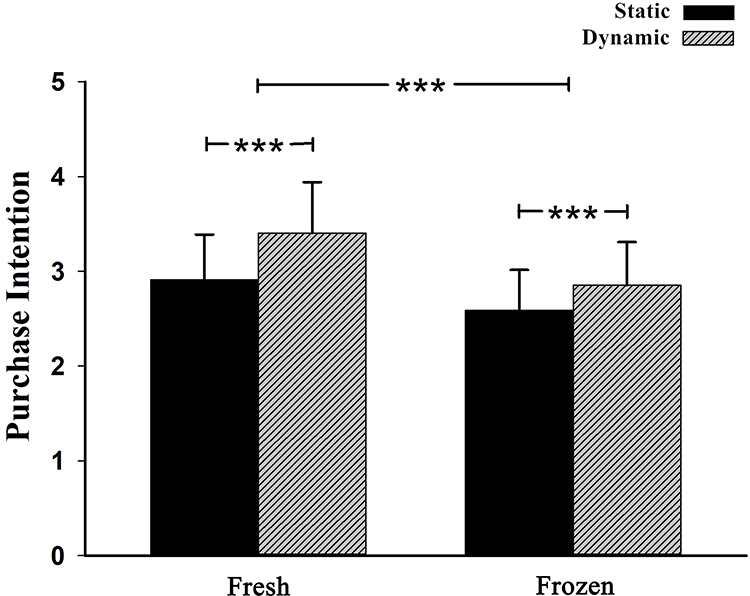 |
Figure 2 Behavioral results. Purchasing intention of four conditions (fresh-static, fresh-dynamic, frozen-static and frozen-dynamic).***p< 0.001. |
The interaction effect between aquatic product categories and image dynamism was also significant [F (1, 27) = 12.622, p = 0.001,η2=0.319]. Hence, we further conducted a simple effects analysis to determine the effects of different types of image dynamism with fixed product categories. In the fresh aquatic product condition, there was a main effect of image dynamism [F (1, 27) = 23.802, p < 0.001,η2=0.469]. The mean purchase intention for the dynamic image (M = 3.405, S.E. = 0.101) was higher than that for the static image (M = 2.911, S.E. = 0.090). In the frozen aquatic product condition, there was also a significant main effect of image dynamism [F (1, 27) = 7.373, p = 0.011,η2=0.215]. The mean purchase intention for the static image (M = 2.589, S.E. = 0.081) was lower than that for the dynamic image (M = 2.854, S.E. = 0.086).
N2 Results
We conducted a three-way 2 aquatic product categories (fresh vs frozen) × 2 image dynamism (static vs dynamic) x 6 (electrodes) repeated-measures ANOVA analysis for the N2 amplitude. Results showed no significant main effect for aquatic product categories [F (1, 27) < 1, p> 0.1,η2< 0.1] and also not an interaction effect between aquatic product categories and image dynamism [F (1, 27) < 1, p> 0.1,η2< 0.1]. However, we observed a significant main effect for image dynamism [F (1, 27) = 45.735, p< 0.001,η2=0.629]. It showed that the static aquatic product (M = −3.044 µV, S.E. = 0.993) induced larger N2 amplitude (negative polarity: a smaller voltage value means a larger amplitude) than the dynamic aquatic product (M = −1.153 µV, S.E. = 1.047), as shown in Figure 3A.
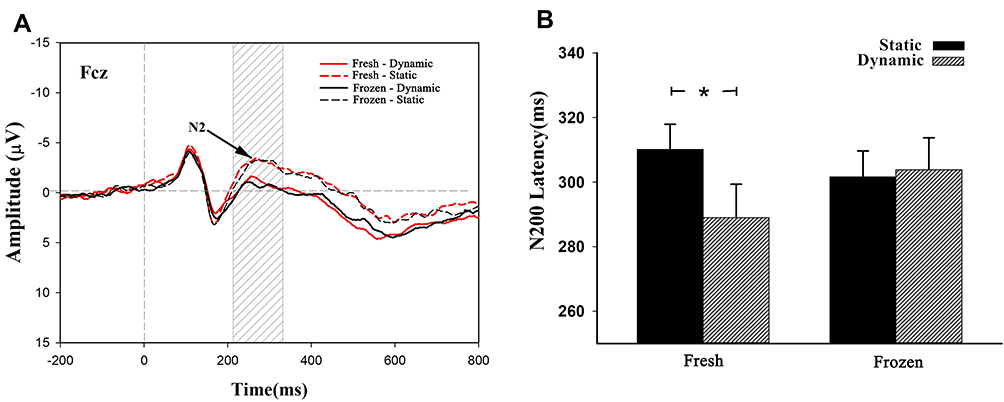 |
Figure 3 N2 results. (A) Grand-averaged ERP waveforms at channel FCz for four conditions (fresh-static, fresh-dynamic, frozen-static and frozen-dynamic). Shaded areas indicate the time window of the N2 (220–320 ms) used for statistical analysis. (B) The N2 latency comparison among four conditions.*p< 0.05. |
Furthermore, the three-way 2 aquatic product categories (fresh vs frozen) × 2 image dynamism (static vs dynamic) x 6 (electrodes) repeated-measures ANOVA for N2 latency was conducted. The main effect for either the aquatic product categories [F (1, 27) < 1, p> 0.1,η2< 0.1] or image dynamism [F (1, 27) = 2.051, p =0.164,η2< 0.1] was no significant. However, we found a significant interaction effect between aquatic product categories and image dynamism [F (1, 27) = 4.774, p = 0.038,η2=0.150]. To examine this interaction, a simple effects analysis was conducted. When the aquatic product category was related to a fresh product, the effect of image dynamism was significant [F (1, 27) = 5.169, p = 0.031,η2=0.161]. The results suggested that static image (M = 310.129 ms, S.E. = 7.776) elicited a longer N2 latency compared to dynamic image (M = 289.024 ms, S.E. = 10.308). However, for the frozen product condition, the difference of N2 latency between static and dynamic image was not found [F (1, 27) <1, p> 0.1,η2<0.1], as shown in Figure 3B.
LPP Results
A three-way 2 aquatic product categories (fresh vs frozen) × 2 image dynamism (static vs dynamic) x 6 (electrodes) repeated-measures ANOVA was conducted for LPP. No significant main effect was identified for either the aquatic product category [F (1, 27) <1, p> 0.1,η2<0.1] or the interaction effect between the aquatic product category and image dynamism [F (1, 27) <1, p> 0.1,η2<0.1]. Moreover, the main effect of image dynamism was significant [F (1, 27) = 5.189, p = 0.031,η2=0.161]. It showed that dynamic image (M = 8.075µV, S.E. = 0.836) elicited a larger LPP amplitude than the static image condition (M = 7.050 µV, S.E. = 0.841), as shown in Figure 4A.
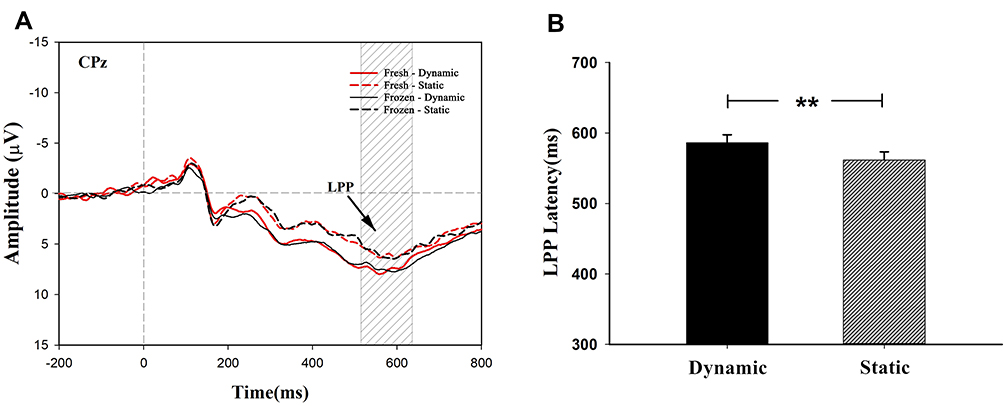 |
Figure 4 LPP results. (A) Grand-averaged ERP waveforms at channel CPz for four conditions (fresh-static, fresh-dynamic, frozen-static and frozen-dynamic). Shaded areas indicate the time window of the LPP (520–620 ms) used for statistical analysis. (B) The LPP latency comparison between static and dynamic product conditions. **p< 0.01. |
A similar three-way 2 aquatic product categories (fresh vs frozen) × 2 image dynamism (static vs dynamic) x 6 (electrodes) repeated-measures ANOVA was conducted for the LPP latency. It showed no significant main effect for the aquatic product category [F (1, 27) = < 1, p> 0.1,η2<0.1] and the interaction effect between the aquatic product category and image dynamism [F (1, 27) = < 1, p> 0.1,η2<0.1]. But found a significant main effect for image dynamism [F (1, 27) = 9.716, p = 0.004,η2=0.265]. It showed that dynamic image (M = 586.256 ms, S.E. = 11.364) had longer LPP latency than static image (M = 561.887 ms, S.E. = 11.490), as shown in Figure 4B. Table 1 summarized the results of behavioral and ERPs.
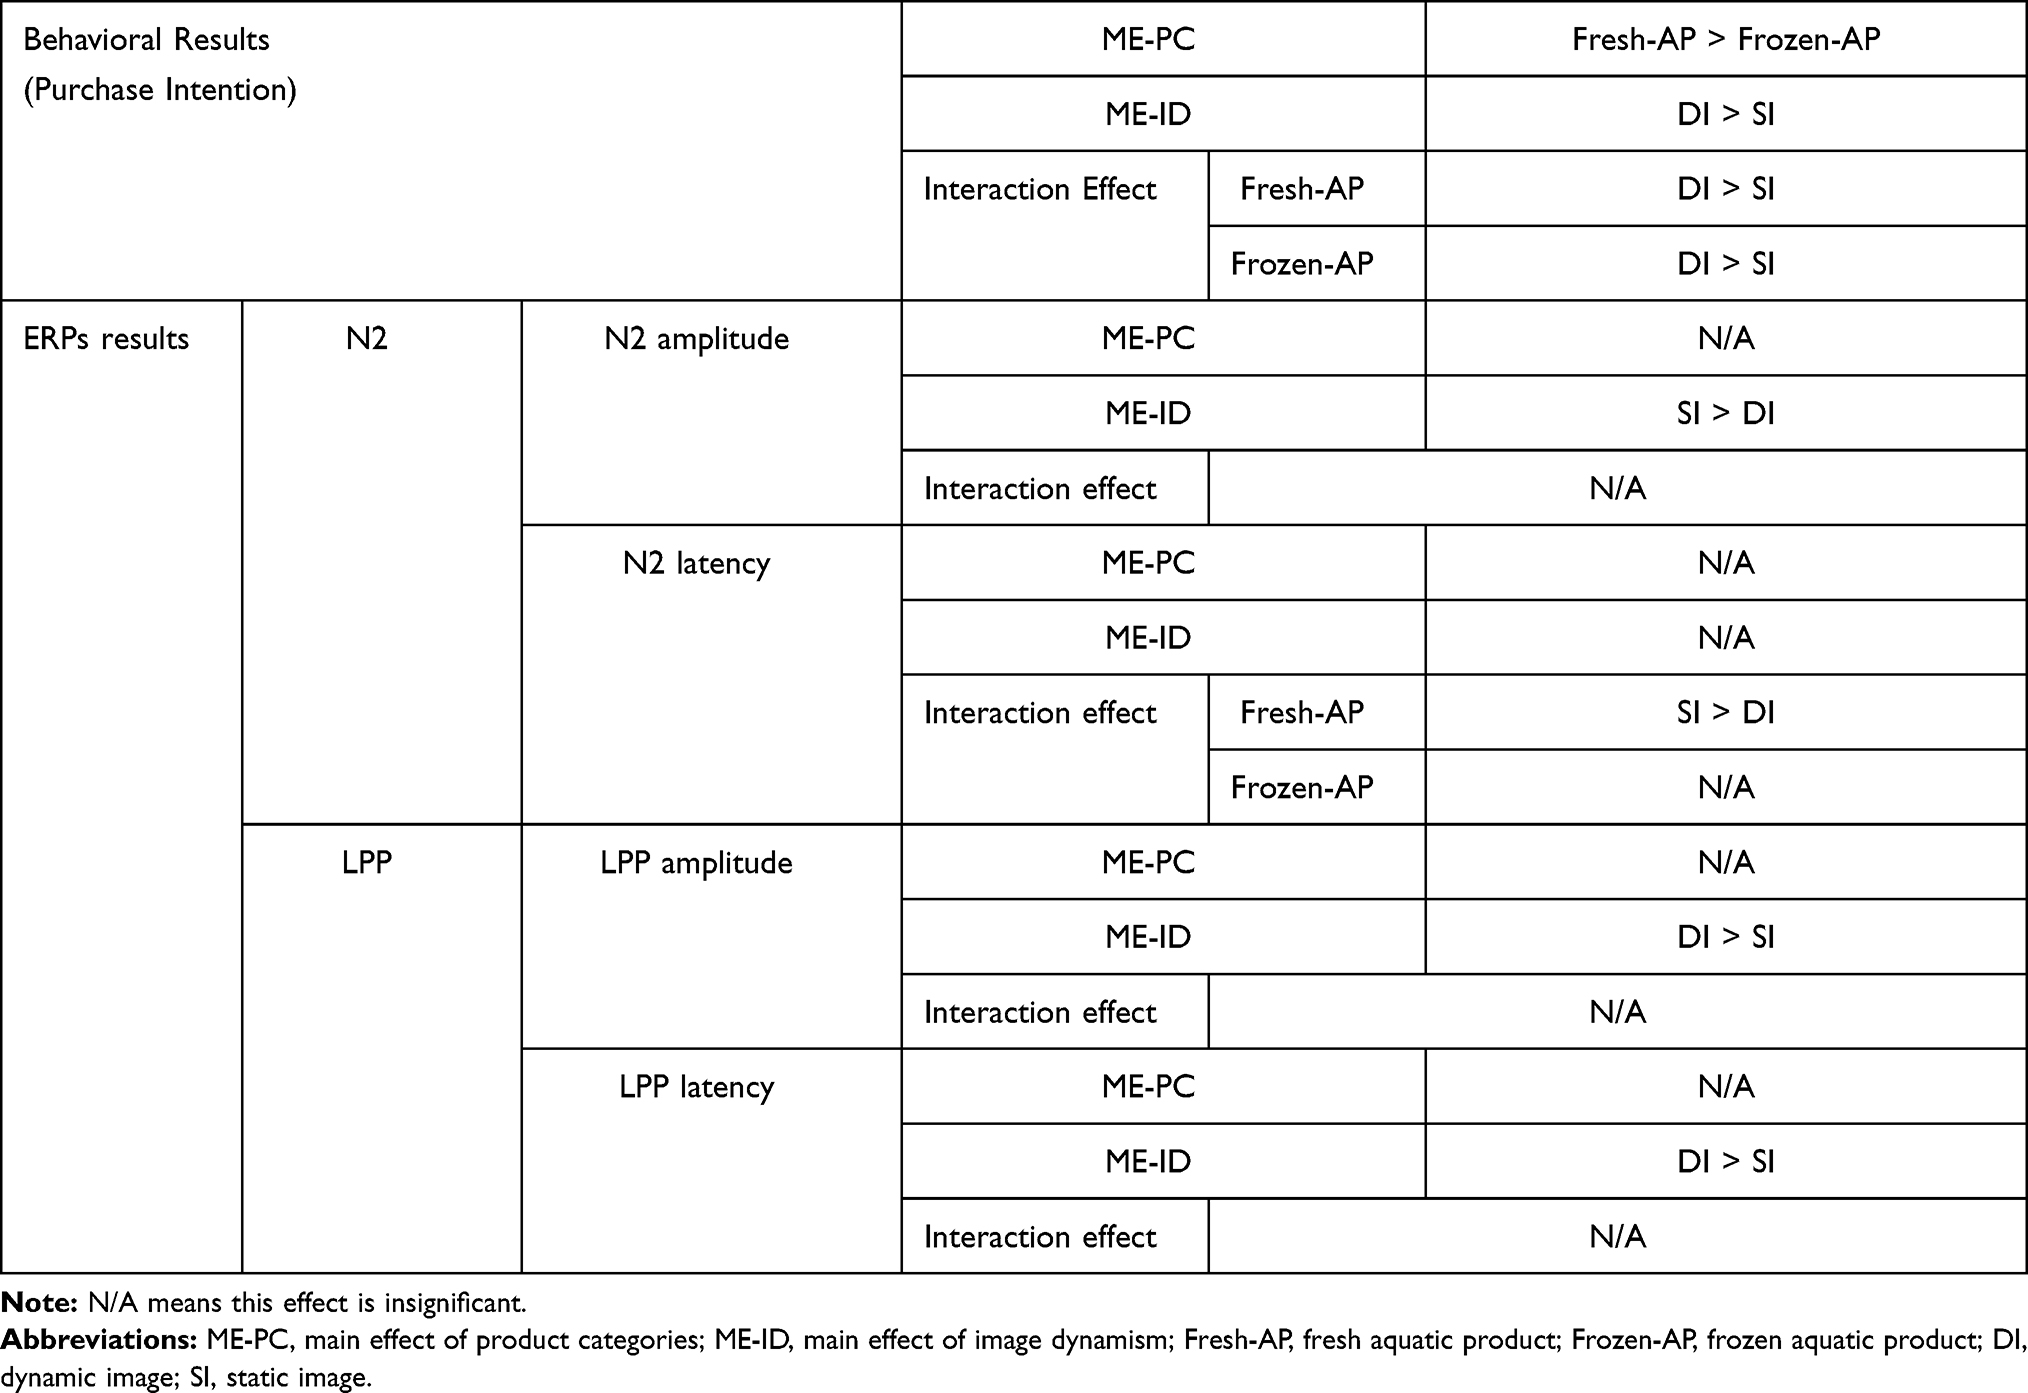 |
Table 1 The Results of Behavioral and ERPs |
Discussion
By employing the ERP method, the present study probed neurocognitive processes associated with consumers’ evaluation and behavior toward fresh and frozen aquatic products with static and dynamic image. Behaviorally, participants’ purchase intention for fresh aquatic products was significantly greater than that for frozen aquatic products, which is in line with previous studies that suggested that participants prefer to buy fresh aquatic food.35,36
More importantly, we found that the mean purchase intention for dynamic image was higher than that for static products, and the preference for picture dynamism was stronger for the fresh aquatic product condition than for the frozen aquatic product condition. At the brain level, we found that the static image elicited a larger N2 than the dynamic image. For the N2 latency, in the fresh product condition, static image elicited a longer N2 latency compared to dynamic image. However, in the frozen product condition, there was no N2 latency difference between static and dynamic image. As we stated in the introduction, a larger N2 amplitude and longer latency indicates more conflict of the stimuli. The current results showed greater conflict for the static image, especially for the fresh aquatic product. This result is consistent with our behavioral results.
Several studies have focused on the effect of dynamic imagery and perceived movement on consumers’ feeling and behavior. It has been reported that picture dynamism can increase participants’ engagement and perceived movement, which can influence consumer evaluations of product.26 Previous studies interpreted this as the continuity of motion that individuals can imagine from a still line drawing.13 This is also confirmed by neuroscientific evidence, with the fact that observing action and imagining motion active the same brain regions.37–40 This result suggested that the brain can perceive movement even when there is no actual movement. Therefore, the effect of perceived movement on behavior may be similar with actual movement. These effects occur because we have perceived the motion of the product in our past experiences, and we can continue this motion from our memory when encounter the dynamic picture.41 In the current study, past experiences in memory showed that fresh aquatic products move much more than frozen aquatic products, which resulted in a stronger effect of dynamic preference for fresh aquatic products.
We also found a larger LPP amplitude for dynamic image is larger than that of the static image condition. As we mentioned in the introduction, LPP amplitude can reflect the degree of emotional arousal for stimuli. The current results showed that the dynamic product image aroused stronger emotions than the static product image. This is consistent with previous studies that suggested that image dynamism can increase consumer engagement42,43 and evoke their positive emotions.44
Conclusion
In summary, by employing ERP technology, the current study provided neurophysiological evidence for consumers’ preference and positive emotions toward dynamic aquatic product pictures. Specifically, we found that the dynamic image produced less cognitive conflict and aroused consumers’ positive feelings, which were reflected in decreased N2 amplitudes and latency as well as increased LPP amplitude. The current findings further suggested that although dynamism only increases perceived movement, it can still induce positive emotions toward the product and lead to a greater purchasing intention. Besides, this study emphasized the value of neuroscientific methods in revealing consumers’ (implicit) cognition and emotions.
Ethics Approval and Informed Consent
The procedures of this study were reviewed and approved by the Internal Review Board of the Academy of Neuroeconomics and Neuromanagement at Ningbo University. Written informed consent was obtained from each participant. All data collected from the subjects were kept anonymous and confidential to protect the privacy of the study subjects.
Acknowledgments
This work was supported by grant 71773057 from the National Natural Science Foundation of China; We thank Hao Ding for data collection.
Disclosure
All the authors declare that there are no conflicts of interest.
References
1. Ert E, Fleischer A, Magen N. Trust and reputation in the sharing economy: the role of personal photos in Airbnb. Tourism Manage. 2016;55:62–73. doi:10.1016/j.tourman.2016.01.013
2. Brom FW. Food, consumer concerns, and trust: food ethics for a globalizing market. J Agri Environ Ethics. 2000;12(2):127–139. doi:10.1023/A:1009586529518
3. Jonge JD, Trijp HV, Goddard E, Frewer L. Consumer confidence in the safety of food in Canada and the Netherlands: the validation of a generic framework. Food Qua Pref. 2008;19(5):439–451.
4. Sapp SG, Arnot C, Fallon J, et al. Consumer trust in the US food system: an examination of the recreancy theorem. Rural Sociol. 2009;74(4):525–545. doi:10.1526/003601109789863973
5. Zhang H, Liu Y, Zhang Q, Cui Y, Xu S. A Bayesian network model for the reliability control of fresh food e-commerce logistics systems. Soft Computing. 2020;1–21.
6. Michaelidou N, Hassan L. The role of health consciousness, food safety concern and ethical identity on attitudes and intentions towards organic food. Int J Consumer Stud. 2010;32:2.
7. Fabinyi M, Liu N, Song Q, Li R. Aquatic product consumption patterns and perceptions among the Chinese middle class. Regional Stud Marine Sci. 2016;7:1–9. doi:10.1016/j.rsma.2016.01.013
8. Hu Y, Yuan C, Yu K, et al. An online survey study of consumer preferences on aquatic products in China: current seafood consumption patterns and trends. Fisheries Aquaculture J. 2014;5(2):1.
9. Zhang Y. Application of improved BP neural network based on e-commerce supply chain network data in the forecast of aquatic product export volume. Cogn Syst Res. 2019;57:228–235. doi:10.1016/j.cogsys.2018.10.025
10. Roggeveen AL, Grewal D, Townsend C, Krishnan R. The impact of dynamic presentation format on consumer preferences for hedonic products and services. J Mark. 2015;79(6):34–49. doi:10.1509/jm.13.0521
11. Thomas N, Mulligan JJ. Dynamic imagery in children’s representations of number. Mathematics Educ Res J. 1995;7(1):5–25.
12. Cian L, Krishna A, Elder RS. This logo moves me: dynamic imagery from static images. J Marketing Res. 2014;51(2):184–197. doi:10.1509/jmr.13.0023
13. Cian L, Krishna A, Elder RS. A sign of things to come: behavioral change through dynamic iconography. J Consumer Res. 2015;41(6):1426–1446. doi:10.1086/680673
14. Algharabat R, Alalwan AA, Rana NP, Dwivedi YK. Three dimensional product presentation quality antecedents and their consequences for online retailers: the moderating role of virtual product experience. J Retailing Consumer Serv. 2017;36:203–217. doi:10.1016/j.jretconser.2017.02.007
15. Boksem MA, Smidts A. Brain responses to movie trailers predict individual preferences for movies and their population-wide commercial success. J Marketing Res. 2015;52(4):482–492. doi:10.1509/jmr.13.0572
16. Wuke Z, Jin J, Wang A, Ma Q, Yu H. Consumers’ implicit motivation of purchasing luxury brands: an EEG study. Psychol Res Behav Manag. 2019;12:913–929. doi:10.2147/PRBM.S215751
17. Jin J, Dou X, Meng L, Yu H. Environmental-friendly eco-labeling matters: evidences from an ERPs Study. Front Hum Neurosci. 2018;12.
18. Pozharliev R, Verbeke W, Van Strien J, Bagozzi R. Merely being with you increases my attention to luxury products: using EEG to understand consumers’ emotional experience of luxury branded products. J Marketing Res. 2015;52:150409072827005. doi:10.1509/jmr.13.0560
19. Folstein JR, Petten CV. Influence of cognitive control and mismatch on the N2 component of the ERP: a review. 2008;45(1):2147483640–2147483647.
20. Eimer M. Effects of attention and stimulus probability on ERPs in a Go/NoGo task. Biol Psychol. 1993;35:123–138. doi:10.1016/0301-0511(93)90009-W
21. Jin J, Wuke Z, Chen M. How consumers are affected by product descriptions in online shopping: event-related potentials evidence of the attribute framing effect. Neurosci Res. 2017;125:125. doi:10.1016/j.neures.2017.07.006
22. Ma Q, Wang K, Wang X, Wang C, Wang L. The influence of negative emotion on brand extension as reflected by the change of N2: a preliminary study. Neurosci Lett. 2010;485:237–240. doi:10.1016/j.neulet.2010.09.020
23. Shang Q, Pei G, Jin J. My friends have a word for it: event-related potentials evidence of how social risk inhibits purchase intention. Neurosci Lett. 2017;643:643. doi:10.1016/j.neulet.2017.02.023
24. Schmitt BM, Schiltz K, Zaake W, Kutas M, Münte T. An electrophysiological analysis of the time course of conceptual and syntactic encoding during tacit picture naming. J Cogn Neurosci. 2001;13(4):510–522. doi:10.1162/08989290152001925
25. Schmitt BM, Rodriguez-Fornells A, Kutas M, Münte TF. Electrophysiological estimates of semantic and syntactic information access during tacit picture naming and listening to words. Neurosci Res. 2001;41(3):293–298. doi:10.1016/S0168-0102(01)00286-3
26. Krishna A, Cian L, Sokolova T. The power of sensory marketing in advertising. Current Opinion Psychol. 2016;10:142–147.
27. Thiruchselvam R, Blechert J, Sheppes G, Rydstrom A, Gross JJ. The temporal dynamics of emotion regulation: an EEG study of distraction and reappraisal. Biol Psychol. 2011;87(1):84–92. doi:10.1016/j.biopsycho.2011.02.009
28. Yongbin M, Jin J, Yu W, et al. How is the neural response to the design of experience goods related to personalized preference? An implicit view. Front Neurosci. 2018;12:760. doi:10.3389/fnins.2018.00760
29. Yu H, Dan M, Ma Q, Jin J. They all do it, will you? Event-related potential evidence of herding behavior in online peer-to-peer lending. Neurosci Lett. 2018;681.
30. Ma Q, Hu Y, Pei G, Xiang T. Buffering effect of money priming on negative emotions—An ERP study. Neurosci Lett. 2015;606:77–81. doi:10.1016/j.neulet.2015.08.048
31. Association GAotWM. World Medical Association Declaration of Helsinki: ethical principles for medical research involving human subjects. J Am Coll Dent. 2014;81(3):14.
32. Semlitsch HV, Anderer P, Schuster P, Presslich O. A solution for reliable and valid reduction of ocular artifacts, applied to the P300 ERP. Psychophysiology. 1986;23(6):695–703. doi:10.1111/j.1469-8986.1986.tb00696.x
33. Picton T, Bentin S, Berg P, et al. Guidelines for using human event-related potentials to study cognition: recording standards and publication criteria. Psychophysiology. 2000;37(2):127–152. doi:10.1111/1469-8986.3720127
34. Greenhouse S, Geisser S. On methods in the analysis of profile data. Psychometrika. 1959;24:95–112. doi:10.1007/BF02289823
35. McCubbin S, Pearce T, Ford J, Smit B. Social–ecological change and implications for food security in Funafuti, Tuvalu. Ecol Soc. 2017;22.
36. Pulcini D, Franceschini S, Buttazzoni L, Giannetti C, Capoccioni F. Consumer preferences for farmed seafood: an Italian case study. J Aquatic Food Prod Technol. 2020;29(5):445–460. doi:10.1080/10498850.2020.1749201
37. Amit E, Hoeflin C, Hamzah N, Fedorenko E. An asymmetrical relationship between verbal and visual thinking: converging evidence from behavior and fMRI. NeuroImage. 2017;152:619–627. doi:10.1016/j.neuroimage.2017.03.029
38. Adaval R, Saluja G, Jiang Y. Seeing and thinking in pictures: a review of visual information processing. Consumer Psychol Rev. 2019;2(1):50–69.
39. O’Craven KM, Kanwisher N. Visual Imagery of Moving Stimuli Activates Area MT/MST. New Orleans; 1997.
40. Philip H, Goebel B, Pace N. Impact of culture-independent studies on the emerging phylogenetic view of bacterial bio-diversity. J Bacteriol. 1998;180:4765–4774. doi:10.1128/JB.180.18.4765-4774.1998
41. Neupärtl N, Tatai F, Rothkopf CA. Intuitive physical reasoning about objects’ masses transfers to a visuomotor decision task consistent with Newtonian physics. PLoS Comput Biol. 2020;16(10):e1007730. doi:10.1371/journal.pcbi.1007730
42. Pieters R, Wedel M, Batra R. The stopping power of advertising: measures and effects of visual complexity. J Mark. 2010;74(5):48–60. doi:10.1509/jmkg.74.5.048
43. Pieters R, Wedel M. Attention capture and transfer in advertising: brand, pictorial, and text-size effects. J Mark. 2004;68(2):36–50. doi:10.1509/jmkg.68.2.36.27794
44. Rietveld R, van Dolen W, Mazloom M, Worring M. What you feel, is what you like influence of message appeals on customer engagement on Instagram. J Interactive Marketing. 2020;49:20–53. doi:10.1016/j.intmar.2019.06.003
 © 2021 The Author(s). This work is published and licensed by Dove Medical Press Limited. The
full terms of this license are available at https://www.dovepress.com/terms
and incorporate the Creative Commons Attribution
- Non Commercial (unported, 3.0) License.
By accessing the work you hereby accept the Terms. Non-commercial uses of the work are permitted
without any further permission from Dove Medical Press Limited, provided the work is properly
attributed. For permission for commercial use of this work, please see paragraphs 4.2 and 5 of our Terms.
© 2021 The Author(s). This work is published and licensed by Dove Medical Press Limited. The
full terms of this license are available at https://www.dovepress.com/terms
and incorporate the Creative Commons Attribution
- Non Commercial (unported, 3.0) License.
By accessing the work you hereby accept the Terms. Non-commercial uses of the work are permitted
without any further permission from Dove Medical Press Limited, provided the work is properly
attributed. For permission for commercial use of this work, please see paragraphs 4.2 and 5 of our Terms.