Back to Journals » International Journal of Nanomedicine » Volume 11
The effect of neutral-surface iron oxide nanoparticles on cellular uptake and signaling pathways
Authors Kim E ![]() , Kim JM, Kim L, Choi SJ, Park IS, Han JY, Chu YC, Choi ES, Na K, Hong S
, Kim JM, Kim L, Choi SJ, Park IS, Han JY, Chu YC, Choi ES, Na K, Hong S
Received 11 April 2016
Accepted for publication 16 June 2016
Published 13 September 2016 Volume 2016:11 Pages 4595—4607
DOI https://doi.org/10.2147/IJN.S110332
Checked for plagiarism Yes
Review by Single anonymous peer review
Peer reviewer comments 2
Editor who approved publication: Dr Thomas Webster
Eunjoo Kim,1 Joon Mee Kim,2 Lucia Kim,2 Suk Jin Choi,2 In Suh Park,2 Jee Young Han,2 Young Chae Chu,2 Eun Sook Choi,1 Kun Na,3 Soon-Sun Hong4
1Division of Nano and Energy Convergence Research, Daegu Gyeongbuk Institute of Science and Technology (DGIST), Daegu, 2Department of Pathology, Inha University College of Medicine, Incheon, 3Department of Biotechnology, Catholic University of Korea, Bucheon, 4Department of Biomedical Sciences, Inha University College of Medicine, Incheon, South Korea
Abstract: In recent years, iron oxide nanoparticles (IONPs) have been applied widely to biomedical fields. However, the relationship between the physicochemical properties of IONPs and their biological behavior is not fully understood yet. We prepared 3-methacryloxypropyltrimethoxysilane (MPS)-coated IONPs, which have a neutral hydrophobic surface, and compared their biological behavior to that of Resovist (ferucarbotran), a commercialized IONP formulation modified with carboxymethyl dextran. The rate of MPS-IONP uptake by human aortic endothelial cells (HAoECs) was higher than ferucarbotran uptake, indicating that the neutral hydrophobic nature of MPS-IONPs allowed them to be absorbed more readily through the plasma membrane. However, the signaling pathways activated by MPS-IONPs and ferucarbotran were comparable, suggesting that surface charge is not a key factor for inducing changes in HAoECs. In vivo fate analysis showed that MPS-IONPs accumulated for longer periods in tissues than hydrophilic ferucarbotran. These findings could enlarge our understanding of NP behavior for advanced applications in the biomedical field.
Keywords: iron oxide nanoparticles, neutral hydrophobic surface, signaling pathway, uptake, accumulation, reactive oxygen species (ROS)
Introduction
Iron oxide nanoparticles (IONPs) have been used in the biomedical field, especially as contrast agents for magnetic resonance imaging (MRI), as colloidal mediators for induced hyperthermia and for targeted delivery of drugs or genes. These IONPs have been synthesized in various types and structures to fit the purpose of their usage. However, the relationship between the physicochemical properties of IONPs and their biological behaviors/effects remains to be elucidated.
The physicochemical properties of NPs depend on the nature of the surface-coating materials,1 as well as such properties as size, composition, and shape. The correlation of surface charge and cellular uptake,2,3 the induction of cell death,4 and in vivo behaviors, such as half-life in the circulation system,5 have been elucidated using NPs modified with various ligands. For modification of NPs, positively or negatively charged ligands have been used to prevent their aggregation in biological systems. It has also been reported that neutral particles have the longest half-life in the blood,6 but most studies on neutral particles have been performed using hydrophilic polyethylene glycol (PEG)-coated NPs (ζ-potential <0).7 It is assumed that neutral hydrophobic NPs, which have a ζ-potential near 0, have higher affinity for the cell membrane than hydrophilic ones,8 but their cellular effects and in vivo behaviors are not fully understood. Therefore, to expand the understanding of the structure-related functionality of IONPs, the effect of surface modification by neutral hydrophobic surfaces needs to be examined further.
In this study, we synthesized 3-methacryloxypropyltrimethoxysilane (MPS)-coated IONPs (MPS-IONPs) based on previous studies.9,10 MPS is a widely used coupling agent available for the adhesion of organic materials to metallic surfaces,11 and allows easy cross-linking of the methacrylate terminal to thiolic compounds triggered by ultraviolet light under ambient conditions.12 MPS-IONPs can have a neutral hydrophobic surface and be dispersible in an aqueous environment.13
The structure of synthesized MPS-IONPs was examined by X-ray diffraction in our previous study.10 The IONPs synthesized by this method consisted of a mixture of Fe3O4 and γ-Fe2O3. In IONP synthesis, the existence of γ-Fe2O3 is usually observed and can be attributed to the oxidation of Fe3O4 during synthesis.14 To identify the unique characteristics of MPS-IONPs, they were compared with those of a well-known negatively charged contrasting agent, Resovist (ferucarbotran), which was coated with carboxymethyl dextran. Though ferucarbotran has been used clinically, it has not been available commercially since 2009.15 Ferucarbotran is also comprised of Fe3O4/γ-Fe2O3.16 Therefore, the composition of MPS-IONPs and ferucarbotran are quite similar.
We analyzed the effects of MPS-IONPs and ferucarbotran on the uptake and signaling pathways in human aortic endothelial cells (HAoECs). We chose HAoECs for the in vitro study because therapeutic IONPs can potentially be administered to humans via blood vessels and distributed to the organs through the ECs of the vessels. Additionally, we investigated the behaviors of neutrally modified IONPs in vivo.
Materials and methods
Preparation of IONPs
MPS-IONPs were manufactured according to previous studies.9,10 Briefly, ferrous sulfate heptahydrate (2.4 g) and ferric chloride hexahydrate (4.1 g) were dissolved in deionized water (100 mL) in a flask. Next, 25 wt% NH3 (25 mL) was added to the solution with vigorous stirring at room temperature under a nitrogen atmosphere. Oleic acid (1 mL) was dropped into the dispersion slowly at 80°C for 1 hour. The IONPs were extracted in toluene by adding NaCl. MPS (1.22 mL), triethylamine (1.22 mL), and oleic acid-coated IONPs in toluene were mixed and stirred for 8 hours at room temperature under a nitrogen atmosphere. When the reaction was complete, petroleum ether was added to the mixture to precipitate the MPS-IONPs, followed by magnetic separation and drying in vacuo. The MPS-IONPs were resuspended in acetone and precipitated by petroleum ether. This procedure was repeated five times to remove residual MPS and oleic acid from the IONPs. MPS-IONPs were finally resuspended in deionized water and used as neutral IONPs. Ferucarbotran, clinically used carboxymethyl dextran-based IONPs, was purchased from Bayer AG (Leverkusen, Germany). Iron content was determined by inductively coupled plasma atomic emission spectroscopy (iCAP Q; Thermo Fisher Scientific, Waltham, MA, USA).
Characterization of IONPs
The morphology and particle size of the IONPs were analyzed using transmission electron microscopy (TEM; HD-2300; Hitachi, Tokyo, Japan). The particle-size distribution and ζ-potential of the IONPs were analyzed using a dynamic light-scattering (DLS) particle-size analyzer (Zetasizer Nano ZS; Malvern Instruments, Malvern, UK). The structure of MPS-IONPs was analyzed by Fourier-transform infrared (FT-IR) using a Nicolet iS10 FT-IR spectrometer equipped with a nitrogen-purged chamber (Thermo Fisher Scientific).
Cell culture
HAoECs were purchased from PromoCell (C-12271; Heidelberg, Germany). Cells were cultured in MV2 medium (C-22022; PromoCell), and supplemented with 100 units/mL penicillin, 100 μg/mL streptomycin (15070063; Thermo Fisher Scientific) in a 2% gelatin-coated culture flask at 37°C under a humidified atmosphere composed of 95% air and 5% CO2.
Cytotoxicity tests
Cells (5×10³ cells/100 μL) were plated on gelatin-coated 96-well plates and incubated overnight at 37°C under a 5% CO2 atmosphere. The medium was replaced with fresh medium containing MPS-IONPs or ferucarbotran (final concentration 0–50 μg Fe/mL), and then incubation was continued for 24, 48, and 72 hours. The effects of IONPs on cell proliferation were determined using the EZ-Cytox cell-viability assay kit (EZ1000; Daeil Lab Service, Seoul, South Korea) and the WST-1 reagent. Briefly, after various concentrations of IONP-treated cells were incubated for 24, 48, and 72 hours, 10 μL of WST-1 solution was added to each well and the plates incubated for 1 hour. Subsequently, the supernatants were transferred to new plates and the absorbance read on a microplate reader at 450 nm. Cells incubated without IONPs were used as a control. Each analysis was performed in three replicate wells. The 50% inhibitory concentration (IC50) of MPS-IONPs for cell proliferation was calculated by SigmaPlot version 12.3 (Systat Software Inc, San Jose, CA, USA).
Staining of intracellular iron using Perl’s Prussian blue staining
For semiquantitative analysis of the existence of IONPs inside the cells, Perl’s Prussian blue staining was performed. Cells (2×10⁴ cells/mL) were plated on gelatin-coated 18 mm cover glasses in 24-well plates and incubated until ~70% confluence. The medium was replaced with fresh medium containing MPS-IONPs or ferucarbotran (final concentration 0–50 μg Fe/mL), and incubation was continued for 24 hours. Subsequently, cells were washed with phosphate-buffered saline (PBS; Thermo Fisher Scientific) three times, stained with Perl’s solution (2% HCl, 2% potassium ferrocyanide, 1:1) for 30 minutes, and washed three times with PBS. Cells were counterstained with neutral red for 30 seconds, washed again, and mounted.
Electron microscopy
To observe the distribution of MPS-IONPs in the cells, TEM analysis was performed. HAoECs were plated onto a gelatin-coated 100 cm2 culture dish and incubated until ~70% confluence. The medium was replaced with fresh medium containing 1 μg Fe/mL MPS-IONPs and incubation continued for 24 hours. Cells were collected by scraping, washed with PBS three times, and resuspended in TEM fixation solution (2.5% glutaraldehyde) overnight. Cells were embedded in Epon, cut into 60–70 nm ultrathin sections, stained with uranyl acetate/lead citrate, and the features were observed under an electron microscope (H7100; Hitachi).
Measurement of iron concentration in cells
To examine the release of ferrous or ferric iron from IONPs, we checked the intracellular iron concentration using a Spectroquant reagent (code 1.1476, 1.0001; EMD Millipore, Billerica, MA, USA). Cells (2×10⁴ cells/mL) were plated on a gelatin-coated 100 cm2 culture dish and incubated until ~70% confluence. The medium was replaced with fresh medium containing 0–50 μg Fe/mL MPS-IONPs or ferucarbotran, and incubation was continued for 24, 48, and 72 hours. Subsequently, 106 cells from each sample were collected by scraping, washed three times with PBS, and intracellular iron concentration was measured according to the manufacturer’s protocol. Briefly, cells were lysed in 100 μL of iron assay buffer and centrifuged at 16,000 g for 10 minutes to remove insoluble materials. Then, 5 μL iron reducer was added to each sample to reduce iron (III) to iron (II) in a 96-well plate. The sample mixture was incubated at 25°C for 30 minutes, and 100 μL iron probe was added to each well. The plate was incubated in the dark at 25°C for 60 minutes. Colorimetric changes were measured by a Multiskan microplate reader (Thermo Fisher Scientific) at 593 nm. To determine iron concentration, the iron standard provided by the manufacturer was used to prepare a standard curve.
Measurement of ROS generation
Intracellular ROS generation in live cells was detected by the Image-iT live green ROS-detection kit (I36007; Thermo Fisher Scientific), which uses the peroxide-sensitive fluorescent probe carboxy-2′,7′-dichlorofluorescein diacetate (H2-DCFDA). Briefly, cells (2×10⁴ cells/mL) were plated on gelatin-coated 18 mm cover glasses in 24-well plates and incubated until ~70% confluence. The medium was replaced with fresh medium containing MPS-IONPs or ferucarbotran (final concentration 0–50 μg Fe/mL), and incubation was continued for 24 hours. The cells were labeled with H2-DCFDA at 37°C for 30 minutes, counterstained with Hoechst 33342 for 5 minutes, washed three times with the culture medium, and mounted immediately. The stained cells were examined under fluorescence microscopy (BX50; Olympus, Tokyo, Japan).
DNA-microarray analysis
Cells (2×10⁴ cells/mL) were plated on a gelatin-coated 100 cm2 culture dish and incubated until ~70% confluence. The medium was replaced with fresh medium containing 50 μg Fe/mL of MPS-IONPs or ferucarbotran, and incubation was continued for 48 hours. Subsequently, 106 cells from duplicate samples were collected by scraping, washed twice with PBS, and 1 mL Trizol solution was added (Thermo Fisher Scientific). A control sample without treatment with IONPs was also prepared.
Total RNA was isolated using the Trizol Plus RNA-purification kit (Thermo Fisher Scientific) according to the manufacturer’s instruction, and was stored at −80°C. The amplification of target complementary RNA (cRNA) and hybridization were performed using the low-RNA-input linear amplification kit (Agilent Technologies, Santa Clara, CA, USA) according to the manufacturer’s instructions. Briefly, 1 μg of total RNA and T7 promoter primer were mixed and incubated at 65°C for 10 minutes. The complementary DNA master mix (first-strand buffer 0.1 M dithiothreitol, 10 mM deoxyribose nucleoside triphosphate mix, RNaseOut, and M-MLV reverse transcriptase) was prepared and added to the reaction mixture. The samples were incubated at 40°C for 2 hours for reverse transcription and double-stranded DNA synthesis, and the reaction was terminated by incubating at 65°C for 15 minutes. The transcription master mix (transcription buffer 0.1 M dithiothreitol, nucleoside triphosphate mix, 50% PEG, RNaseOut, inorganic pyrophosphatase, T7 RNA polymerase, and cyanine 3/5-CTP) was prepared and added to the reaction mixture. The samples were incubated at 40°C for 2 hours, and the resulting cRNA was purified on the cRNA Cleanup Module according to the manufacturer’s instructions. The cRNA was quantified using an ND-1000 spectrophotometer (NanoDrop Technologies Inc, Wilmington, DE, USA), fragmented, resuspended in the hybridization buffer, and directly pipetted on the assembled Whole Human Genome Microarray kit (4×44 K; Agilent Technologies). The arrays were hybridized at 65°C for 17 hours in a hybridization oven.
The hybridized images were scanned using a DNA microarray scanner (Agilent Technologies) and quantified using the Feature Extraction software (Agilent Technologies). Data normalization, selection of differentially expressed genes (DEGs), and functional annotation were performed using GeneSpring GX 7.3 (Agilent Technologies). Averages of normalized ratios were calculated by dividing the average of normalized signal-channel intensity by the average of normalized control-channel intensity. Genes with greater than twofold and less than 0.5-fold change in expression level were selected as up- or downregulated genes, respectively. Gene-ontology information on each DEG was obtained from GenMAPP,17 DAVID,18,19 and Medline20 databases.
Pathway analysis
Functional analysis of DEGs in the context of the molecular networks and biological pathways was conducted using the Ingenuity Pathways Analysis (IPA; Qiagen, Redwood City, CA, USA). The heat maps for DEGs and signaling pathways were constructed using Cluster 3.0.
In vivo distribution and excretion analysis
Animals were purchased from Orient Bio Inc (Gapyeong, South Korea). Animal care was conducted in accordance with the Laboratory Animal Act of Korea and the established institutional guidelines by the Animal Care and Use Committee of Inha University Hospital (Incheon, South Korea). The committee approved all animal protocols. Sprague Dawley rats were randomly assigned to seven groups with five rats per group. Three groups of rats were injected intravenously with MPS-IONPs at a dose of 20 mg Fe/kg, and the other three groups were injected with ferucarbotran at the same dose. One group without IONP injection was used as a control. The rats were anesthetized with Zoletil and Rompun solution (6:4) before IONP administration. The control group was sacrificed after injection with PBS, which was the buffer for IONPs. At 1, 7, and 30 days postinjection of MPS-IONPs and ferucarbotran, rats from each group were sacrificed, and the lungs, kidneys, livers, and blood were collected to determine the iron concentration. The urine and stool samples were also collected from each dead animal. The iron concentration in each tissue was measured using an iron colorimetric assay kit (K390-100; BioVision, Milpitas, CA, USA). To prepare tissue lysate, 1 mL iron assay buffer was added to 1 g tissue sample. Urine and blood were used directly to measure the concentration. To measure the iron concentration in tissues, a volume of 60% nitric acid was added to each sample and tissues incubated for 2 days at 60°C, after which the solutions were centrifuged at 13,000 rpm for 30 minutes and the supernatant diluted with 3% ultrapure nitric acid and subjected to inductively coupled plasma optical emission spectrometry (Technopark, Incheon, South Korea).
Statistical analysis
For all experiments, data from three independent experiments were analyzed using Student’s t-test and are reported as mean ± standard deviation. SigmaPlot version 12.3 was used (Systat Software) to determine the P-values. P-values <0.05 were considered statistically significant.
Results
Preparation of MPS-IONPs
The schematic diagram of MPS-IONP synthesis is shown in Figure 1. The oleic acid-capped IONPs were synthesized, and the ligand exchanged with MPS. Surface coating of the final product by MPS was confirmed by FT-IR analysis (Figure 2). MPS was identified on the IONPs based on the main peak of silica (~1,160 cm−1). This peak was assigned to the Si–O–Si bonds that are present in MPS-IONP conjugates, but not in oleic acid IONPs.21 In addition, carbon in the acrylate group (=CH2) was also observed in the spectra of MPS-IONPs at 1,280 and 1,300 cm−1. The carbonyl peak in oleic acid (C=O) decreased dramatically following exchange to MPS.22
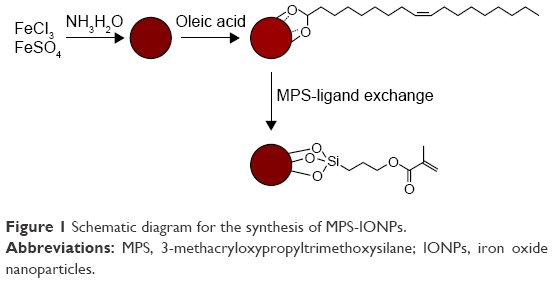 | Figure 1 Schematic diagram for the synthesis of MPS-IONPs. |
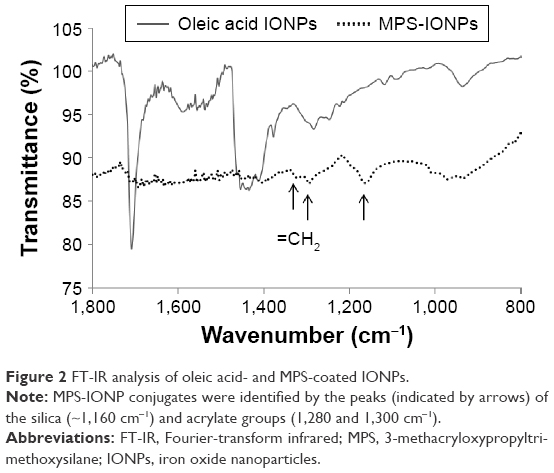 | Figure 2 FT-IR analysis of oleic acid- and MPS-coated IONPs. |
Physical characterization of MPS-IONPs and ferucarbotran
TEM analysis (Figure 3) indicated that both MPS-IONPs and ferucarbotran were spherical and nearly monodispersed. The diameter of a single particle was calculated manually from the TEM images, and was determined to be 11.5±1.3 nm and 5.7±1.2 nm (n=30) for MPS-IONPs and ferucarbotran, respectively. DLS measurement showed that the average diameters of MPS-IONPs and ferucarbotran were 145±62 nm and 16±4 nm, respectively (Figure 4A). Particle size measured by DLS was larger than that by TEM. This difference could have been a result of aggregation of individual IONPs, which may have been induced during suspension in PBS, as reported in previous studies.11,23 Therefore, the individual particles of MPS-IONPs and ferucarbotran were in a similar range of size, but the hydrodynamic size was increased more for MPS-IONPs because of their neutral hydrophobic nature.
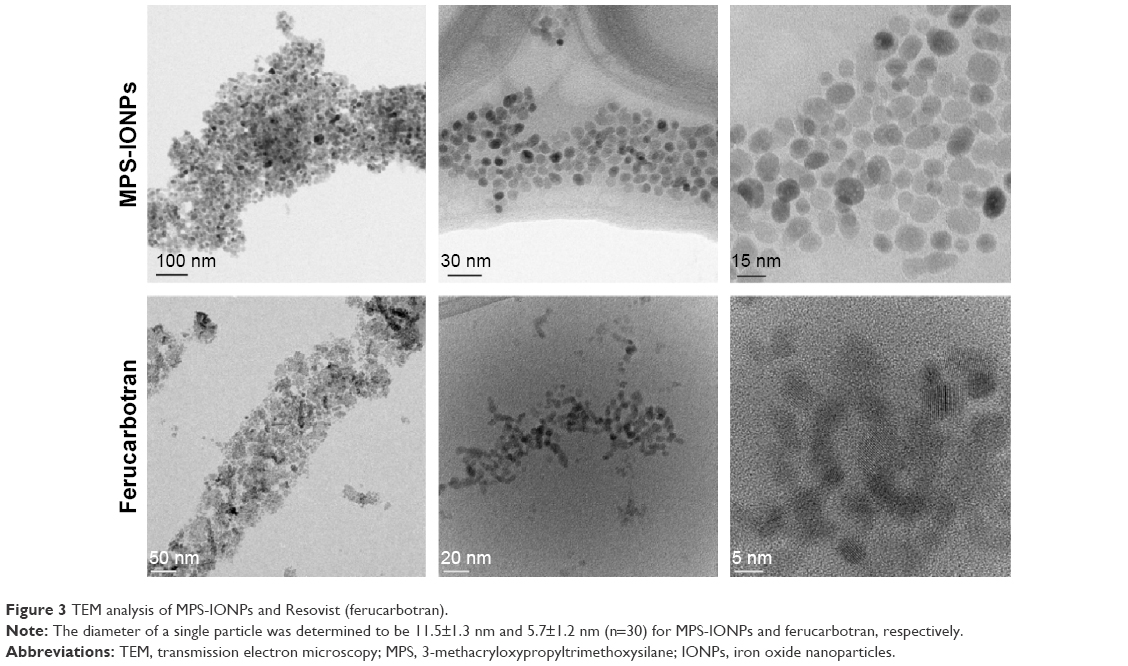 | Figure 3 TEM analysis of MPS-IONPs and Resovist (ferucarbotran). |
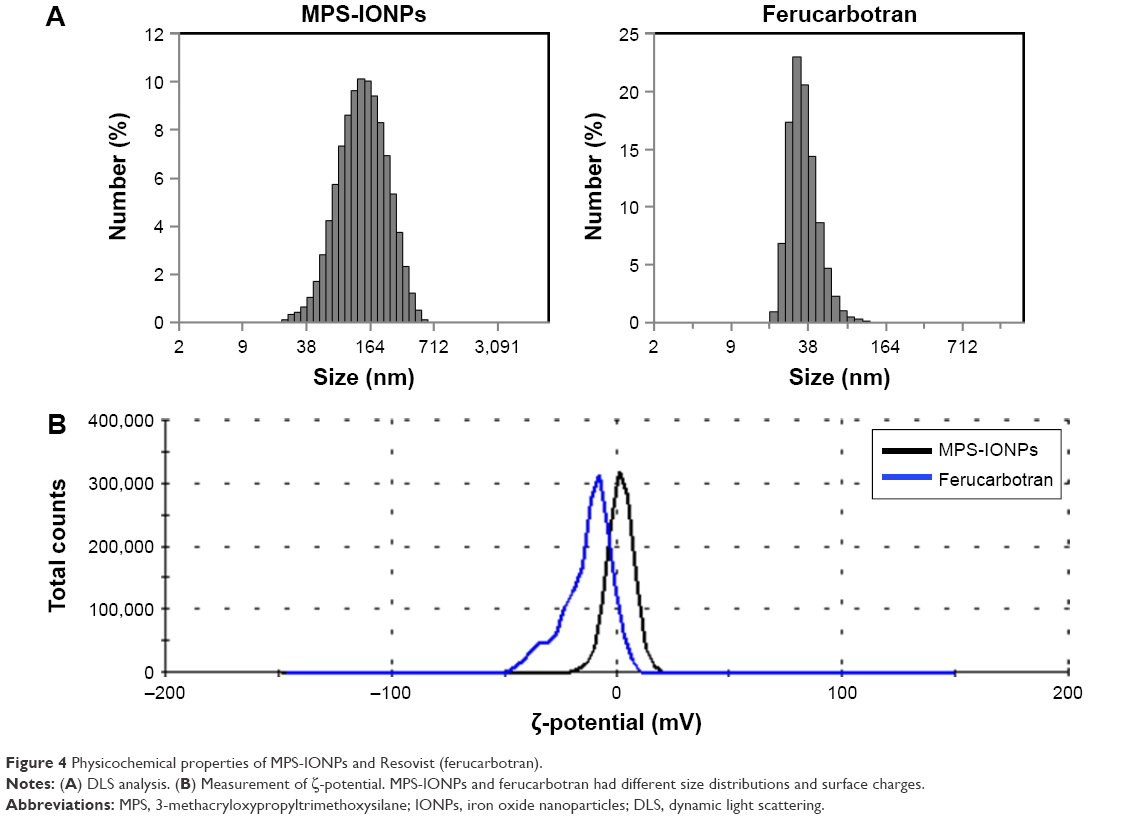 | Figure 4 Physicochemical properties of MPS-IONPs and Resovist (ferucarbotran). |
Figure 4B shows that the ζ-potentials of MPS-IONPs and ferucarbotran were 1.6±5.6 mV and −12.7±10.4 mV, respectively. The difference in the ζ-potentials of MPS-IONPs and ferucarbotran was attributed to the difference in the electrostatic properties of their surface molecules: neutral MPS and negatively charged carboxymethyl dextran resulted in neutral and negative ζ-potentials of MPS-IONPs and ferucarbotran, respectively.
Cytotoxicity of MPS-IONPs
We performed a cell-proliferation assay to determine the cytotoxicity of MPS-IONPs and ferucarbotran (Figure 5). Cytotoxicity to HAoECs was measured at 24, 48, and 72 hours of exposure at different concentrations (1, 5, and 50 μg Fe/mL) of the particles. When exposed to 50 μg Fe/mL MPS-IONPs for 24, 48, and 72 hours, cell viability was significantly decreased to 59%, 47%, and 43% of control cells, respectively (P<0.001). Exposure to 50 μg Fe/mL ferucarbotran for 24, 48, and 72 hours significantly reduced cell viability to 80%, 63%, and 65% that of control cells, respectively (P<0.001). These results indicated that MPS-IONPs were more cytotoxic than ferucarbotran at 50 μg Fe/mL concentration. At a lower dose (1 and 5 μg Fe/mL) of both MPS-IONPs and ferucarbotran, the cells maintained viability at more than 94% that of control cells for up to 72 hours. The IC50 value of MPS-IONPs was determined to be 47 μg Fe/mL.
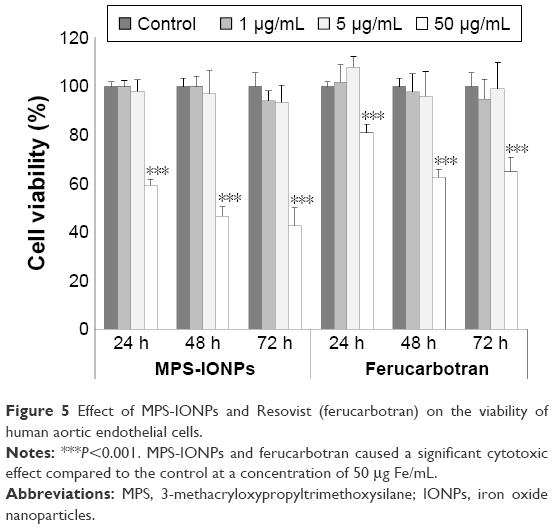 | Figure 5 Effect of MPS-IONPs and Resovist (ferucarbotran) on the viability of human aortic endothelial cells. |
Uptake of IONPs in cells
Prussian blue staining is performed for iron-specific staining in histological analyses, based on the principle that ionic iron reacts with acid ferrocyanide, producing a blue color. This assay is a general method to measure iron in ionic and NP states.8 Prussian blue staining of MPS-IONPs in cells revealed that the intracellular MPS-IONP concentration was higher than that of ferucarbotran (Figure 6A), at 24 hours postinjection. This result indicated that MPS-IONPs were internalized more readily by cells than ferucarbotran.
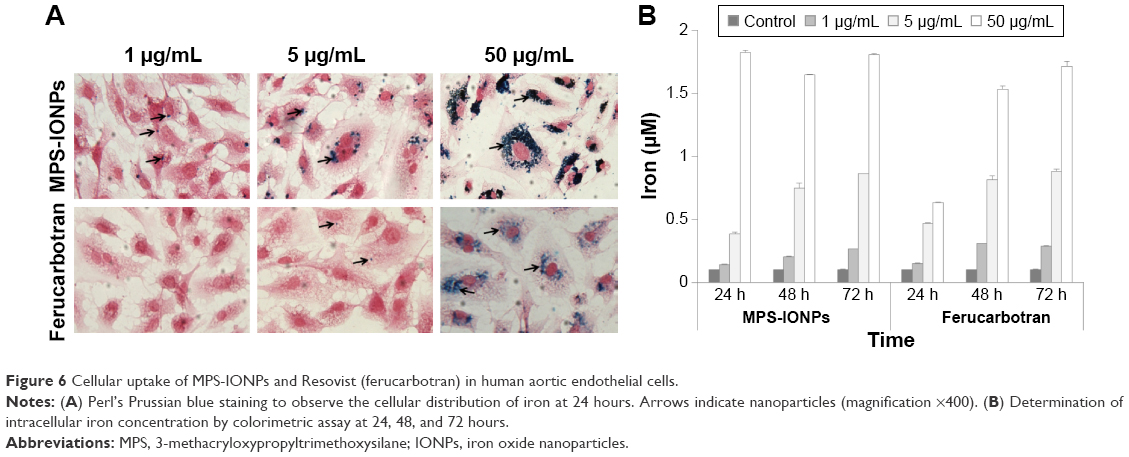 | Figure 6 Cellular uptake of MPS-IONPs and Resovist (ferucarbotran) in human aortic endothelial cells. |
To quantify intracellular iron concentration, an iron colorimetric assay was performed after exposure of cells to 1, 5, and 50 μg Fe/mL MPS-IONPs and ferucarbotran for 24, 48, and 72 hours. The colorimetric assay specifically detects iron by chelating with ferrozine-like structure, and has been used to determine intracellular IONP uptake.24 The uptake increased in a time- and concentration-dependent manner for both IONPs (Figure 6B). However, at 50 μg Fe/mL, MPS-IONPs were more rapidly internalized than ferucarbotran, resulting in a higher intracellular iron concentration at 24 hours. This result coincided with the cytotoxicity assay (Figure 5) and Prussian blue staining (Figure 6A). The cytotoxicity and distribution of MPS-IONPs were greater than that of ferucarbotran at 50 μg Fe/mL 24 hours postinjection. Taken together, these findings suggest that the uptake rate of MPS-IONPs was enhanced at a relatively early time point (24 hours) under higher exposure concentration (50 μg Fe/mL).
Measurement of ROS generation
ROS generation was analyzed by fluorescence microscopy using an ROS-detection kit (Figure 7A). Total ROS production increased with the increment in iron concentration. Notably, MPS-IONPs at 50 μg Fe/mL and ferucarbotran at 1, 5, and 50 μg Fe/mL induced ROS production mainly in the cytosol, while MPS-IONPs at 5 μg Fe/mL induced partial ROS generation in the nucleus and in the cytosol. If we assume that ROS generation was due to the distribution of IONPs in the same compartment, the interpretation of this result was that MPS-IONPs, not ferucarbotran, were able to penetrate the nuclear membrane at a lower concentration (5 μg Fe/mL). Statistical analysis of fluorescence intensity in the cytosol and nucleus clearly showed that the nuclear ROS level induced by ferucarbotran was significantly lower than that of cytosol at 5 and 50 μg Fe/mL (P<0.001), but nuclear ROS was quite comparable to cytosolic ROS induced by 5 μg Fe/mL MPS-IONPs (Figure 7B). These results were supported by TEM analysis (Figure 7C), which showed nuclear distribution of MPS-IONPs at 1 μg Fe/mL. There have been several studies on cellular ROS generation induced by IONPs. Khan et al25 reported that citrate-coated IONPs (50 μg/mL) can cause almost a doubling of ROS 24 hours after IONP treatment to A549 cells. In this study, the majority of IONPs were distributed in cytosol. When Fe2O3 nanopowder was dispersed in deionized water (120 μg/mL) by sonication and administered to MCF-7 cells, ROS production was induced almost twofold after 24 hours, in both cytosol and the nucleus.26
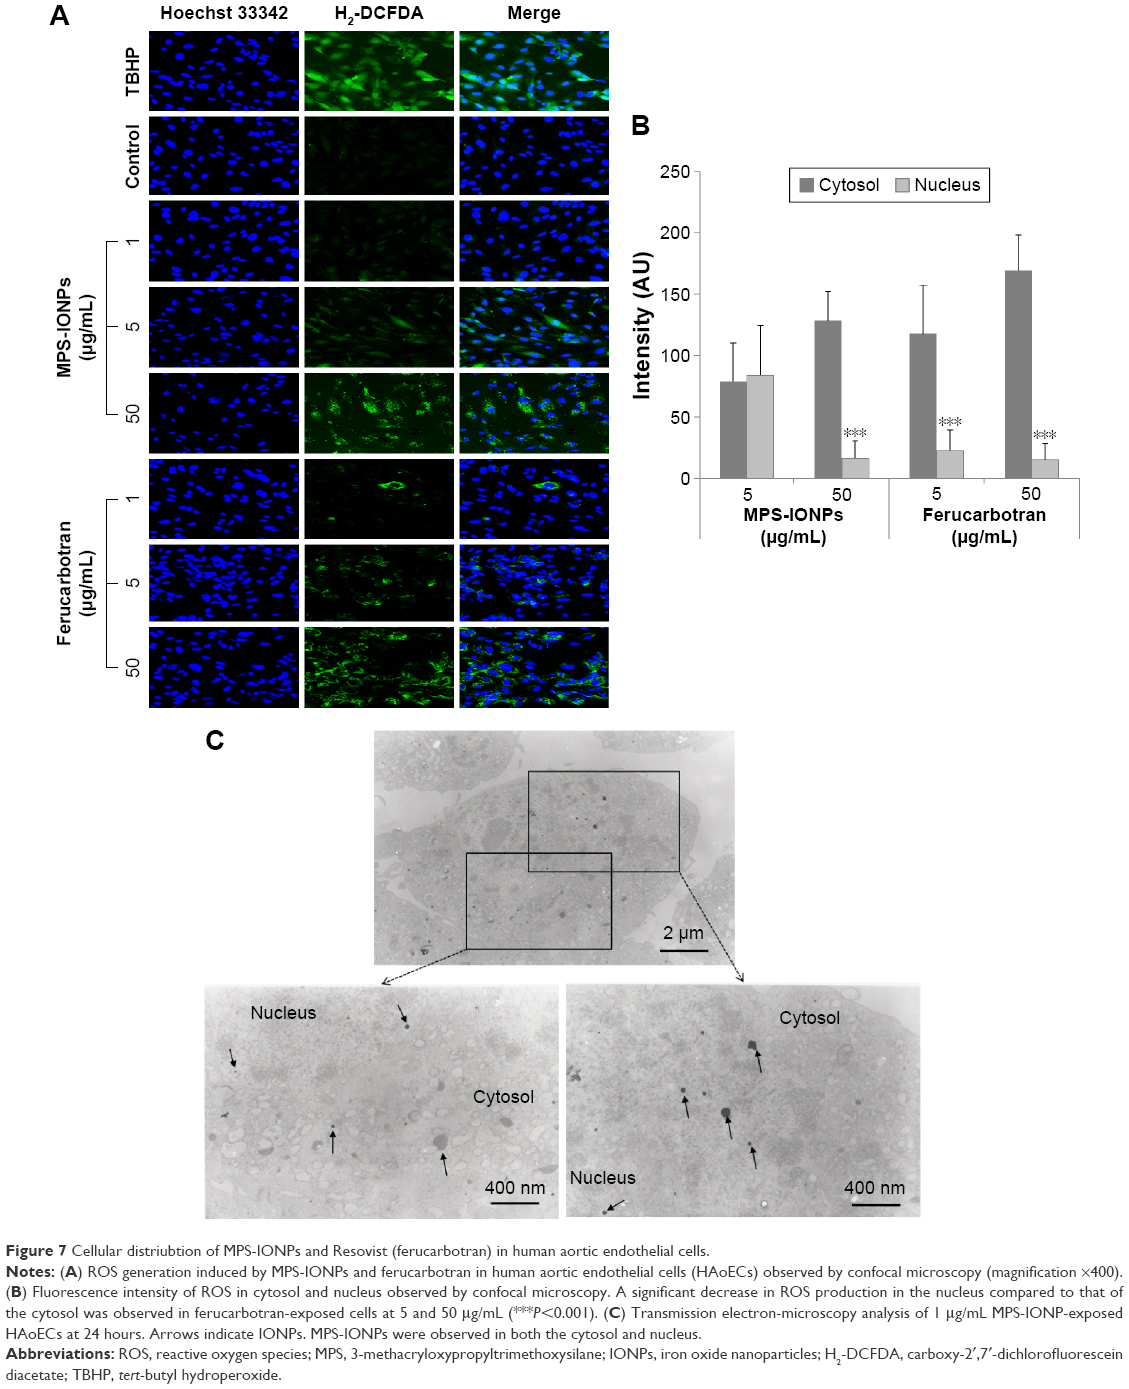 | Figure 7 Cellular distriubtion of MPS-IONPs and Resovist (ferucarbotran) in human aortic endothelial cells. |
Altogether, the cellular distribution of MPS-IONPs and ferucarbotran was different according to test concentration, and subsequent production of ROS in HAoECs could be related to the cytotoxicity observed at 50 μg Fe/mL for both.
Pathway analysis of DEGs by IONPs
Five groups (control and MPS-IONP- or ferucarbotran-exposed HAoECs at 1 and 50 μg Fe/mL) were analyzed by gene-microarray analysis to identify the molecular changes caused by IONPs. In total, 13,064 genes were changed over twofold in at least one group relative to the control. Figure 8A shows the expression profile of 13,064 genes converted to a heat map for upregulated (green) or downregulated (red) genes compared to the control. The heat-map analysis clearly indicated that the gene-expression profiles in four groups were quite similar and changed synchronously with each other. Among these, 5,119 and 4,203 genes were selected as DEGs for MPS-IONPs and ferucarbotran, respectively, which were changed in both 1 and 50 μg Fe/mL-treated cells. Figure 8B shows that 2,904 genes were common DEGs for both MPS-IONPs and ferucarbotran, which was 45% of the total DEGs.
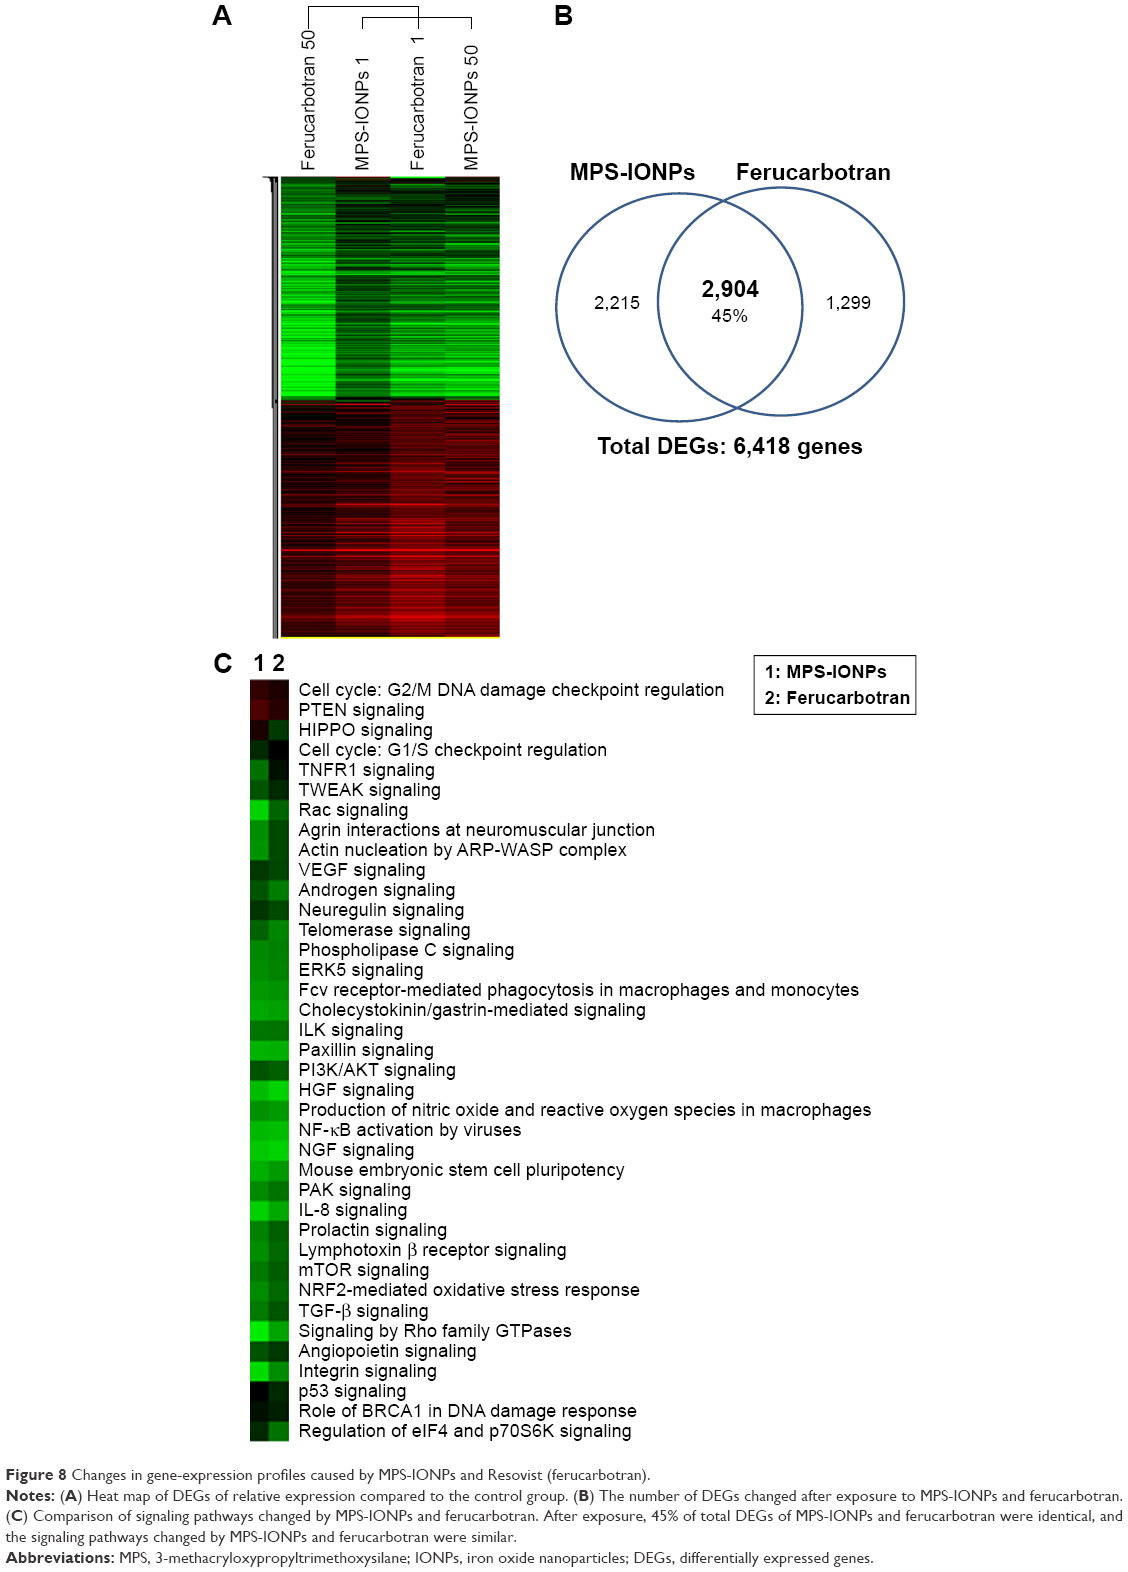 | Figure 8 Changes in gene-expression profiles caused by MPS-IONPs and Resovist (ferucarbotran). |
Figure 8C shows the result of pathway analysis of DEGs using the IPA database. Both MPS-IONPs and ferucarbotran altered 38 signaling pathways. The heat map of these 38 signaling pathways shows that MPS-IONPs and ferucarbotran synchronously changed all pathways. All pathways except cell cycle and PTEN signaling were changed negatively by both IONPs. This result indicated that both IONPs caused similar effects at the molecular level.
In vivo distribution, accumulation, and excretion
To analyze the in vivo distribution, accumulation, and excretion of MPS-IONPs and ferucarbotran, the particles were administered intravenously to rats and the iron concentration measured in the livers, kidneys, lungs, urine, stools, and blood before and at 1, 7, and 30 days after administration. Figure 9A and B shows that the liver was the main target organ for both MPS-IONPs and ferucarbotran. In addition, MPS-IONPs and ferucarbotran were also distributed in the lung and kidney. In ferucarbotran-injected rats, the iron concentration in the liver, lung, and kidney increased for 7 days and decreased to background concentration at 30 days postinjection, but the rats administered MPS-IONPs maintained elevated iron levels until 30 days postinjection. The relative iron concentration at day 30 to day 7 in lung, kidney, and liver is shown in Table 1. The iron concentration by exposure to MPS-IONPs at Day 30 was increased to 64%, 126%, and 131% of that of day 7 for lung, kidney, and liver, respectively. However, the remaining ferucarbotran concentration after 30 days was determined as 26%, 13%, and 17% that of day 7. These results indicated that ferucarbotran rather than MPS-IONPs attenuated the iron accumulation in animal tissues. The iron concentration in the blood was also analyzed following injection of IONPs. Iron concentration in the blood was maintained until 30 days postinjection in rats injected with MPS-IONPs, but decreased to the background level for the same period in ferucarbotran-injected rat blood.
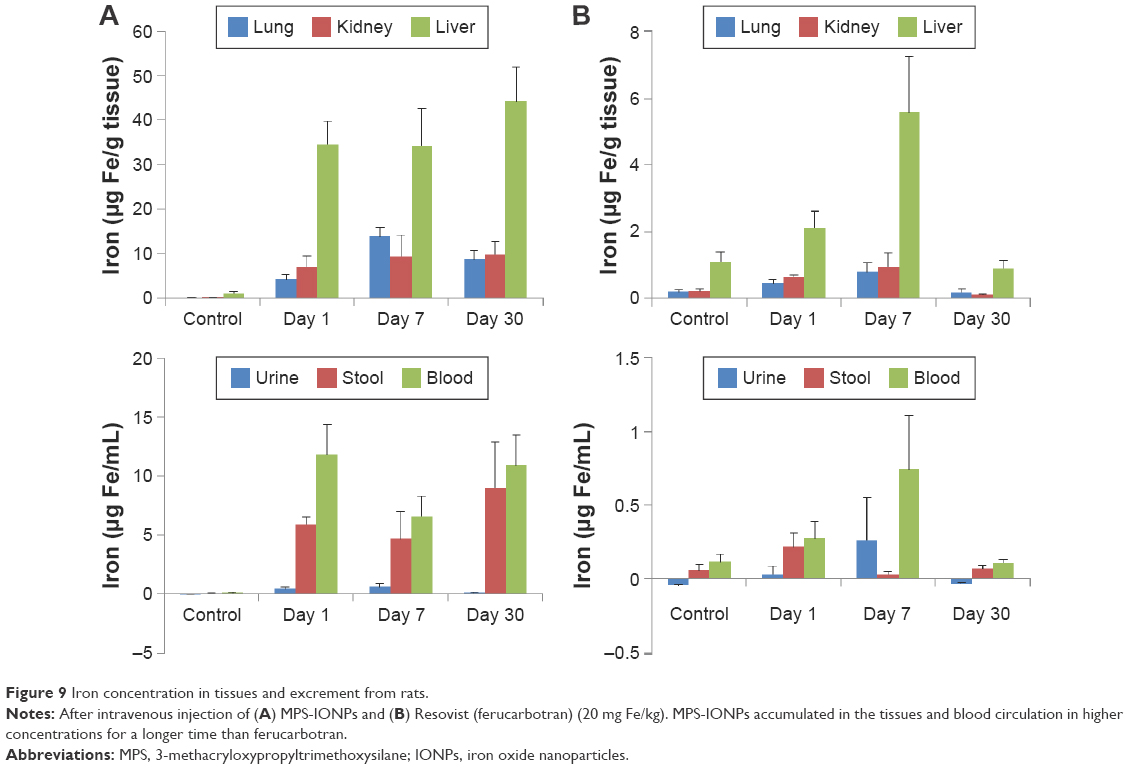 | Figure 9 Iron concentration in tissues and excrement from rats. |
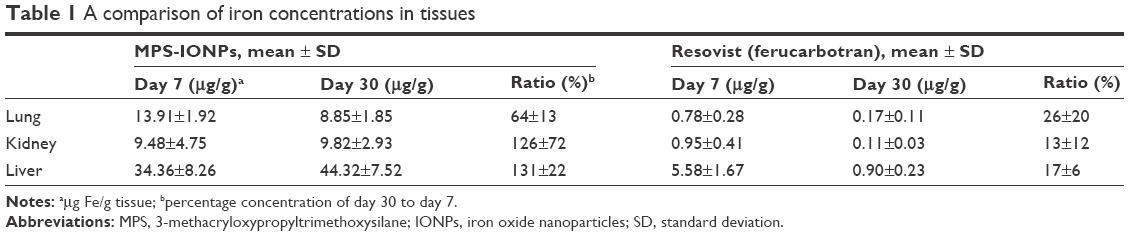 | Table 1 A comparison of iron concentrations in tissues |
Based on the iron concentration in each fraction, stool was determined to be the primary excretion route for MPS-IONPs, but ferucarbotran was excreted via both urine and stool. Furthermore, ferucarbotran was cleared rapidly to the background level in urine and stool within 30 days, but MPS-IONPs required longer periods to be cleared. As a result, MPS-IONPs showed increased uptake and a longer period of accumulation in rat tissues than ferucarbotran.
Discussion
Based on the importance of physicochemical properties of NPs on their biological effects, the difference in surface charges (1.6 mV vs −12.7 mV) and sizes (11.5 nm vs 5.7 nm) between MPS-IONPs and ferucarbotran was expected to result in quite different responses in biological effects. This hypothesis was based on previous reports that the cellular uptake of NPs depended on their size, shape, and surface charges.27–29 In our study, the uptake of MPS-IONPs was more increased at 24 hours than ferucarbotran, as shown in Figure 6A and B. Increased cytotoxicity of MPS-IONPs at 50 μg Fe/mL over that of ferucarbotran was attributed to their enhanced uptake (Figure 5).
Because the internalization mechanism for the NPs under ~120 nm has been reported to be endocytosis,6 differences in surface charges could be a more important factor to determine the uptake route of MPS-IONPs and ferucarbotran. For example, the uptake mechanism of negatively charged ferucarbotran was nonspecific phagocytosis in human umbilical vein ECs1 and squamous carcinoma cells.30 The neutral NPs showed no clear preference for specific routes, and it has been proposed that the kind of ligand in the formation of NPs may contribute to route selection.31 MPS-IONPs are more hydrophobic than ferucarbotran, and thus they are assumed to have a higher affinity for the cell membrane and subsequently to show an increased uptake rate through the lipid bilayer of cellular membranes.
NPs have been widely investigated for their toxicity, and a number of NPs cause oxidative stress by inducing ROS.32 The intracellular distribution of ROS production was observed in the HAoECs injected with 5 and 50 μg Fe/mL MPS-IONPs and 1, 5, and 50 μg Fe/mL ferucarbotran (Figure 7A). Among them, the distribution of nuclear ROS was observed slightly in 5 μg Fe/mL MPS-IONP-exposed cells, which was supported by the fluorescence intensity in the cytosol and nucleus (Figure 7B). Because NPs smaller than 40 nm are capable of entering the nucleus,4 this could explain the observation that cellular MPS-IONPs were able to penetrate nuclear membranes when exposed at 5 μg/mL, but were able to agglomerate to increase the hydrodynamic size and thus be unable to pass through the nuclear membrane at 50 μg Fe/mL exposure. Ferucarbotran induced ROS production only in the cytosol, though its hydrodynamic size was 16 nm, which was under the size limit for the penetration of nuclear membranes. This result coincided with previous reports on the cytosolic distribution of ferucarbotran33,34 and other NPs coated with dextran and PEG.35,36 Together, the MPS-IONPs showed different behaviors in cellular distribution, which seemed to be caused by the difference in their surface ligands.
The gene-expression profiles indicated that the changes in expression at the molecular level were quite similar after exposure to 1 and 50 μg Fe/mL MPS-IONPs or ferucarbotran (Figure 8A). Moreover, 45% (2,904 genes) of the DEGs selected were commonly expressed in both MPS-IONP- and ferucarbotran-exposed cells (Figure 8B). The analysis based on the DEGs revealed that no signaling pathway showed reverse response by MPS-IONPs or ferucarbotran. The up- or downregulation of a pathway was completely synchronous between MPS-IONP- and ferucarbotran-exposed cells (Figure 8C). This result supports the view that the effects of MPS-IONPs are almost comparable to those of ferucarbotran at the molecular level.
Thus far, NP effects have been described based on the induction of oxidative stress, inflammation, and apoptosis as cellular responses.37 Signaling pathways, such as PI3K–AKT,38 NFκB,39 and EGFR,40 have been reported as key signaling pathways influenced by NPs. In a recent study, silver NPs with positive and negative charges were used to study gene expression related to oxidative stress, and the results showed that the gene-expression pattern did not differ with surface charge.41 For neutrally and positively charged silica NPs, the expression of inflammation-related cytokines did not differ significantly dependent on surface charge.42 In this study, we showed for the first time that the thorough changes in signaling pathways affected by IONPs with different surface materials and sizes were quite similar. The surface charges and individual sizes measured outside of the organism would not be detrimental factors for biological effects of IONPs.
The two IONPs were comparable in their distribution in the animal body. Figure 9A and B shows that the primary target tissue for MPS-IONPs and ferucarbotran was the liver. There was an approximately three- to fivefold-increased accumulation in the liver compared to the lung and kidney of both MPS-IONP and ferucarbotran in the exposed rats. This result was expected, because ferucarbotran has been approved specifically for MRI of the liver.43
Higher iron concentration in the stool compared to urine was observed in MPS-IONP-administered rats, which was attributed to the fact that particles accumulated in the liver are prone to be excreted through stool.44 The iron concentration in the urine from ferucarbotran-exposed rats increased at day 7, indicating that urine was another main route of excretion for ferucarbotran, as reported previously.45
MPS-IONPs exhibited different effects than ferucarbotran in terms of tissue accumulation in vivo. The iron concentration in MPS-IONP-administered rat livers was maintained until 30 days postinjection, while it decreased to background level at 30 days after injection in ferucarbotran-administered rats. The iron concentration in the blood of MPS-IONP-injected rats also maintained its concentration over 30 days. Furthermore, the average iron concentration in tissues from MPS-IONP-injected rats was nearly tenfold higher than that from ferucarbotran-injected rats. Together, MPS-IONPs were accumulated in the tissues and blood circulation in higher concentrations for a longer time than ferucarbotran. This result was attributed to the neutral hydrophobic nature of MPS-IONPs, because it is known that hydrophobicity is a key parameter for prediction of accumulation in the biological system.46 As the surface charge of MPS-IONPs and ferucarbotran was proposed to be critical for cellular uptake by HAoECs, it is hypothesized that the different behaviors of MPS-IONPs and ferucarbotran in vivo, such as tissue uptake, excretion, and accumulation characteristics, would also be related to their surface modification.
Conclusion
Uptake of neutral hydrophobic MPS-IONPs in HAoECs was more than that of hydroxymethyl dextran-coated ferucarbotran. However, the signaling pathways changed by MPS-IONPs were almost comparable to those of ferucarbotran. These results suggest that surface coating of IONPs is not critical for their target signaling pathways, but may be a determinant of cellular uptake. The tissue uptake and accumulation period for MPS-IONPs were longer than those of ferucarbotran in vivo, which is believed to have been related to their surface charges. This is the first study to show the effects of surface coating of IONPs on signaling pathways and also the distribution, excretion, and accumulation of neutral-hydrophobic IONPs in vivo.
Acknowledgments
We thank Professor Don Haeng Lee, who provided inspiration for this study, and to Ms Mi Soon Kim, for her contribution in animal care required in this study. This research was supported by the Basic Science Research Program through the National Research Foundation of Korea (NRF) funded by the Ministry of Science, ICT & Future Planning (NRF-2010-0006865). This work was also supported by the DGIST R&D Program of the Ministry of Science, ICT & Future Planning of Korea (15-01-HRLA-02).
Disclosure
The authors report no conflicts of interest in this work.
References
Schlorf T, Meincke M, Kossel E, Glüer CC, Jansen O, Mentlein R. Biological properties of iron oxide nanoparticles for cellular and molecular magnetic resonance imaging. Int J Mol Sci. 2010;12:12–23. | ||
Landsiedel R, Fabian E, Ma-Hock L, et al. Toxico-/biokinetics of nanomaterials. Arch Toxicol. 2012;86:1021–1060. | ||
Verma A, Stellacci F. Effect of surface properties on nanoparticle-cell interactions. Small. 2010;6:12–21. | ||
Dawson KA, Salvati A, Lynch I. Nanotoxicology: nanoparticles reconstruct lipids. Nat Nanotechnol. 2009;4:84–85. | ||
Wahajuddin, Arora S. Superparamagnetic iron oxide nanoparticles: magnetic nanoplatforms as drug carriers. Int J Nanomedicine. 2012;7:3445–3471. | ||
Rauch J, Kolch W, Laurent S, Mahmoudi M. Big signals from small particles: regulation of cell signaling pathways by nanoparticles. Chem Rev. 2013;113:3391–3406. | ||
Maurizi L, Papa AL, Dumont L, et al. Influence of surface charge and polymer coating on internalization and biodistribution of polyethylene glycol-modified iron oxide nanoparticles. J Biomed Nanotech. 2015;11:126–136. | ||
Liu Y, Wang J. Effects of DMSA-coated Fe3O4 nanoparticles on the transcription of genes related to iron and osmosis homeostasis. Toxicol Sci. 2013;131:521–536. | ||
Sun Y, Ding X, Zheng Z, Cheng X, Hu X, Peng Y. Magnetic separation of polymer hybrid iron oxide nanoparticles triggered by temperature. Chem Commun (Camb). 2006;26:2765–2767. | ||
Kim EJ, Lee SG, Kim HC, et al. Phosphocholine-modified magnetic nanoparticles for isolation of C-reactive protein from human serum. Sep Sci Technol. 2013;48:2600–2607. | ||
Kango S, Kalia S, Celli A, Njuguna J, Habibi Y, Kumar R. Surface modification of inorganic nanoparticles for development of organic-inorganic nanocomposites: a review. Prog Polym Sci. 2013;38:1232–1261. | ||
Nilsson C, Malmström E, Johansson M, Trey SM. Methacrylated dendrimers in thiol-methacrylate networks and the effect of conversion on the thermoset properties. J Polym Sci A Polym Chem. 2009;47: 5815–5826. | ||
Owen MJ. 3-Methacryloxypropyltrimethoxysilane. In: Clarson, SJ, Owen MJ, Smith SD, Dyke MV, Brook M, Mabry J, editors. Progress in Silicones and Silicone-Modified Materials. Washington: American Chemical Society; 2013:47–56. | ||
Cannas C, Gatteschi D, Musinu A, Piccaluga G, Sangregorio C. Structural and magnetic properties of Fe2O3 nanoparticles dispersed over a silica matrix. J Phys Chem B. 1998;102:7721–7726. | ||
Li L, Jiang W, Luo K, et al. Superparamagnetic iron oxide nanoparticles as MRI contrast agents for non-invasive stem cell labeling and tracking. Theranostics. 2013;3:595–615. | ||
Reimer P, Balzer T. Ferucarbotran (Resovist): a new clinically approved RES-specific contrast agent for contrast-enhanced MRI of the liver: properties, clinical development, and applications. Eur Radiol. 2003;13:1266–1276. | ||
GenMapp.org [database on the Internet]. San Francisco, CA: Gladstone Institutes, University of California at San Francisco. Available from: http://www.genmapp.org. Accessed June 29, 2014. | ||
Huang DW, Sherman BT, Lempicki RA. Systematic and integrative analysis of large gene lists using DAVID Bioinformatics Resources. Nature Protoc. 2009;4(1):44–57. | ||
Huang DW, Sherman BT, Lempicki RA. Bioinformatics enrichment tools: paths toward the comprehensive functional analysis of large gene lists. Nucleic Acids Res. 2009;37(1):1–13. | ||
MEDLINE® [database on the Internet]. Bethesda, MD: National Library of Medicine. Available from: http://www.ncbi.nlm.nih.gov/pubmed/. Accessed July 2, 2014. | ||
Posthumus W, Magusin PC, Brokken-Zijp JC, Tinnemans AH, van der Linde R. Surface modification of oxidic nanoparticles using 3-methacryloxypropyltrimethoxysilane. J Colloid Interface Sci. 2004;269:109–116. | ||
Zohreh N, Hosseini SH, Pourjavadi A, Bennett C. Cross-linked poly(dimethylaminoethyl acrylamide) coated magnetic nanoparticles: a high loaded, retrievable, and stable basic catalyst for the synthesis of benzopyranes in water. RSC Adv. 2014;4:50047–50055. | ||
Sharma V, Shukla RK, Saxena N, Parmar D, Das M, Dhawan A. DNA damaging potential of zinc oxide nanoparticles in human epidermal cells. Toxicol Lett. 2009;185:211–218. | ||
Calero M, Chiappi M, Lazaro-Carrillo A, et al. Characterization of interaction of magnetic nanoparticles with breast cancer cells. J Nanobiotechnology. 2015;13:16–30. | ||
Khan MI, Mohammad A, Patil G, Naqvi SA, Chauhan LK, Ahmad I. Induction of ROS, mitochondrial damage and autophagy in lung epithelial cancer cells by iron oxide nanoparticles. Biomaterials. 2012;33:1477–1488. | ||
Alarifi S, Ali D, Alkahtani S, Alhader MS. Iron oxide nanoparticles induce oxidative stress, DNA damage, and caspase activation in the human breast cancer cell line. Biol Trace Elem Res. 2014;159:416–424. | ||
Oh N, Park JH. Endocytosis and exocytosis of nanoparticles in mammalian cells. Int J Nanomedicine. 2014;9:51–63. | ||
Shang L, Nienhaus K, Nienhaus GU. Engineered nanoparticles interacting with cells: size matters. J Nanobiotechnology. 2014;12:5–15. | ||
Perumal OP, Inapagolla R, Kannan S, Kannan RM. The effect of surface functionality on cellular trafficking of dendrimers. Biomaterials. 2008;29:3469–3476. | ||
Lindemann A, Lüdtke-Buzug K, Fräderich BM, Gräfe K, Pries R, Wollenberg B. Biological impact of superparamagnetic iron oxide nanoparticles for magnetic particle imaging of head and neck cancer cells. Int J Nanomedicine. 2014;9:5025–5040. | ||
Kou L, Sun J, Zhai Y, He Z. The endocytosis and intracellular fate of nanomedicines: implication for rational design. Asian J Pharm Sci. 2013;8:1–10. | ||
Nel AE, Mädler L, Velegol D, et al. Understanding biophysicochemical interactions at the nano-bio interface. Nat Mater. 2009;8:543–557. | ||
Ittrich H, Lange C, Tögel F, et al. In vivo magnetic resonance imaging of iron oxide-labeled, arterially-injected mesenchymal stem cells in kidneys of rats with acute ischemic kidney injury: detection and monitoring at 3T. J Magn Reson Imaging. 2007;25:1179–1191. | ||
Wu HY, Chung MC, Wang CC, Huang CH, Liang HJ, Jan TR. Iron oxide nanoparticles suppress the production of IL-1β via the secretory lysosomal pathway in murine microglial cells. Part Fibre Toxicol. 2013;10:46–56. | ||
Montet-Abou K, Montet X, Weissleder R, Josephson L. Cell internalization of magnetic nanoparticles using transfection agents. Mol Imaging. 2007;6:1–9. | ||
Salvati A, Pitek AS, Monopoli MP, et al. Transferrin-functionalized nanoparticles lose their targeting capabilities when a biomolecule corona adsorbs on the surface. Nat Nanotechnol. 2013;8:137–143. | ||
Nel A, Xia T, Madler L, Li N. Toxic potential of materials at the nanolevel. Science. 2006;311:622–627. | ||
Son Y, Cheong YK, Kim NH, Chung HT, Kang DG, Pae HO. Mitogen-activated protein kinases and reactive oxygen species: how can ROS activate MAPK pathways? J Signal Transduct. 2011;2011:792639–792645. | ||
Nishanth RP, Jyotsna RG, Schlager JJ, Hussain SM, Reddanna P. Inflammatory responses of RAW 264.7 macrophages upon exposure to nanoparticles: role of ROS-NFκB signaling pathway. Nanotoxicology. 2011;5:502–516. | ||
Unfried K, Sydlik U, Bierhals K, Weissenberg A, Abel J. Carbon nanoparticle-induced lung epithelial cell proliferation is mediated by receptor-dependent Akt activation. Am J Physiol Lung Cell Mol Physiol. 2008;294:L358–L367. | ||
Dominguez GA, Lohse SE, Torelli MD, et al. Effects of charge and surface ligand properties of nanoparticles on oxidative stress and gene expression within the gut of Daphnia magna. Aquat Toxicol. 2015;162:1–9. | ||
Brown DM, Kanase N, Gaiser B, Johnston H, Stone V. Inflammation and gene expression in the rat lung after instillation of silica nanoparticles: effect of size, dispersion medium and particle surface charge. Toxicol Lett. 2014;224:147–156. | ||
Wang YX. Superparamagnetic iron oxide based MRI contrast agents: current status of clinical application. Quant Imaging Med Surg. 2011;1:35–40. | ||
Chamorro S, Gutiérrez L, Vaquero MP, et al. Safety assessment of chronic oral exposure to iron oxide nanoparticles. Nanotechnology. 2015;26:205101. | ||
Curvo-Semedo L, Caseiro-Alves F. MR contrast agents. In: Nicholas CG, editor. Clinical MRI of the Abdomen: Why, How, When. Heidelberg: Springer; 2011:17–39. | ||
Gobas FA, Kelly BC, Arnot JA. Quantitative structure activity relationships for predicting the bioaccumulation of pops in terrestrial food-webs. QSAR Comb Sci. 2003;22:329–336. |
 © 2016 The Author(s). This work is published and licensed by Dove Medical Press Limited. The
full terms of this license are available at https://www.dovepress.com/terms
and incorporate the Creative Commons Attribution
- Non Commercial (unported, 3.0) License.
By accessing the work you hereby accept the Terms. Non-commercial uses of the work are permitted
without any further permission from Dove Medical Press Limited, provided the work is properly
attributed. For permission for commercial use of this work, please see paragraphs 4.2 and 5 of our Terms.
© 2016 The Author(s). This work is published and licensed by Dove Medical Press Limited. The
full terms of this license are available at https://www.dovepress.com/terms
and incorporate the Creative Commons Attribution
- Non Commercial (unported, 3.0) License.
By accessing the work you hereby accept the Terms. Non-commercial uses of the work are permitted
without any further permission from Dove Medical Press Limited, provided the work is properly
attributed. For permission for commercial use of this work, please see paragraphs 4.2 and 5 of our Terms.