Back to Journals » International Journal of Nanomedicine » Volume 11
The effect of insulin-loaded linear poly(ethylene glycol)-brush-like poly(L-lysine) block copolymer on renal ischemia/reperfusion-induced lung injury through downregulating hypoxia-inducible factor
Authors Tong F ![]() , Tang X, Li X, Xia W, Liu D
, Tang X, Li X, Xia W, Liu D
Received 5 November 2015
Accepted for publication 5 February 2016
Published 27 April 2016 Volume 2016:11 Pages 1717—1730
DOI https://doi.org/10.2147/IJN.S99890
Checked for plagiarism Yes
Review by Single anonymous peer review
Peer reviewer comments 2
Editor who approved publication: Professor Lei Yang
Fei Tong, Xiangyuan Tang, Xin Li, Wenquan Xia, Daojun Liu
Department of Chemistry, Medical College, Shantou University, Shantou, People’s Republic of China
Abstract: The aim of this study was to observe the therapeutic effect of insulin-loaded linear poly(ethylene glycol)-brush-like poly(L-lysine) block copolymer poly(ethylene glycol)-b-(poly(ethylenediamine L-glutamate)-g-poly(L-lysine)) (PEG-b-(PELG-g-PLL) on renal ischemia/reperfusion-induced lung injury through downregulating hypoxia-inducible factor (HIF) as compared to free insulin. Sprague Dawley rats were pretreated with 30 U/kg insulin or insulin/PEG-b-(PELG-g-PLL) complex, and then subjected to 45 minutes of ischemia and 24 hours of reperfusion. The blood and lungs were collected, the level of serum creatinine and blood urea nitrogen were measured, and the dry/wet lung ratios, the activity of superoxide dismutase and myeloperoxidase, the content of methane dicarboxylic aldehyde and tumor necrosis factor-α, and the expression of HIF-1α and vascular endothelial growth factor (VEGF) were measured in pulmonary tissues. Both insulin and insulin/PEG-b-(PELG-g-PLL) preconditioning improved the recovery of renal function, reduced pulmonary oxidative stress injury, restrained inflammatory damage, and downregulated the expression of HIF-1α and VEGF as compared to ischemia/reperfusion group, while insulin/PEG-b-(PELG-g-PLL) significantly improved this effect.
Keywords: insulin, block copolymer, RI/RILI, HIF-1α, VEGF
Introduction
Renal ischemia/reperfusion injury (RI/RI) is a major clinical problem.1 The morbidity and mortality from RI/RI are very high and remain virtually unchanged for the past few decades, in part because of a high incidence of extrarenal complications.1,2 In particular, pulmonary damage is very frequent in patients suffering from RI/RI. It is a serious complication of RI/RI. The extrarenal systemic complication secondary to RI/RI is the leading cause of mortality in the intensive care unit.3 Indeed, clinical studies show that patients with isolated RI/RI have significantly better prognosis than patients with RI/RI plus extrarenal organ dysfunction.4
Inflammation has a major function in the progression of RI/RI, and present studies have shown that innate immunity contributes to the pathogenesis of RI/RI.5,6 Proinflammatory cytokines including tumor necrosis factor-α (TNF-α) and myeloperoxidase (MPO) generated by injured renal tissue have been implicated as the major contributors of RI/RI.7–9 Indeed, increased circulating proinflammatory cytokine levels are detected in rats and human beings with RI/RI.10 Induction of RI/RI results in increased circulating proinflammatory cytokines (TNF-α and MPO), and these cytokines directly cause pulmonary damage.
Hypoxia-inducible factor (HIF) is a heterodimeric basic helix–loop–helix protein composed of a 91–94 kDa β-subunit and a hydroxylase-regulated oxygen-sensitive 120 kDa α subunit.11,12 Previous studies have demonstrated that HIF-1 is implicated in most aspects of hypoxia-induced gene expression and is essential for hypoxia-induced increases in glycolysis and angiogenesis in tumor cells as well as normal tissues.13 High levels of HIF-1α expression and pronounced vascular beds with enhanced permeability are seen in tumor.14 It is particularly indicative of high levels of expression of one HIF-1 target, the angiogenic/vascular permeability factor vascular endothelial growth factor (VEGF).15 HIF-1α and VEGF are expressed in activated macrophages.16–18 It has been reported that HIF-1α, its target gene VEGF, and its upstream regulator, the von Hippel–Lindau factor, in separate mouse strains, express cyclization recombination enzyme (Cre) recombinase in granulocytes and monocytes/macrophages.14 This shows that HIF-1α directs regulation of survival and function in the inflammatory microenvironment. Renal ischemia reperfusion can lead to pulmonary circulation dysfunction and can generate many proinflammatory cytokines to lung and aggravate pulmonary anoxia. These result in the activation of HIF to induce inflammatory responses in neutrophils and further damage the lung.
It has been demonstrated that insulin could protect the isolated rat kidney from ischemia/reperfusion (I/R) injury in diabetes mellitus.19 In the present study, we try to explore the protective effect of insulin on RI/RI lung injury. As well known, the in vivo half-life of insulin is very short; therefore, controlling insulin dose clinically is very difficult with the risk of hypoglycemia.20 Here, a linear poly(ethylene glycol) (PEG)-brush-like poly(L-lysine) (PLL) block copolymer poly(ethylene glycol)-b-(poly(ethylenediamine L-glutamate)-g-poly(L-lysine)) (PEG-b-(PELG-g-PLL) (structure shown in Figure 1) as a potential insulin nanocarrier is reported. The block copolymer is composed of a linear PEG block and a brush-like PLL block. At physiological pH, the positively charged PLL brush block and the negatively charged insulin combine to form a polyion complex via electrostatic interactions. The encapsulated insulin demonstrated sustained release, which could facilitate the investigation on the protective effect of insulin. Insulin-loading capacity and in vitro release were determined. In vivo studies were conducted by the subcutaneous administration of the insulin/polymer complex to RI/RI lung injury in rats, followed by the determination of serum creatinine (Scr) and blood urea nitrogen (BUN), measurements of superoxide dismutase (SOD) activity, methane dicarboxylic aldehyde (MDA), TNF-α and MPO level in pulmonary tissues, and finally the expression of HIF-1α and VEGF in pulmonary tissues.
 | Figure 1 (A) Encapsulation of insulin by linear-brush block copolymers. (B) The structure of PEG-b-(PELG-g-PLL). |
Materials and methods
Synthesis and cytotoxicity of block copolymer PEG-b-(PELG-g-PLL)
Detailed methods for the synthesis and cytotoxicity assay of block copolymer PEG-b-(PELG-g-PLL) are supplied in the Supplementary material.
Encapsulation and in vitro release of insulin in PEG-b-(PELG-g-PLL)
Detailed methods for the encapsulation of insulin by PEG-b-(PELG-g-PLL) and in vitro release of insulin from PEG-b-(PELG-g-PLL) are supplied in the Supplementary material.
Animal
Sprague Dawley rats (180–220 g) were supplied by the Animal Research Center of Shantou University Medical College, Shantou, People’s Republic of China. All the procedures and care administered to the animals have been approved by the Institutional Ethics Committee. In this study, 40 Sprague Dawley rats were assigned to four groups (ten rats in each group): 1) sham-operated group; 2) I/R group: I/R was achieved by clamping renal artery and vein for 45 minutes followed by 24 hours reperfusion; 3) Insulin + I/R group: insulin was administrated once at a dose of 30 U/kg by abdominal subcutaneous injection 6 hours prior to the I/R procedure; 4) Insulin/polymer + I/R group: insulin/polymer complexes were administrated once at a dose of 30 U/kg by abdominal subcutaneous injection 6 hours prior to the I/R procedure.
Surgical procedures of I/R
Rats were anesthetized with 1% pentobarbital sodium (50 mg/kg) through intraperitoneal injection. The abdomen was opened, and the renal artery and vein were separated. The artery and vein were clamped for 45 minutes by artery clamp followed by 24 hours of reperfusion. The blood samples were collected via abdominal aorta and centrifuged at 3,600× g for 15 minutes to harvest the sera. A part of left lung of rats was removed to weigh the wet lung, and then baked for 48 hours at 80°C for weight of the dry lung. A part of left lung was immediately excised and stored at −80°C for the following analyses.
Measurement of serum BUN and Scr
Serum BUN and Scr were measured according to the reported methods.21 Briefly, the blood from abdominal aorta was collected after reperfusion for 24 hours and centrifuged at 3,600× g for 15 minutes to harvest the sera. The serum BUN and Scr were measured by o-phthalaldehyde and picric acid methods, respectively.21
Measurement of SOD activity and MDA content
The levels of SOD and MDA in tissues were measured following the reported methods.22 The lung was collected after reperfusion for 24 hours, and the blood was washed thoroughly, homogenized (100 mg) in ice-cold normal saline, and then centrifuged at 3,600× g for 15 minutes to harvest the supernatant. The SOD activity and MDA content were measured by xanthine oxidase and thiobarbituric acid method.22 The absorbance was measured at 550 and 532 nm, respectively. The level of lipid peroxides was expressed as U of SOD/mg protein and nmol of MDA/mg tissue.
Measurement of TNF-α content
The content of TNF-α in pulmonary tissues was determined according to the reported method.23 Lung tissue stored at −80°C was thawed and homogenized in a buffer composed of phosphate-buffered saline, 0.5% Triton X-100, and protease inhibitor, pH 7.2. The material was then centrifuged at 3,600 rpm for 15 minutes at 4°C and the supernatant was collected for enzyme-linked immunosorbent assay. TNF-α level in lung tissue was determined by immunoassay in accordance with the manufacturer’s directions. Results were expressed in pg/mL.
Measurement of MPO activity
The MPO activity of pulmonary tissues was evaluated following the reported method.24 MPO extraction was performed by homogenization of the lung tissue in phosphate buffer, pH 6.0, containing 0.5% hexadecyltrimethylammonium bromide. The samples were sonicated, frozen in liquid nitrogen, and thawed three times. Homogenates were then centrifuged at 10,000 rpm for 15 minutes at 4°C and the supernatant was collected for the measurement of MPO activity. The changes in absorbance at 460 nm were measured by spectrophotometry and recorded at 20-second intervals for 10 minutes. Results were expressed as U/μg of tissue.
Western blot analysis
Western blot analysis was conducted following the reported methods.25,26 Briefly, pulmonary tissues were homogenized in protein lysate buffer. The homogenates were resolved on polyacrylamide sodium dodecyl sulfate gels and electrophoretically transferred to polyvinylidene difluoride membranes. The membranes were blocked with 3% bovine serum albumin, incubated with primary antibodies against active HIF-1α and VEGF, and subsequently with alkaline phosphatase-conjugated secondary antibodies. HIF-1α and VEGF were developed by 5-bromo-4-chloro-3-indolyl phosphate/nitroblue tetrazolium. Blots were stained with anti-β-actin Ab, and the levels of proteins were normalized with respect to β-actin band density.
Statistical analysis
All data were expressed as mean values ± standard deviation. Statistical analysis between groups was carried out using analysis of variance with post hoc testing. A P-value of less than 0.01 (P<0.01) was used for statistical significance.
Results
Synthesis and characterization of PEG-b-(PELG-g-PLL)
The linear poly(ethylene glycol)-brush-like poly(L-lysine) block copolymer PEG-b-(PELG-g-PLL) consists of a linear PEG block and a brush-like PLL block (Figure 1A and B). In the present study, the molecular weight of PEG block was 5 kDa, the polymerization degree of the PELG brush backbone was 50, while the polymerization degree of the PLL brush side chains was 3. The synthesis was performed in a four-step procedure as shown in Figure 2. The 1H-nuclear magnetic resonance (NMR) spectra of PEG-b-(PELG-g-PLL) and its intermediates are shown in Figure 3. As seen in Figure 3A, the characteristic proton peaks of both PEG and poly(benzyl-L-glutamate) (PBLG) block were present, confirming that the synthesis proceeded in a controlled manner. Characteristic peaks of ethylenediamine are seen in Figure 3B, indicating the success of the aminolysis reaction. Figure 3C demonstrates the 1H NMR spectrum of PEG-b-(PELG-g-PZLL) in DMSO-d6, while the 1H NMR spectrum of the final block copolymer PEG-b-(PELG-g-PLL) in D2O is shown in Figure 3D. The disappearance of proton peak of benzyl groups in Figure 3D suggests that PEG-b-(PELG-g-PLL) was synthesized successfully.
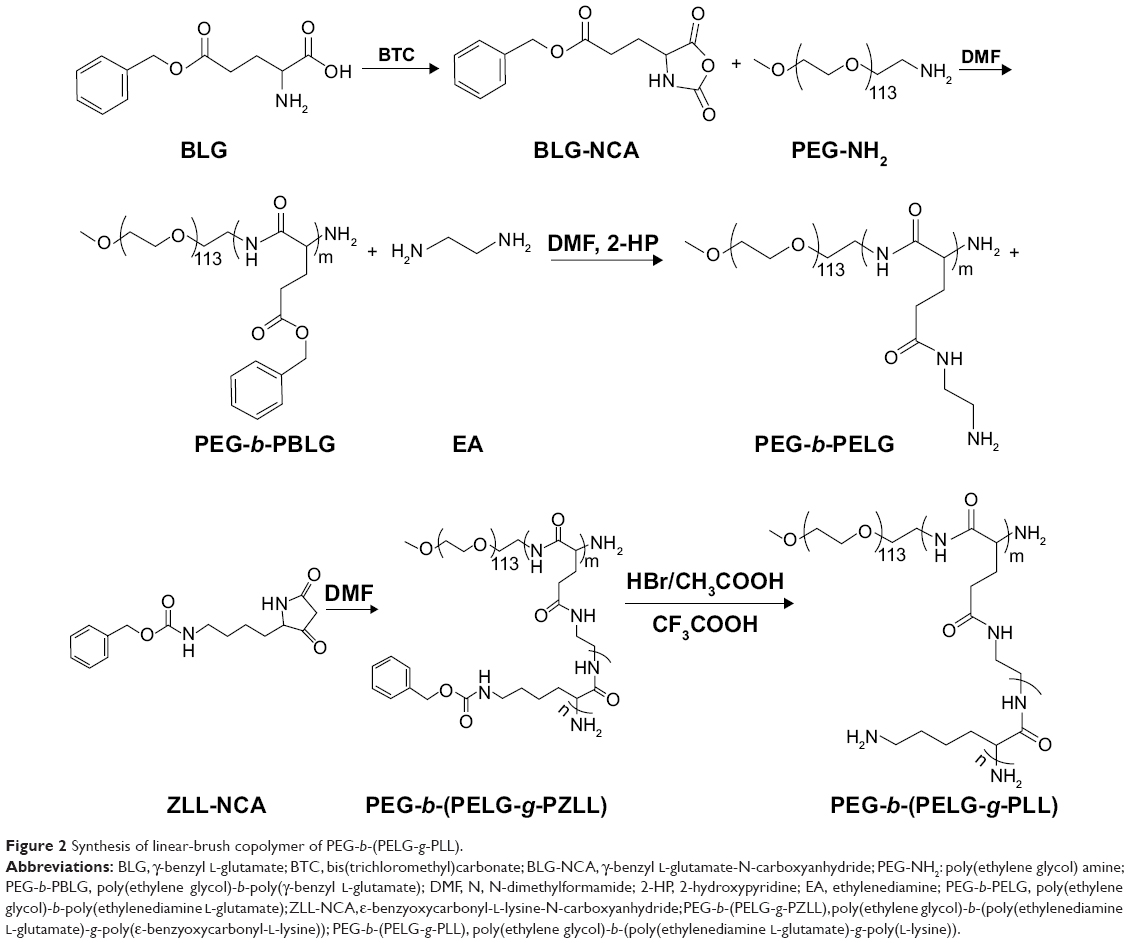 | Figure 2 Synthesis of linear-brush copolymer of PEG-b-(PELG-g-PLL). |
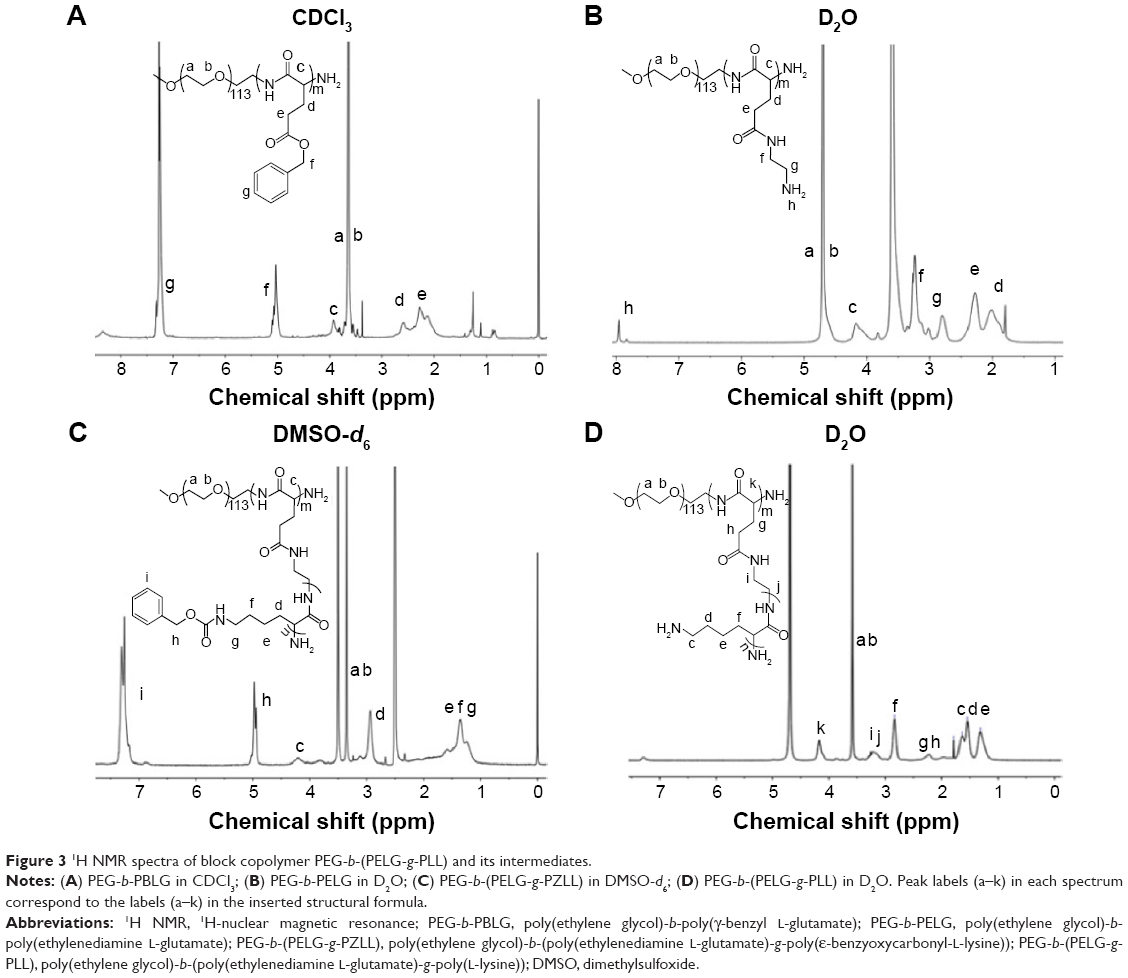 | Figure 3 1H NMR spectra of block copolymer PEG-b-(PELG-g-PLL) and its intermediates. |
The gel permeation chromatograms (GPCs) of PEG-b-(PELG-g-PLL) and its intermediates are shown in Figure 4, and the results are listed in Table 1. All GPCs demonstrated a sharp unimodal GPC peak, which suggests that the block copolymer is synthesized in a controlled manner. The molecular weight of the final product PEG-b-(PELG-g-PLL) obtained from the GPC measurement (20.8 kDa) was lower than the calculated value from 1H NMR (31.3 kDa), possibly because of the smaller hydrodynamic volumes of brush polymers compared with linear polymers.
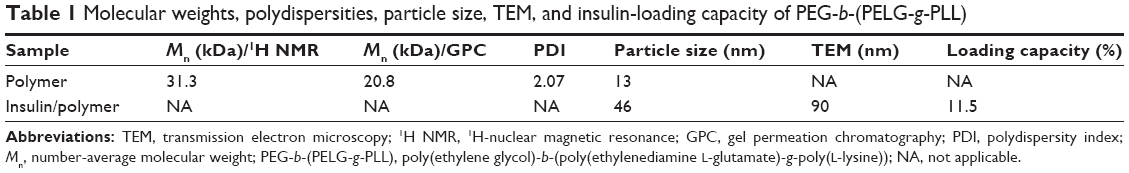 | Table 1 Molecular weights, polydispersities, particle size, TEM, and insulin-loading capacity of PEG-b-(PELG-g-PLL) |
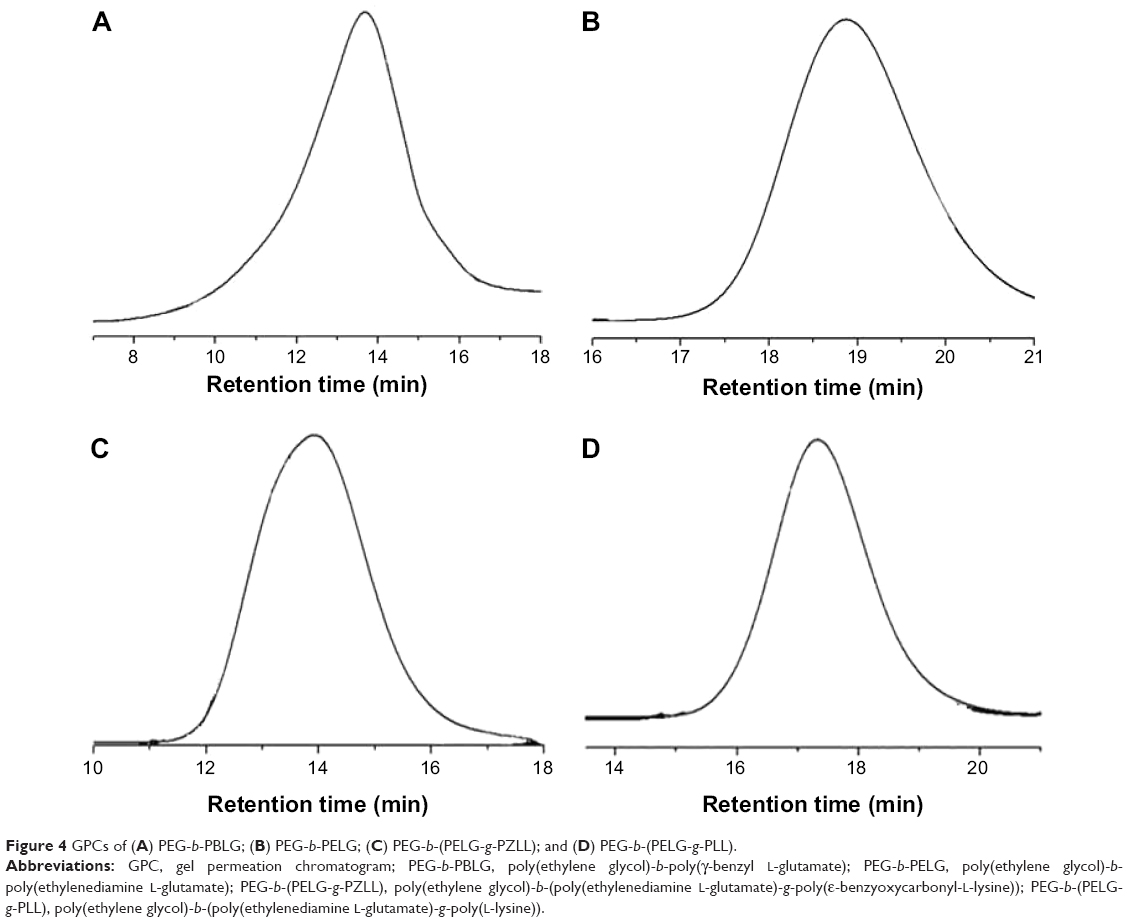 | Figure 4 GPCs of (A) PEG-b-PBLG; (B) PEG-b-PELG; (C) PEG-b-(PELG-g-PZLL); and (D) PEG-b-(PELG-g-PLL). |
Cell viability
The cytotoxicity of block copolymer PEG-b-(PELG-g-PLL) on EC9706 cells was monitored within 24 hours of culturing, and the results are shown in Figure 5A. The block copolymer exhibited high cell viability even under a concentration as high as 500 mg/L.
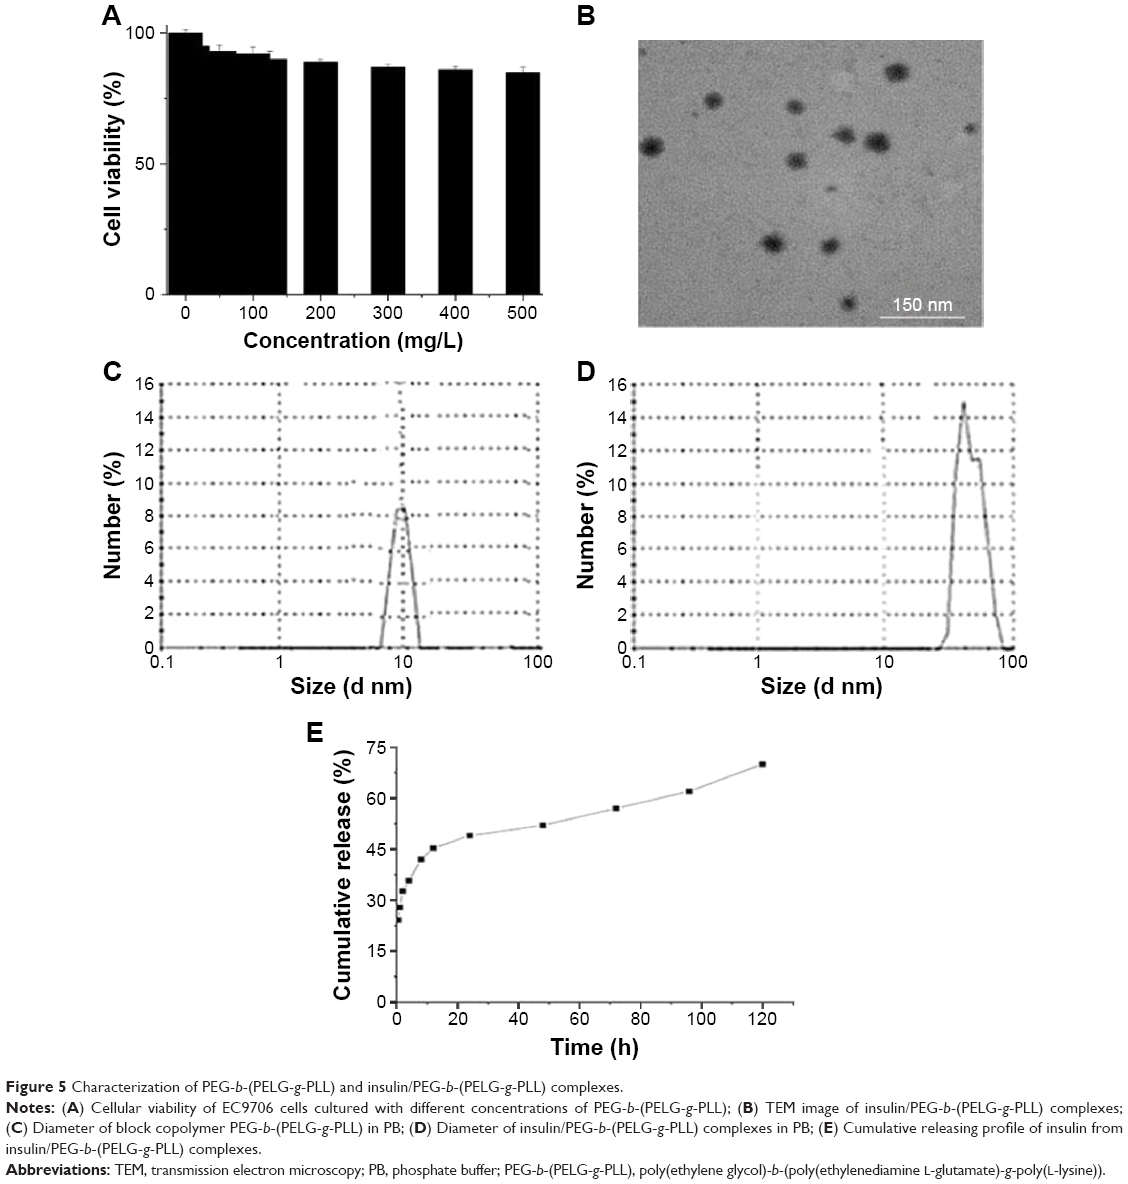 | Figure 5 Characterization of PEG-b-(PELG-g-PLL) and insulin/PEG-b-(PELG-g-PLL) complexes. |
Loading capacity of insulin in PEG-b-(PELG-g-PLL)
Insulin can be efficiently entrapped by block copolymer PEG-b-(PELG-g-PLL) under physiological pH via the electrostatic interactions between the positively charged PLL and the negatively charged insulin. Fluorescein isothiocyanate-labeled insulin was mixed with PEG-b-(PELG-g-PLL) at a mass ratio of 1:5 and dialyzed (molecular weight cut off [MWCO], 100 kDa) against phosphate buffer (PB) solution (pH 7.4, 0.01 mmol/L). The dialysis of free insulin in a PB solution was also conducted under the same conditions as a control. To determine the loading capacity of insulin in PEG-b-(PELG-g-PLL), the amount of insulin in the dialysate was measured using a fluorimeter and then subtracted from the total amount of added insulin. The loading capacity of insulin was determined to be 11.5%, expressed as the mass ratio of encapsulated insulin to the polymer host (Table 1).
Characterization of insulin/polymer complex
The insulin/polymer complex was visualized with transmission electron microscope, and the representative image is shown in Figure 5B. The insulin/polymer complex adopted a spherical structure, and the diameter was approximately 90 nm. The insulin/polymer complex was further characterized with a granulometer. The average particle size distributions of free polymer and insulin-loaded polymer are shown in Figure 5C and D, and Table 1. The average diameters of block copolymer PEG-b-(PELG-g-PLL) and insulin/polymer complex (10% insulin loading) were approximately 13 and 46 nm, respectively. The larger diameter observed by transmission electron microscope might be due to the aggregation of complexes during the drying process.
In vitro release of insulin from PEG-b-(PELG-g-PLL)
The release of insulin from PEG-b-(PELG-g-PLL) was investigated using a dialysis method (MWCO, 100 kDa) at room temperature, with 5 mL of insulin-loaded polymer against a PB solution of 0.02 mol/L (pH of 7.4). The cumulative release profile of polymer-encapsulated insulin is shown in Figure 5E. After 2 hours, approximately 32.7% of the insulin was released from insulin/polymer, indicative of an initial burst release of insulin. Approximately 57% of the insulin was released after 3 days and approximately 70% after 5 days, indicative of biphase release profiles from insulin/polymer.
Serum level of BUN and Scr
As shown in Figure 6A and B, the serum levels of BUN and Scr in I/R group rats were higher than that in sham group rats (P<0.01). The level of BUN was 6.05±1.73 mmol in sham group rats, whereas the level of BUN reached 20.85±2.03 mmol in I/R group rats. Administration of insulin reduced the levels of BUN (17.51±2.18 mmol), whereas administration of insulin/polymer significantly reduced the levels of BUN (13.03±1.98 mmol) compared with I/R group rats (P<0.01). The level of Scr was 9.16±3.18 μmol in sham group rats, whereas the level of Scr reached 22.49±4.23 μmol in I/R group rats. Administration of insulin reduced the level of Scr (18.01±3.08 μmol), whereas administration of insulin/polymer significantly reduced the level of Scr (14.48±2.78 μmol) compared with I/R group rats (P<0.01).
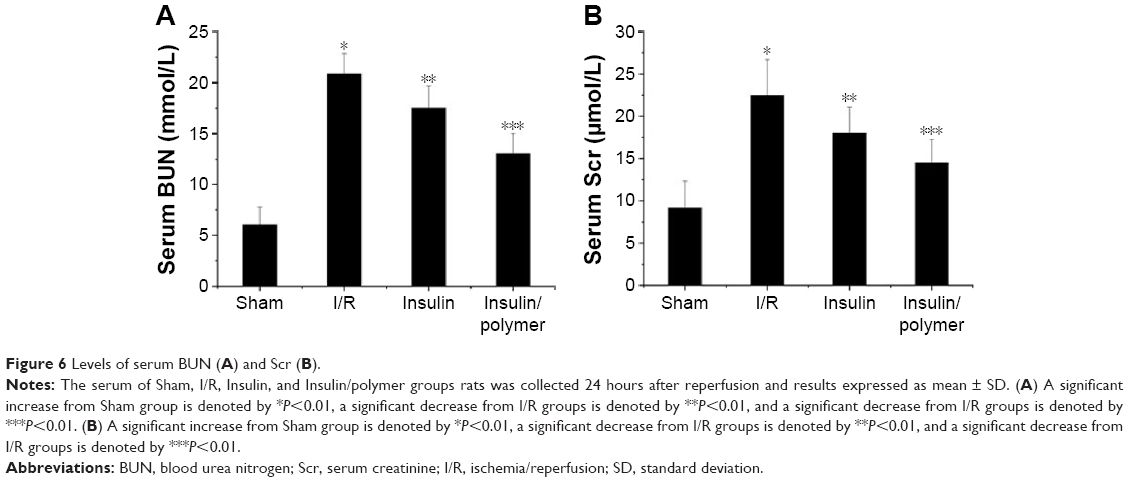 | Figure 6 Levels of serum BUN (A) and Scr (B). |
Dry/wet lung ratios
As shown in Figure 7, the dry/wet (D/W) lung ratios in I/R group rats were less than that in the sham group (P<0.01). The D/W lung ratio reached 27.5±1.08 in the sham group, whereas the D/W lung ratio in I/R group reached 16.6±0.645. Administration of insulin increased the D/W lung ratios (20.0±1.53) compared with the D/W lung ratio in I/R group rats (P<0.01), whereas administration of insulin/polymer significantly increased the D/W lung ratio (24.0±1.46), which was significantly greater than that in the I/R groups (P<0.01).
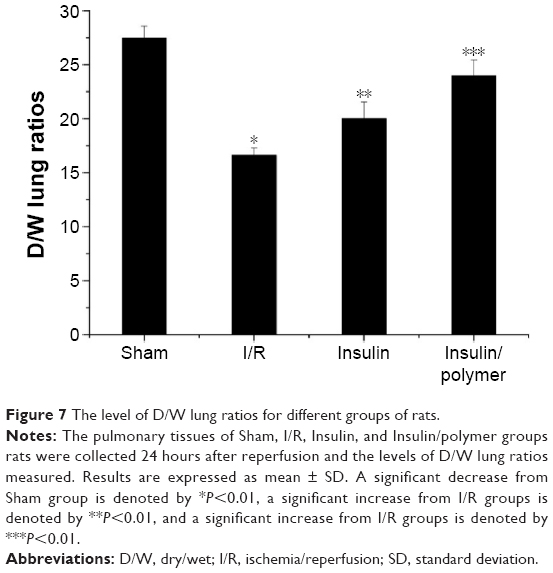 | Figure 7 The level of D/W lung ratios for different groups of rats. |
The activity of SOD and the level of MDA in pulmonary tissues
As shown in Figure 8A and B, the activity of SOD in pulmonary tissues in I/R group rats is less than that in the sham group (P<0.01). The activity of SOD in pulmonary tissues reached 130.1±2.15 U in sham group, whereas the activity of SOD in pulmonary tissues in I/R group reached 67.23±1.18 U. Administration of insulin increased the activity of SOD (83.86±2.35 U) in pulmonary tissues, compared with the activity of SOD in pulmonary tissues in the I/R group rats (P<0.01). Administration of insulin/polymer significantly increased the activity of SOD (103.1±1.79 U), which was significantly greater than that in the I/R groups (P<0.01).
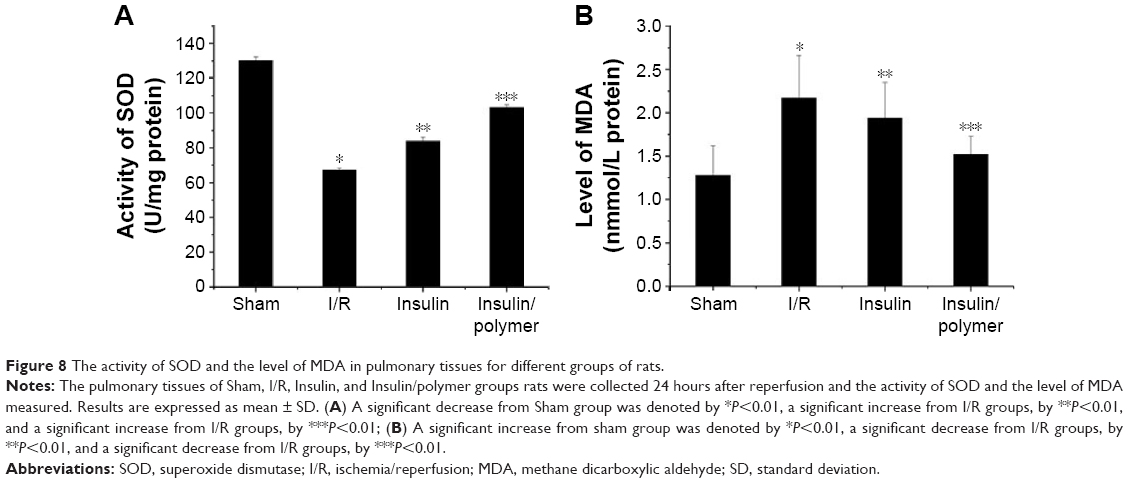 | Figure 8 The activity of SOD and the level of MDA in pulmonary tissues for different groups of rats. |
The level of MDA in pulmonary tissues in I/R group rats was higher than that in the sham group (P<0.01). The level of MDA in pulmonary tissues reached 1.28±0.34 nmol in sham group, whereas the level of MDA in pulmonary tissues in the I/R group reached 2.17±0.49 nmol. Administration of insulin reduced the level of MDA (1.94±0.41 nmol) in pulmonary tissues, compared with the level of MDA in pulmonary tissues in the I/R group rats (P<0.01). Administration of insulin/polymer significantly reduced the level of MDA (1.52±0.29 nmol), which was significantly less than that in the I/R groups (P<0.01).
The level of TNF-α and the activity of MPO in pulmonary tissues
As shown Figure 9A and B, the level of TNF-α in pulmonary tissues in I/R group rats was higher than that in the sham group (P<0.01). The level of TNF-α in pulmonary tissues reached 10.17±1.89 pg in the sham group, whereas the level of TNF-α in pulmonary tissues reached 39.15±2.35 pg in the I/R group. Administration of insulin reduced the level of TNF-α (30.65±2.09 pg) in pulmonary tissues, compared with the level of TNF-α in pulmonary tissues in the I/R group rats (P<0.01). Administration of insulin/polymer significantly reduced the level of TNF-α (26.27±2.13 pg), which was significantly less than that in the I/R groups (P<0.01).
 | Figure 9 The level of TNF-α and the activity of MPO in pulmonary tissues for different groups of rats. |
The activity of MPO in pulmonary tissues in I/R group rats was higher than that in the sham group (P<0.01). The activity of MPO in pulmonary tissues reached 8.32±2.19 U in the sham group, whereas the activity of MPO in pulmonary tissues in the I/R group reached 33.17±3.15 U. Administration of insulin decreased the activity of MPO (28.32±2.03 U) in pulmonary tissues, compared with the activity of MPO in pulmonary tissues in I/R group rats (P<0.01). Administration of insulin/polymer significantly decreased the activity of MPO (22.16±1.98 U), which was significantly less than that in the I/R groups (P<0.01).
The expression of HIF-1α and VEGF in pulmonary tissues
HIF-1α and VEGF expression in pulmonary tissues was measured by Western blot following the reported method.25,26 The results were analyzed both qualitatively and quantitatively (Figure 10). The expression of HIF-1α in pulmonary tissues in I/R groups was higher than that in the sham group (P<0.01). Administration of insulin downregulated the expression of HIF-1α in pulmonary tissues, compared with the expression of HIF-1α by I/R group (P<0.01). Administration of insulin/polymer complex significantly downregulated the expression of HIF-1α, compared with that in the I/R group (P<0.01).
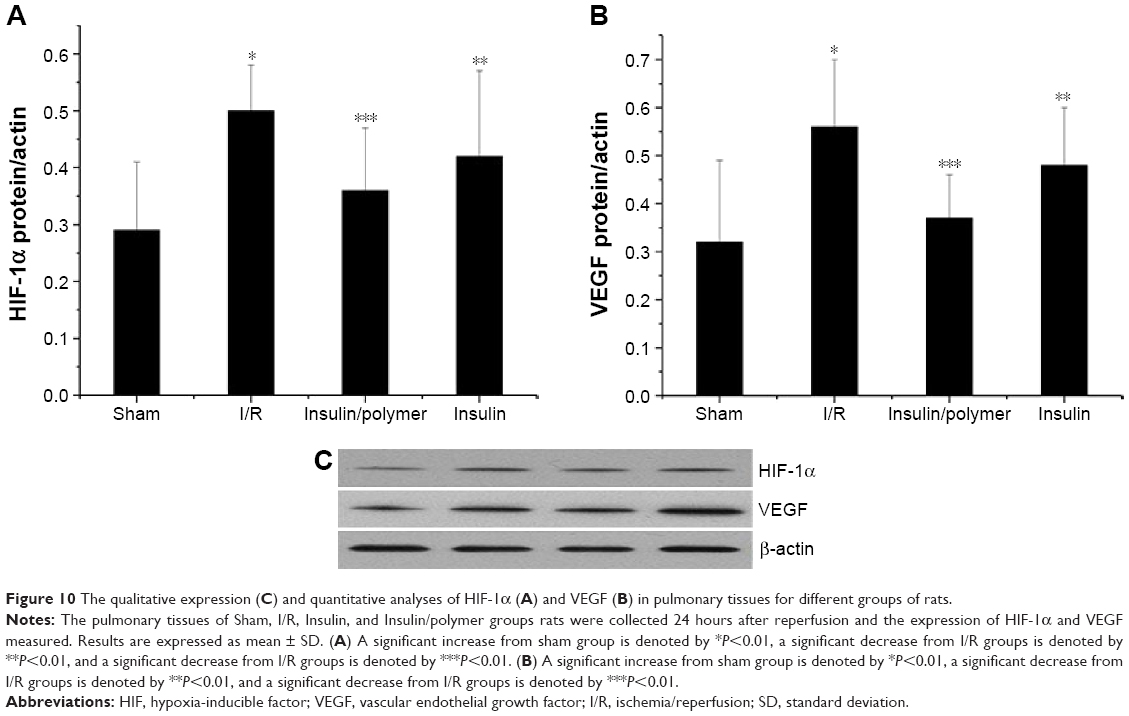 | Figure 10 The qualitative expression (C) and quantitative analyses of HIF-1α (A) and VEGF (B) in pulmonary tissues for different groups of rats. |
The expression of VEGF in pulmonary tissues in I/R groups was higher than that in the sham group (P<0.01). Administration of insulin downregulated the expression of VEGF in pulmonary tissues, compared with the expression of VEGF in the I/R group (P<0.01). Administration of insulin/polymer complex significantly downregulated the expression of VEGF, compared with that in the I/R group (P<0.01).
Discussion
This is the first study to demonstrate that insulin and insulin/PEG-b-(PELG-g-PLL) preconditioning are both capable of attenuating remote lung injury induced by renal I/R. It was found that pulmonary inflammatory response was significantly relieved after insulin and insulin/PEG-b-(PELG-g-PLL) pretreatment. This protective effect is partially downregulated with HIF, indicating that the underlying mechanism is associated with either HIF-dependent or -independent pathways. In the present study, the blood glucose levels were traced after insulin or insulin/polymer complexes were injected; it should be noted that hypoglycemia was not observed, in accordance with reported literature.27
RI/RI occurs in approximately 5% of hospitalized patients and up to 30% of patients in intensive care units.28,29 Pretreatment with insulin can reduce the injury for hospitalized patients. At present, insulin preconditioning has been used clinically in many hospitals to reduce ischemia reperfusion injury.30 Systemic inflammation following renal ischemia/reperfusion (RI/R) can progress into multiple organ damage if inflammatory response is unchecked.31 Indeed, RI/RI causes upregulation of inflammatory mediators in local and remote organs.32 The release and migration of inflammatory factors need a lot of adenosine triphosphate (ATP).33 Inflammatory cells depend principally on glycolysis for ATP generation.34–36 HIF-1α is one of the most important nuclear factors that adjusts the expression of anaerobic glycolysis key enzyme in inflammatory cells.33 The present study shows that inhibition of HIF-1α activation can reduce anaerobic glycolysis ability in inflammatory cells and ATP content in cells to weaken the adhesion, chemotaxis, and proinflammatory ability of inflammatory cells.14 Our study clearly demonstrates that RI/R rapidly leads to distant overexpression of HIF-1α and TNF-α in the lungs. Insulin and insulin/PEG-b-(PELG-g-PLL) pretreatment can reduce the expression of HIF-1α and TNF-α. In addition, TNF-α can increase lung MPO activity after acute kidney injury.37 MPO is released from neutrophils and catalyzes the formation of hypochlorous acid from hydrogen peroxide and chloride ions.37 The MPO level indirectly reflects the severity of inflammatory response.37 Our study suggests that insulin and insulin/PEG-b-(PELG-g-PLL) pretreatment can inhibit the activation of HIF-1α to reduce the activity of MPO in pulmonary tissues.
VEGF is an important vascular permeability factor.38 High expression of VEGF within the lung may contribute to the development of pulmonary edema by deteriorating the state of the adherens junction complexes on the endothelium and aggravate microcirculation disturbance and inflammatory response.33,39 Our study shows that insulin and insulin/PEG-b-(PELG-g-PLL) pretreatment can reduce the expression of VEGF through downregulating HIF-1α to decrease the inflammatory response of pulmonary tissues.
Insulin pretreatment can protect pulmonary tissue against renal ischemia/reperfusion-induced injury. However, insulin has a short half-life and its dose is difficult to control, and frequent insulin injection increases the suffering of the patient.20 In our report, block copolymer PEG-b-(PELG-g-PLL) serves as a carrier and protects insulin from rapid degradation in the body and can reinforce efficacy, and reduce dosage and side effects. In addition, PEG-b-(PELG-g-PLL) can increase the stability of insulin in circulation. This study reveals that PEG-b-(PELG-g-PLL) treatment significantly protects lung against RI/R-induced injury in rats, compared to free insulin. In summary, our current study shows that insulin and insulin/PEG-b-(PELG-g-PLL) pretreatment can provide lung protection after RI/R-induced injury through downregulating HIF, whereas insulin/PEG-b-(PELG-g-PLL) significantly improves this effect.
Conclusion
The synthesized block copolymer PEG-b-(PELG-g-PLL) can significantly improve the bioactivity of insulin. The observed protective effect can be attributed to the antioxidative stress and the modulation of HIF activation by insulin/PEG-b-(PELG-g-PLL) in rats as compared to free insulin. Administration of insulin or insulin/PEG-b-(PELG-g-PLL) demonstrated protective effect against RI/R-induced pulmonary injury through improving renal function and decreasing the level of MDA, TNF-α, the activity of MPO, downregulating the expression of HIF-1α and VEGF, and increasing the activity of SOD, while significantly improving the protective effect. More detailed studies are required to explore the underlying mechanism of insulin/PEG-b-(PELG-g-PLL) on RI/R-induced pulmonary injury in rats.
Acknowledgments
This work was financially supported by the National Natural Science Foundation of China (50973058) and the Department of Education, Guangdong Government under the Top-tier University Development Scheme for Research and Control of Infectious Diseases.
Author contributions
All authors contributed toward data analysis, drafting and critically revising the paper, gave final approval of the version to be published, and agree to be accountable for all aspects of the work.
Disclosure
The authors report no conflicts of interest in this work.
References
Jones DR, Lee HT. Perioperative renal protection. Best Pract Res Clin Anaesthesiol. 2008;22:193–208. | ||
Bove T, Calabrò MG, Landoni G, et al. The incidence and risk of acute renal failure after cardiac surgery. J Cardiothorac Vasc Anesth. 2004;18:442–445. | ||
Faubel S. Pulmonary complications after acute kidney injury. Adv Chronic Kidney Dis. 2008;15:284–296. | ||
Bagshaw SM, Laupland KB, Doig CJ, et al. Prognosis for long-term survival and renal recovery in critically ill patients with severe acute renal failure: a population-based study. Crit Care. 2005;9:R700–R709. | ||
Burne-Taney MJ, Rabb H. The role of adhesion molecules and T cells in ischemic renal injury. Curr Opin Nephrol Hypertens. 2003;12:85–90. | ||
Rabb H. Immune modulation of acute kidney injury. J Am Soc Nephrol. 2006;17:604–606. | ||
Donnahoo KK, Meldrum DR, Shenkar R, Chung CS, Abraham E, Harken AH. Early renal ischemia, with or without reperfusion, activates NF-κB and increases TNF-α bioactivity in the kidney. J Urol. 2000;163:1328–1332. | ||
Donnahoo KK, Meng X, Ayala A, Cain MP, Harken AH, Meldrum DR. Early kidney TNF-α expression mediates neutrophil infiltration and injury after renal ischemia-reperfusion. Am J Physiol. 1999;277:R922–R929. | ||
Oztay F, Kara-Kisla B, Orhan N, Yanardag R, Bolkent S. The protective effects of prostaglandin E1 on lung injury following renal ischemia-reperfusion in rats. Toxicol Ind Health. Epub April 16, 2015. | ||
Liu KD, Altmann C, Smits G, et al. Serum interleukin-6 and interleukin-8 are early biomarkers of acute kidney injury and predict prolonged mechanical ventilation in children undergoing cardiac surgery: a case control study. Crit Care. 2009;13:R104. | ||
Jaakkola P, Mole DR, Tian YM, et al. Targeting of HIF-α to the von Hippel-Lindau ubiquitylation complex by O2 regulated prolyl hydroxylation. Science. 2001;292:468–472. | ||
Wang GL, Jiang BH, Rue EA, Semenza GL. Hypoxia-inducible factor 1 is a basic-helix-loop-helix-PAS heterodimer regulated by cellular O2 tension. Proc Natl Acad Sci U S A. 1995;92:5510–5514. | ||
Semenza GL. Hypoxia-inducible factor 1: control of oxygen homeostasis in health and disease. Pediatr Res. 2001;49:614–617. | ||
Cramer T, Yamanishi Y, Clausen BE, et al. HIF-1α is essential for myeloid cell-mediated inflammation. Cell. 2003;112(5):645–657. | ||
Maxwell PH, Wiesener MS, Chang GW, et al. The tumor suppressor protein VHL targets hypoxia-inducible factors for oxygen-dependent proteolysis. Nature. 1999;399:271–275. | ||
Burke B, Tang N, Corke KP, et al. Expression of HIF-1α by human macrophages: implications for the use of macrophages in hypoxia-regulated cancer gene therapy. J Pathol. 2002;196:204–212. | ||
Hollander AP, Corke KP, Freemont AJ, Lewis CE. Expression of hypoxia-inducible factor 1α by macrophages in the rheumatoid synovium: implications for targeting of therapeutic genes to the inflamed joint. Arthritis Rheum. 2001;44:1540–1544. | ||
Talks KL, Turley H, Gatter KC, et al. The expression and distribution of the hypoxia-inducible factors HIF-1α and HIF-2α in normal human tissues, cancers, and tumor-associated macrophages. Am J Pathol. 2000;157:411–421. | ||
Melin J, Hellberg O, Larsson E, Zezina L, Fellstrom BC. Protective effect of insulin on ischemia renal injury in diabetes mellitus. Kidney Int. 2002;61:1383–1392. | ||
Ince BW. Plasma clearance kinetics of unlabeled bovine insulin in rainbow trout (Salmo gairdneri). Gen Comp Endocrinol. 1982;46:463–472. | ||
Li Z, Wang Y. Effect of NADPH oxidase inhibitor-apocynin on the expression of Src homology-2 domain-containing phosphatase-1 (SHP-1) exposed renal ischemia/reperfusion injury in rats. Toxicology Rep. 2015;2:1111–1116. | ||
Jiang Y, Zhou Z, Meng QT, et al. Ginsenoside Rb1 treatment attenuates pulmonary inflammatory cytokine release and tissue injury following intestinal ischemia reperfusion injury in mice. Oxid Med Cell Longev. 2015;2015:843721. | ||
Fiorentini MR, Santos EB, Longo L, Kliemann LM, Koff WJ, Corso CO. Analysis of the effects of topical renal hypothermia on lung tissue after kidney ischemia and reperfusion in rats. Acta Cir Bras. 2015;30:445–451. | ||
Bradley PP, Priebat DA, Christensen RD, Rothstein G. Measurement of cutaneous inflammation: estimation of neutrophil content with an enzyme marker. J Invest Dermatol. 1982;78:206–209. | ||
Zhao H, Huang H, Ologunde R, et al. Xenon treatment protects against remote lung injury after kidney transplantation in rats. Anesthesiology. 2015;122:1312–1326. | ||
Mura M, Han B, Andrade CF, et al. The early responses of VEGF and its receptors during acute lung injury: implication of VEGF in alveolar epithelial cell survival. Crit Care. 2006;10:R130. | ||
He T, Li R, Gan L, Yang Y, Liu J, Chen M. [Study on the insulin and insulin receptor in the progression of renal ischemic and reperfusion]. J Sichuan Univ (Med Sci Edi). 2003;34:660–662. Chinese. | ||
Star RA. Treatment of acute renal failure. Kidney Int. 1998;54:1817–1831. | ||
Requião-Moura LR, Durão Junior Mde S, Matos AC, Pacheco-Silva A. Ischemia and reperfusion injury in renal transplantation: hemodynamic and immunological paradigms. Einstein (Sao Paulo). 2015;13:129–135. | ||
Garcia-Dorado D, Rodríguez-Sinovas A, Ruiz-Meana M, Inserte J. Protection against myocardial ischemia-reperfusion injury in clinical practice. Rev Esp Cardiol (Engl Ed). 2014;67:394–404. | ||
Carden DL, Granger DN. Pathophysiology of ischaemia reperfusion injury. J Pathol. 2000;90:255–266. | ||
Grigoryev DN, Liu M, Hassoun HT, Cheadle C, Barnes KC, Rabb H. The local and systemic inflammatory transcriptome after acute kidney injury. J Am Soc Nephrol. 2008;19:547–558. | ||
Bai XW, Sun B, Wang F, et al. [The effect of hyperbaric oxygen on acute pancreatitis through downregulating hypoxia-inducible factor]. Chin J Surg. 2009;47:1459–1463. Chinese. | ||
Kempner W. The nature of leukemic blood cells as determined by their metabolism. J Clin Invest. 1939;18:291–300. | ||
Levene PA, Meyer GM. The action of leucocytes on glucose. J Biol Chem. 1912;11:361–370. | ||
Levene PA, Meyer GM. On the action of leucocytes on glucose, second communication. J Biol Chem. 1912;12:265–273. | ||
Gu J, Chen J, Xia P, Tao G, Zhao H, Ma D. Dexmedetomidine attenuates remote lung injury induced by renal ischemia-reperfusion in mice. Acta Anaesthesiol Scand. 2011;55:1272–1278. | ||
Senger DR, Galli SJ, Dvorak AM, Perruzzi CA, Harvey VS, Dvorak HF. Tumor cells secrete a vascular permeability factor that promotes accumulation of ascites fluid. Science. 1983;219:983–985. | ||
Gamble JR, Drew J, Trezise L, et al. Angiopoietin-1 is an antipermeability and anti-inflammatory agent in vitro and targets cell junctions. Circ Res. 2000;87:603–607. |
Supplementary materials
Materials
Amino polyethylene glycol monomethyl ether (PEG-NH2, molecular weight =5 kDa), 2-hydroxypyridine, trifluoroacetic acid, dimethyl formamide (DMF), ethylacetate, and petroleumether were purchased from Aladdin (Shanghai, People’s Republic of China); Bis(trichlormethyl)carbonate, ethylenediamine, and hydrogen bromide/acetic acid solution (HBr/CH3COOH, 33%) were purchased from Alfa (Tian, People’s Republic of China); γ-benzyl L-glutamate (BLG) and ε-benzyoxycarbonyl–L-lysine (ZLL) were purchased from Shanghai Jill biochemical co., LTD, (Shanghai, People’s Republic of China). Regenerated cellulose membrane tubing (molecular weight cut-off [MWCO], 3.5 kDa, 7 kDa) were purchased from Union Cardibide Company (Danbury, CT, USA); Insulin and other reagent are from Sigma-Aldrich (St Louis, MO, USA).
Methods
Synthesis of poly(ethylene glycol)-b-(poly(ethylenediamine L-glutamate)-g-poly(L-lysine)) (PEG-b-(PELG-g-PLL)
PEG-b-(PELG-g-PLL) was synthesized in the following method: PEG-b-PBLG was prepared by the ring-opening polymerization of BLG-N-carboxyanhydride (NCA) with PEG-NH2 as the macroinitiator, followed by aminolysis with ethanediamine to obtain PEG-b-PELG. PEG-b-PELG was used as the macroinitiator to initiate the ring-opening polymerization of ZLL-NCA to prepare PEG-b-(PELG-g-PZLL). The benzyl groups of poly(ε-benzyloxycarbonyl-L-lysine) were then deprotected in the presence of HBr to obtain the final product, PEG-b-(PELG-g-PLL), as depicted in Figure 2.
First, BLG-NCA was synthesized by the phosgenation of BLG in anhydrous ethyl acetate, following the reported method of Hideharu et al1 and characterized by 1H nuclear magnetic resonance (NMR). BLG-NCA was polymerized in DMF using PEG-NH2 as the macroinitiator. The proper amounts of PEG-NH2 in 10 mL of DMF were added to a corresponding amount of BLG-NCA/DMF solution (0.1 g/mL) by vacuumizing and N2 protection. The reaction mixture was stirred at 40°C for 3 days and dialyzed for 3 days (MWCO, 7 kDa). The PEG-b-PBLG polymer was obtained by freeze drying, and the degree of polymerization of PBLG was 50, and characterized by 1H NMR, gel permeation chromatography (GPC) and Fourier transform infrared spectroscopy (FT-IR).
The proper amounts of PEG-b-PBLG in DMF (0.1 g/3.5 mL) were mixed with five times the amount of 2-hydroxypyridine, and 20 times the amount of ethylenediamine was added by vacuumizing and N2 protection. The reaction mixture was stirred at 40°C for 2 days and then 10% acetic acid solution was slowly added and stirred for 3 hours while immersed in an ice bath, then dialyzed for 3 days (MWCO, 3.5 kDa). The PEG-b-PELG was obtained by freeze drying, and characterized by 1H NMR, GPC and FT-IR.
ZLL-NCA was synthesized by the phosgenation of ZLL in anhydrous ethyl acetate following previously reported methods2,3 and characterized by 1H NMR. The proper amounts of PEG-b-PELG in DMF (0.1 g/3.5 mL) were mixed with a corresponding amount of ZLL-NCA/DMF solution (0.1 g/mL) by vacuumizing and N2 protection. The reaction mixture was stirred at 40°C for 3 days and dialyzed for 3 days (MWCO, 7 kDa). The PEG-b-(PELG-g-PZLL) was obtained by freeze drying, and the degree of polymerization of PZLL was 3, and characterized by 1H NMR, GPC and FT-IR.
Deprotection of the benzyl groups in PEG-b-(PELG-g-PZLL) was performed following the reported method.4 The proper amounts of PEG-b-(PELG-g-PZLL) were mixed for a short duration with the corresponding amount of CF3COOH and HBr/CH3COOH was slowly added and allowed to react for 1 hour. The product was isolated by precipitation in diethyl ether and filtration, followed by neutralization with NaHCO3 aqueous solution. The solution was dialyzed for 5 days (MWCO, 3.5 kDa) and the PEG-b-(PELG50-g-PLL3) polymer was obtained by freeze drying, and was characterized by 1H NMR, GPC and FT-IR.
Cytotoxicity assay of polymers
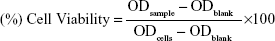
EC9706 cells were used to assess biomaterial cytotoxicity.5 We used the 3-(4,5-dimethylthiazol-2-yl)-2,5-diphenyltetrazolium bromide (MTT) colorimetric assay, as described by Mosmann.6 The cells were cultured in a 96-well plate with 5×10³ cells per well. Twenty-four hours after cell incubation, the original medium was removed and MTT solution was added to each well. Only, the cells that adhered to the well walls were incubated with MTT for 24 hours at 37°C. During incubation, the MTT was reduced by mitochondrial succinic dehydrogenase enzymes within the viable cells, precipitating the insoluble formazan crystals. After removal of the minimal essential medium, an ethanol–dimethyl sulfoxide solution (1:1) was added to each well. After complete solubilization of the dark blue crystals of MTT formazan (20 minutes), the absorbance of the content of each well was measured at 570 nm on a multimode reader. The blank reference was taken from wells without cells, which were also incubated with the MTT solution. Polymers were used as a positive cytotoxicity control. Cells cultivated on the wells were used as a negative cytotoxicity control. Values were expressed as optical density (OD). Data were subtracted from the blank ethanol-dimethyl sulfoxide absorbance, and presented as a percentage relative to control as is seen in equation 1:
|
|
Encapsulation of insulin by PEG-b-(PELG-g-PLL)
To evaluate the encapsulation of insulin by PEG-b-(PELG-g-PLL), a given volume of fluorescein isothiocyanate (FITC)-labelled insulin (2 mg/mL) in phosphate buffer at 0.01 mmol/L (pH 7.2) was added to PEG-b-(PELG-g-PLL) in a phosphate buffer. After 30 minutes, the mixed solution was transferred to dialysis tubing (MWCO, 100 kDa) and dialyzed against a 0.1 mol/L phosphate buffer under sink conditions. The dialysis of free FITC-labelled insulin in phosphate buffer was also conducted under the same conditions as the control. When the free FITC-labelled insulin in the control experiment were completely removed, the polymer-encapsulated FITC-labelled insulin was determined by an ultraviolet fluorescence scanning enzyme standard instrument, and characterized by a nanoparticle size analyzer, transmission electron microscopy and FT-IR. All of the experiments were carried out in duplicate.
In vitro release of insulin from PEG-b-(PELG-g-PLL)
The release of insulin from the PEG-b-(PELG-g-PLL) was investigated using a dialysis method (MWCO, 100 kDa) at room temperature with 6 mL of FITC-labelled insulin-loaded polymer against 80 mL of 0.02 mol/L phosphate buffer (pH 7.4). At 0.5, 1, 2, 3, 6, 12, 24, 48, 72, 96, and 120 hour time intervals, a given volume of release medium was withdrawn and replenished with an equal volume of fresh release medium. The amounts of released FITC-labelled insulin and FITC-labelled insulin remaining in the dialysis tube were determined by an ultraviolet fluorescence scanning enzyme standard instrument. The release of free FITC-labelled insulin in the absence of polymer was also performed as a control. All of the experiments were conducted in duplicate.
References
Hideharu M, Mizuki I, Satoko I, Takeshi E. Ring-opening polymerization of γ-benzyl-L-glutamate-N-carboxyanhydride in ionic liquids. Polymer. 2007;48(20):5867–5877. | ||
Poché DS, Moore MJ, Bowles JL. An unconventional method for purifying the Ncarboxyanhydride derivatives of γ-alkyl-L-glutamates. Synth Commun. 1999;29(5):843–854. | ||
Zhuang W, Liao L, Chen H, Wang J, Pan Y, Zhang L, et al. Water-soluble star-block copolypeptides: towards biodegradable nanocarriers for versatile and simultaneous encapsulation. Macromol Rapid Commun. 2009;30:920–924. | ||
Harada A, Kataoka K. Formation of polyion complex micelles in an aqueous milieu from a pair of oppositely-charged block copolymers with poly(ethylene glycol) segments. Macromolecules. 1995;28(15):5294–5299. | ||
Wu M, Ye Z, Liu Y, Liu B, Zhao X. Release of hydrophobic anticancer drug from a newly designed self-assembling peptide. Mol Biosyst. 2011;7(6):2040–2047. | ||
Mosmann T. Rapid colorimetric assay for cellular growth and survival: application to proliferation and cytotoxicity assays. J Immunol Methods. 1983;65(1–2):55–63. |
 © 2016 The Author(s). This work is published and licensed by Dove Medical Press Limited. The
full terms of this license are available at https://www.dovepress.com/terms
and incorporate the Creative Commons Attribution
- Non Commercial (unported, 3.0) License.
By accessing the work you hereby accept the Terms. Non-commercial uses of the work are permitted
without any further permission from Dove Medical Press Limited, provided the work is properly
attributed. For permission for commercial use of this work, please see paragraphs 4.2 and 5 of our Terms.
© 2016 The Author(s). This work is published and licensed by Dove Medical Press Limited. The
full terms of this license are available at https://www.dovepress.com/terms
and incorporate the Creative Commons Attribution
- Non Commercial (unported, 3.0) License.
By accessing the work you hereby accept the Terms. Non-commercial uses of the work are permitted
without any further permission from Dove Medical Press Limited, provided the work is properly
attributed. For permission for commercial use of this work, please see paragraphs 4.2 and 5 of our Terms.