Back to Journals » Nanotechnology, Science and Applications » Volume 10
The effect of composition and thermodynamics on the surface morphology of durable superhydrophobic polymer coatings
Authors Nahum T, Dodiuk H ![]() , Kenig S, Panwar A, Barry C, Mead J
, Kenig S, Panwar A, Barry C, Mead J ![]()
Received 29 September 2016
Accepted for publication 17 November 2016
Published 15 February 2017 Volume 2017:10 Pages 53—68
DOI https://doi.org/10.2147/NSA.S123447
Checked for plagiarism Yes
Review by Single anonymous peer review
Peer reviewer comments 3
Editor who approved publication: Professor Israel Rubinstein
Tehila Nahum,1 Hanna Dodiuk,2 Samuel Kenig,2 Artee Panwar,1 Carol Barry,1 Joey Mead,1
1Department of Plastics Engineering, University of Massachusetts Lowell, Lowell, MA, USA; 2Department of Polymers and Plastics Engineering, Shenkar College of Engineering Design and Art, Ramat Gan, Israel
Abstract: Durable superhydrophobic coatings were synthesized using a system of silica nanoparticles (NPs) to provide nanoscale roughness, fluorosilane to give hydrophobic chemistry, and three different polymer binders: urethane acrylate, ethyl 2-cyanoacrylate, and epoxy. Coatings composed of different binders incorporating NPs in various concentrations exhibited different superhydrophobic attributes when applied on polycarbonate (PC) and glass substrates and as a function of coating composition. It was found that the substrate surface characteristics and wettability affected the superhydrophobic characteristics of the coatings. Interfacial tension and spreading coefficient parameters (thermodynamics) of the coating components were used to predict the localization of the NPs for the different binders’ concentrations. The thermodynamic analysis of the NPs localization was in good agreement with the experimental observations. On the basis of the thermodynamic analysis and the experimental scanning electron microscopy, X-ray photoelectron spectroscopy, profilometry, and atomic force microscopy results, it was concluded that localization of the NPs on the surface was critical to provide the necessary roughness and resulting superhydrophobicity. The durability evaluated by tape testing of the epoxy formulations was the best on both glass and PC. Several coating compositions retained their superhydrophobicity after the tape test. In summary, it was concluded that thermodynamic analysis is a powerful tool to predict the roughness of the coating due to the location of NPs on the surface, and hence can be used in the design of superhydrophobic coatings.
Keywords: superhydrophobic coating, durability, thermodynamics, silica nanoparticles, morphology
Introduction
Superhydrophobic surfaces have been studied for a variety of applications, such as self-cleaning,1,2 anticorrosion,3 antipollution,4 oil/water separation,5,6 self-healing,7 anti-fouling,8 and ice repellant surfaces.7,9–12 Superhydrophobic surfaces have static contact angles >150° and sliding angles <10°, allowing easy rolling of water droplets along the surface.
The two key parameters for superhydrophobicity include hydrophobic chemistry and a nano/micro-hierarchical surface structure. Hydrophobic chemistry can be imparted by different low surface energy materials, such as fluorinated and long alkyl chain compounds.13 A self-assembled monolayer of alkyltrichlorosilane (ATS) was shown to modify the surface energy of W18O49 nanowire substrates by changing the carbon length of ATS. Results showed an increase in contact angle with increasing the number of carbons in ATS.14 The wettability of a zinc oxide nanowire array was monotonically changed from hydrophilic to hydrophobic by increasing the carbon chain length of a chemisorbed fatty acid (FA).15 A self-assembling film of fatty acids with different carbon chain lengths on hydroxyapatite discs surfaces showed that contact angles increased significantly with increases in the FA carbon chain length.16 Additionally, a hierarchical structure composed of nanoscale texture on microscale texture is needed to obtain superhydrophobic characteristics. The rough structure can support a liquid droplet, in the Cassie–Baxter state, and display high contact angles as air is trapped between the rough asperities. Such roughness may also provide lower sliding angles as the small contact area leads to reduced drop pinning (lower resistance to droplet movement). Roughness can reduce the apparent surface free energy (SFE) of the superhydrophobic surface due to the reduced contact area between the liquid drop and the surface.17 This roughness can enhance the ability of superhydrophobic surfaces to repel low surface tension liquids, such as oils.
In order to prepare superhydrophobic surfaces, a variety of materials and techniques have been used including top-down methods, such as lithography18–21 and plasma etching,22 and bottom-up methods using different nanoparticles (NPs), such as silica,23–25 silica/polyhedral oligomeric silsesquioxane,26 functionalized aluminum oxide NPs,27,28 titania,29,30 carbon nanotubes,31–34 ZnO particles,8,35–37 and silanized calcium carbonate.38–41 Regardless of the technique or the substrates used, each method provided micro/nanometer features for roughness and a low surface energy chemistry.
Although superhydrophobic surfaces have been studied previously, their applications are limited due to their high production costs and low abrasion resistance.26,30 A particularly attractive approach is a coating, which can be applied to a wide variety of surfaces. It should be mentioned that, in many studies, the coatings are limited to specific substrates due to the specific composition and/or preparation techniques involved.42–48 The interactions between the surface/substrate and the coating as well as between the binder/NPs affect the structure of the coating and any resultant hierarchical structure needed to create superhydrophobicity in addition to the coatings’ durability. Thus, a fundamental study of these parameters is necessary to understand the effect of the substrate and coating properties for preparing new coatings on a wide array of substrates in the future.
Another key attribute is durability, such that the surface retains its superhydrophobic characteristics, despite abrasion or wear. A previous study22 indicated that a stable superhydrophobic urethane acrylate (UA) coating was obtained using silica NPs of various diameters grafted with photoreactive benzophenone groups and methylated fumed silica NPs with a fluorosilane top layer. The coatings showed good abrasion resistance under air flow and good durability in accelerated weathering conditions. Consequently, this work is aimed at investigating the thermodynamics of the system based on the interfacial tension and spreading coefficient parameters. Hence, the effects of binder type, binder concentration, and substrate wetting properties on the coating properties and morphology were studied. Two substrates, polycarbonate (PC; hydrophobic) and glass (hydrophilic), coated with a variety of formulations incorporating hydrophobic silica NPs dispersed in three different binders, ethyl cyanoacrylate (ECA), epoxy, and urethane acrylate (UA), were studied for the formation of superhydrophobic coatings having good durability. In the present case where low viscosity binders have been used, the mixing and coating processes are thermodynamically driven and kinetics do not play a role in the thermodynamics that lead to localization of the NPs.
Methods
Three different binders and five different binders to silica ratios were studied. Each formulation was spin coated on glass and PC, respectively. A total of 30 formulations were investigated. The thermodynamics analysis was composed of several steps. In the first step, the surface tension of neat and diluted uncured binders was calculated to analyze the solvent effect on the surface tension. In the second step, the effect of the dispersed NPs on the interfacial tension between the dissolved binders and the dispersed NPs was analyzed using two different methods. In the third step, the interfacial tensions were used to calculate the spreading coefficients in the mixing stage to analyze the mixing process of the dissolved binders and dispersed NPs. In the fourth step, the spreading coefficient in the coating step was studied to determine the final localization of the NPs. Finally, the substrates’ wetting by the binder was addressed by comparing the interfacial tension between the solvent and substrate and the interfacial tension between the diluted uncured binders and the substrate. To support the thermodynamic analysis, the topography of all the 30 coatings was studied using scanning electron microscopy (SEM). Finally, the wetting characteristics of the cured solid samples were studied using contact angle and sliding angle measurements. Since superhydrophobicity is obtained by low surface energy (attributed to chemistry and roughness), the SFEs of the coatings were compared to the neat cured binders. In the last stage of the study, durability was evaluated using a tape test.
Materials and methods
Fumed silica NPs (CAB-O-SIL® TS-720; Cabot Corporation, Billerica, MA, USA) were used throughout the study. The particles were mixed with a fluoroalkylsilane (FAS) (Dynasylan® F8263; Evonik, Essen, Germany) in isopropyl alcohol (IPA). The fluoroalkyl functionality provides low surface energy. The average particle (aggregate) diameter was 0.2–0.3 µm.
Three binders were used: ECA resin (Loctite® Super Glue; Henkel Corporation, Seabrook, NH, USA), a two component epoxy (EPO-TEK® 301; Epoxy Technologies, Billerica, MA, USA), and a one-part ultraviolet (UV) curing UA resin (NOA 61; Norland Products Incorporated, Cranbury, NJ, USA). The carrier solvent for the coating was acetone (Sigma Aldrich, St Louis, MO, USA). The physical properties of the binders obtained from their safety data sheets are shown in Table 1.
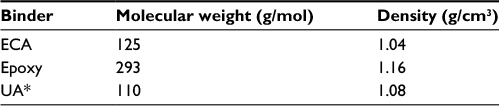 | Table 1 Physical properties of the binders Note: *Based on Sigma-Aldrich value for a mercaptoester monomer. Abbreviations: ECA, ethyl cyanoacrylate; UA, urethane acrylate. |
The silica NPs (constant concentration of 2.5 wt%) were dispersed in the fluoroalkylsilane solution (in IPA) and stirred at room temperature for 10 minutes. Each binder was dissolved in acetone and stirred for 10 minutes at room temperature. Then, the two solutions were mixed together and stirred for another 10 minutes. For each formulation, the binder concentration ranged from 5 to 25 wt%. A total of 15 formulations were prepared.
Coating preparation
Glass microscope slides and PC sheet cut to 2.54 cm × 2.54 cm squares served as substrates for the coating. The substrates were rinsed with ethanol and dried under air pressure. One milliliter of solution was spin coated on the substrate at 1250 rpm for 1 minute. ECA and epoxy formulations were cured at 110°C for 2 hours. UA was cured under UV radiation for 2 minutes. A medium pressure mercury lamp (Heraeus Noblelight America LLC; Heraus, Gaithersburg, MD, USA) with a 365 nm wavelength at 100% intensity was used for the UV curing.
Characterization
The contact angle (CA) was measured according to the sessile drop method using a commercial video-based, software-controlled, contact angle analyzer (DSA 100; KRUSS GmbH, Hamburg, Germany). Deionized water was used for the measurements. The sliding angle was measured using a tilting unit incorporated into the contact angle analyzer. A drop was first deposited on the horizontal substrate and after equilibrium the substrate plane was tilted until the onset of drop motion. Both contact and sliding angles were measured using a 5 µL water drop. The surface tension of the diluted binders and dispersed silica NPs were calculated using the pendant drop method. The surface tension of the hanging liquid drop in air was determined using the Young–Laplace method taking into consideration the characteristic drop shape under the influence of gravity. The SFEs of the superhydrophobic surfaces were determined using Zisman’s method,49 which determines the critical surface tension (γc). To obtain the γc value, the contact angles of nonpolar liquids having progressively smaller surface tensions were measured. In the current work, diiodomethane, n-hexadecane, and n-octane with surface tensions of 50.8, 27.47, and 21.62 mN/m (from DSA-100 software database), respectively, were used. The surface tensions of these liquids were correlated with the contact angles (cosine of the angle), yielding approximately straight lines. Extrapolation to cosθ=1 yielded the value of γc. Combining Young’s Equation for the contact angle and Zisman’s method lead to the relationship between γc and γs – the surface tension of the surface, as follows:
|
|
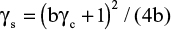
where b is the tangent of the γc measurements.
For superhydrophobic surfaces with very low SFE (insignificant polar interactions), Zisman’s method is commonly used because only dispersion interactions are considered. For the neat binders and the PC substrate, which have polar contributions, the SFE was measured using the Lifshitz–van der Waals/acid–base (LW/AB) method. In the LW/AB method, the SFE is assumed to be composed of two main contributions, a nonpolar component  and acid–base component
  , where the acid–base component is, in turn, composed of electron donor
  and electron acceptor
  components. The total SFE is given by
|
|

To obtain  ,
, and
and  values for a solid, it is necessary to measure the contact angles of three different liquids of which at least two must be polar. In the present work, water and formamide (Thermo Fisher Scientific, Waltham, MA, USA) were used as the polar liquids and diiodomethane was the nonpolar liquid.
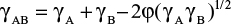
The interfacial tension between the different components in the solution state was calculated using two methods, Antonoff’s rule for immiscible systems:
|
|

and the Girifalco and Good method50 for miscible systems:
|
|
where γA and γB are the interfacial tension of the binder (neat or diluted) and the dispersed NPs, respectively. The molar volume (ϕ) is given by
|
|
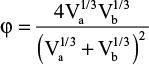
where Va is the molar volume of component A and Vb is the molar volume of component B. The Girifalco and Good method is valid for substances interacting with dispersive forces. In the present system based on hydrophobic chemistry, polar interactions are insignificant.
The spreading coefficient (SAB) that determines whether liquid B will spread on liquid A or solid A was calculated using
|
|

When SAB>0, spontaneous spreading will occur, leading to a reduction in the SFE; however, when SAB<0, no or partial spreading will occur.
SEM was used to investigate the surface morphology. An field emission SEM (FESEM) (JEOL JSM 7401F) at 10 kV accelerating voltage was employed for this work. Prior to imaging, all substrates were sputtered with gold for 180 seconds (Leica SCD500).
X-ray photoelectron spectrometry (XPS) was used for chemical analysis (VG Scientific ESCALAB MKII). XPS provides information regarding the chemical composition in the top few atomic layers (down to 100Å).
The adhesion of the coatings to the substrates was determined using the tape test (ASTM D3359). A sharp razor blade was used to create 1 mm2 cuts through the coating to the substrate. The center of the tape was placed over the coating and adhered under the pressure of a pencil eraser to ensure good contact of the tape. Then, the tape was removed rapidly as close as possible to180°.
Results and discussion
Thermodynamic analysis
For this study, hydrophobic silica NPs and three low-molecular-weight binders ECA, epoxy, and UA were used. As the presence of the NPs on the surface is critical to obtain nanoscale roughness and thus superhydrophobic surfaces, the thermodynamics in the liquid state of the different formulations was investigated to explain the localization of the NPs in different binder formulations. In an ideal emulsion having low molecular weight and hence low viscosity, the localization at equilibrium of the silica particles is governed by thermodynamics, as kinetic effects do not play a significant role.51,52 Thus, in this system (dispersed NPs in diluted binders) the localization of the NPs will be thermodynamically driven to its lowest energy state. Consequently, provided that an interaction between the dispersed NPs in diluted binder will reduce the total free energy of the system, better spreading will be achieved and favor the location of the NPs in the binder phase. If the interaction between the dispersed NPs in diluted binder will increase the total free energy of the system, spreading will not occur and will favor the location of the NPs on the binder surface. To investigate the localization of the NPs as a result of spreading considerations, the surface tensions of the neat and diluted binders (uncured) were measured using the pendant drop method and are shown in Tables 1 and S1. In the case of neat ECA, the surface tension was difficult to measure due to its rapid polymerization in humidity, and thus, was assumed to be 26.67 mN/m using the trend line extrapolation (Table S1).
The results in Table S1 indicate that the surface tensions of the diluted binders are lower compared to the neat ones. No significant change in surface tension, however, was observed with increasing acetone concentration from 50 to 90 wt%.
Addition of the dispersed NPs into the diluted binders is a critical step to insure good mixing and compatibility between the NPs and the binder. If the addition is thermodynamically favored, then NPs will be mixed spontaneously; however, if mixing is not thermodynamically favored, then NPs will not distribute well and remain on the surface of the binder. In this system (containing a binder polymer, NPs, and two solvents), the interfacial tension (γAB) between the dissolved or neat binders (γA) and the dispersed NPs (γB) was calculated and compared using both Antonoff’s rule (immiscible system) and the Girifalco and Good method (miscible system with dispersion attraction). The results are shown in Table 2. The average surface tension for the dispersed NPs in IPA was 21.45 mN/m using the pendant drop measurement.
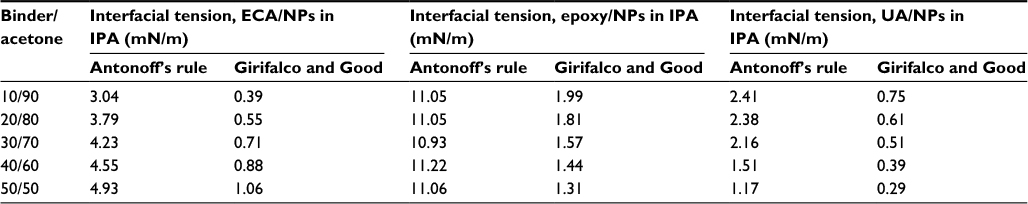 | Table 2 Interfacial tensions calculated using Antonoff and Girifalco and Good methods for binders and dispersed NPs Abbreviations: ECA, ethyl cyanoacrylate; IPA, isopropyl alcohol; NPs, nanoparticles; UA, urethane acrylate. |
Both Antonoff’s rule and the Girifalco and Good method showed a decrease in interfacial tension (IFT) for the diluted binder as compared to the neat binder. However, the Girifalco and Good method exhibited lower interfacial tension values compared to Antonoff’s rule, probably because acetone and IPA are miscible with each other. Comparison of the interfacial tension between the different binders showed that UA system exhibited the lowest interfacial tension values, whereas epoxy possessed the highest interfacial tension values. The interfacial tension values, however, do not reflect the full energy balance of the system. If the system (binder and solvent) is at a high free energy state (high surface tension) and the addition of a second component will decrease the total free energy of the system, it will favor spontaneous spreading. In contrast, if the system (binder and solvent) is at low free energy state (low surface tension), and the addition of second component will increase the total free energy of the system, the addition of the second component is not favored. To quantify the spreading phenomenon, the spreading coefficient parameters were determined. Accordingly, if the surface tension of component A is greater than the sum of surface tension of component B and interfacial tension AB, then the spreading coefficient is positive and the total free energy will be reduced, resulting in spontaneous spreading. If the surface tension of component A is lower than the sum of surface tension of component B and interfacial tension AB, then spreading is negative since the total free energy of the system is increased and partial or no spreading will occur. A zero spreading coefficient means that the total free energy of the system before and after adding component B has not changed and spreading will occur provided continuous mixing is used.
As mentioned earlier, since complete wetting between the dispersed NPs and the diluted binders is important, the spreading coefficient during the mixing stage should be positive to allow spontaneous spreading and good mixing of the system. The spreading coefficient using Antonoff’s rule was zero for NPs containing formulations, which indicated that these systems are not immiscible. Thus, the calculated spreading coefficients were based on the Girifalco and Good method and are shown in Table 3.
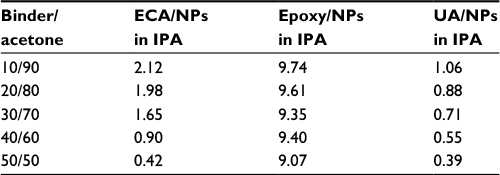 | Table 3 Spreading coefficients for neat and diluted binders with dispersed NPs in IPA Abbreviations: ECA, ethyl cyanoacrylate; IPA, isopropyl alcohol; NPs, nanoparticles; UA, urethane acrylate. |
All formulations showed positive spreading coefficients; epoxy, however, showed significantly higher values compared to UA and ECA. The spreading coefficient decreased with increasing acetone (binder solvent) wt%. The more positive the spreading coefficient value the greater the tendency for spontaneous spreading of NPs dispersed in IPA will occur in the binder. This behavior would suggest good wetting between the binder solution and the dispersed NPs and favor the localization of the NPs in the binder phase, which is an important stage before the coating process. Partial or no spreading in the mixing stage can affect the NPs localization in the final coating process.
Finally, the thermodynamics of the coating step was studied. During the coating process, the diluted formulations were spin coated on the substrate while acetone (binder solvent) and IPA (NPs carrier solvent) flowed to the surface and evaporated. As acetone has a higher evaporation rate compared to IPA (5.6 and 1.5,53 respectively), it will evaporate first and IPA will complete evaporation last. This dynamic process is critical for determining the final localization of the NPs. During IPA evaporation the specific binder can either spread on the NPs or not. If the spreading will result in a reduction of the total free energy, then the spreading coefficient will be positive, and NPs are expected to be located within the binder phase. If the spreading, however, results in an increase in the total free energy, then the spreading coefficient will be negative, and NPs are expected to be located on the surface. In order to calculate the interfacial tension between the binders and the solid NPs a special experimental step was used. Accordingly, glass slides were coated with the dispersed NPs in IPA and heated for 1 hour to ensure complete evaporation of IPA. Then, contact angles were measured between the NP-coated surface (γs) and neat binders (γL). The interfacial tension was calculated using Young’s equation. The results are summarized in Table 4. The SFE of the solid NPs was taken as 22.4 mN/m (discussed later).
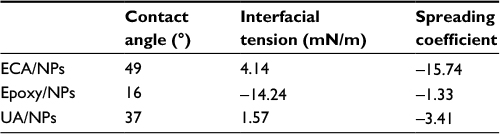 | Table 4 Spreading coefficient for neat binders and solid NPs Abbreviations: ECA, ethyl cyanoacrylate; NPs, nanoparticles; UA, urethane acrylate. |
The results in Table 4 demonstrate that all the binders have negative spreading coefficients. The spreading coefficient between ECA and NPs was extremely low and indicates that the NP will be localized on the surface for the ECA/NP system. This results in the formation of superhydrophobicity if the “right” roughness is obtained. For UA and epoxy the spreading coefficients were moderately negative however could reach zero if energy, such as heat (for curing), is supplied. These results predict the NPs localization inside the binder and loss of the nanoroughness, which is needed for superhydrophobicity. Hence, we would expect that only the ECA system could produce a superhydrophobic coating. It should be emphasized that the binder loading, in addition to the wetting of the substrate, will affect the final coating behavior and ultimate superhydrophobicity due to the development of the specific surface morphology. To study the effect of binder loading, different binder wts% ranging from 5 to 25 were formulated. All formulations were spin coated on glass (hydrophilic) and PC (hydrophobic) substrates to understand the effect of substrate wetting behavior on superhydrophobicity. SEM was used to study the coatings’ topographies with different binder wt% on two different substrates (Figures 1–3).
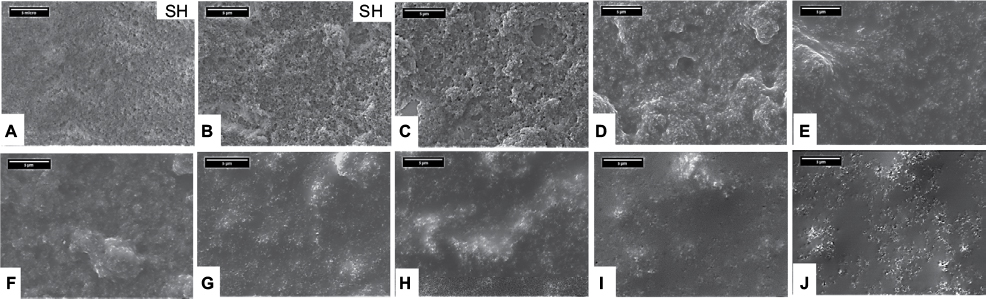
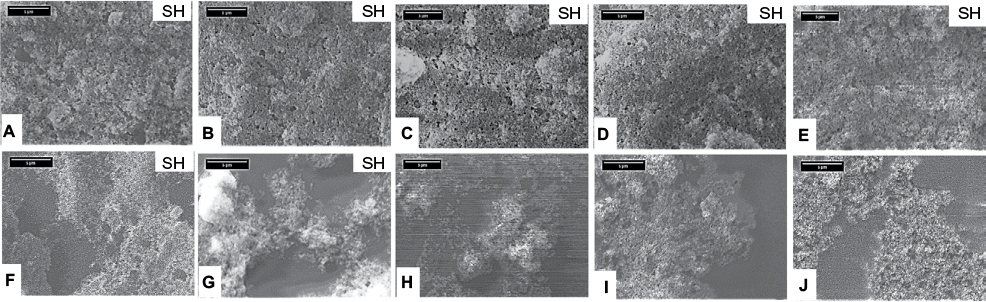 | Figure 1 SEM of surface morphology with increasing ECA wt% on two different substrates. Notes: (A–E) 5, 10, 15, 20, and 25 ECA wt% on glass; (F–J) 5, 10, 15, 20, and 25 ECA wt% on the PC substrate. Scale bar is 5 μm. Abbreviations: ECA, ethyl cyanoacrylate; PC, polycarbonate; SEM, scanning electron microscopy; SH, superhydrophobic. |
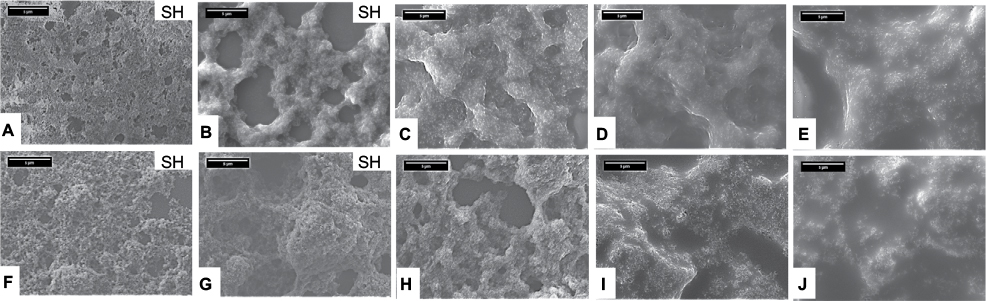
 | Figure 2 Scanning electron microscopy of surface morphology with increasing epoxy wt% on two different substrates. Notes: (A–E) 5, 10, 15, 20, and 25 epoxy wt% on glass; (F–J) 5, 10, 15, 20, and 25 epoxy wt% on the PC substrate. Scale bar is 5 μm. Abbreviations: PC, polycarbonate; SH, superhydrophobic. |
 | Figure 3 SEM of surface morphology with increasing UA wt% on two different substrates. Note: (A–E) 5, 10, 15, 20, and 25 UA wt% on glass; (F–J) 5, 10, 15, 20, and 25 UA wt% on the PC substrate. Scale bar is 5 μm. Abbreviations: PC, polycarbonate; SEM, scanning electron microscopy; UA, urethane acrylate; SH, superhydrophobic. |
The SEM images indicate that a variety of hierarchical structures are developed with respect to the NP location in the coatings; these changes were due to changing interactions between the binder and the NPs, the substrate and the coating system, as well as the binder concentration. For ECA formulations on glass, for all binder concentrations, the hydrophobic NPs appeared to locate on the top layer of the coating as predicated in the analysis. On PC, the results also supported the prediction and NPs appeared to be located on the top layer; however the ECA did not fully wet the substrate surface leading to non-coated regions. In the case of the epoxy binder on glass, >10 wt% epoxy, NPs mostly resided in the binder as predicted. Below 10 wt% binder, NPs were identified on the surface, probably due to lack of sufficient binder to completely surround the particles. On PC, most NPs appeared to be embedded in the epoxy binder as predicted. Coatings with UA binders provided similar trends as those observed for coatings with epoxy binders where NPs appeared to be embedded in the cases of high UA concentrations. As opposed to the other two binders, the NPs were not seen to spread on the surface, but were kept in the binder boundary surface.
The thermodynamic-based predictions for the NPs location for the ECA system were consistent with the SEM images showing that the NPs were mostly located on the surface for all ECA concentrations. For the UA and epoxy systems where the spreading coefficient was close to zero, the interaction between the binder and NPs in addition to the heat is sufficient to result to localization in the binders, with 15–25 wt% binder. For 5 and 10 binder wt%, although the spreading coefficient was negative, the NPs were on the surface due to the lack of sufficient binder to wet the NPs.
The substrate wetting behavior affects the wetting of the binders. All three binders showed complete wetting on glass, as expected, as glass has high SFE compared to the binders. On PC substrates having lower SFE, epoxy showed full wetting; however, ECA and UA did not wet the surface even at higher binder wt% and uncoated areas were observed.
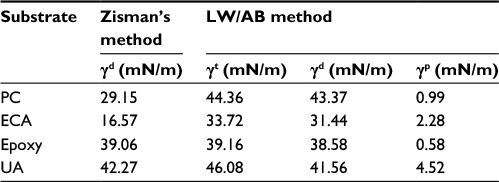
The calculated surface tensions (γt is the total surface tension, γd is the dispersive component of the surface tension, and γp is the polar component of the surface tension), using the pendant drop method, of the neat uncured binders are given in Table 1. To quantify the SFE of the PC substrate, both Zisman’s49 and LW/AB methods were used (Table 5). The surface tension of glass (high surface energy) was taken as 146 mN/m (based on the literature for microscope soda lime slides).54
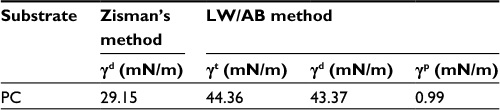 | Table 5 Surface free energy calculation for PC based on Zisman and LW/AB methods Note: γt is the total surface tension, γd is the dispersive component of the surface tension, and γp is the polar component of the surface tension. Abbreviations: LW/AB, Lifshitz–van der Waals/acid–base; PC, polycarbonate. |
A comparison of the SFE value shows that the Zisman method had lower value for PC than LW/AB method. As Zisman’s method uses only nonpolar liquids and LW/AB uses both polar and nonpolar liquids, polar interactions are not considered in Zisman’s method. As PC has two aromatic rings and a carbonyl group, which are electron donors, the SFE was taken as 44.36 mN/m.
All three binders exhibited lower SFE values than glass, which could be attributed to full wetting of the glass by the binders as seen previously by SEM (Figures 1–3). For PC, mixed results were observed because SEM showed only full wetting of PC by the epoxy while ECA and UA did not wet the PC. To explain why ECA and UA having lower surface energy than PC, did not fully wet the surface, further work has been carried out as follows.
In spin coating, when the interaction energy between a substrate and a solvent overcomes that between a substrate and a polymer, the films become rough and segregate. On the contrary, when the interaction energy between a substrate and a polymer is stronger than that between a substrate and a solvent, or when both interaction energies are weak, the films obtained are homogeneous and flat.55 Hence, the calculated interaction energy between the substrate/binder and substrate/solvent can explain the experimental results. The higher the interfacial tension the lower is the interaction between the liquid and the solid. Subsequently, the interfacial tensions were calculated using Young’s equation for contact angle measurements. As acetone was used as the binders’ solvent, the interfacial tension between acetone and the substrates was also measured using the same method. The results are presented in Tables 6 and 7.
 | Table 6 Interfacial tension for acetone solvent and uncured binders with glass Abbreviation: ECA, ethyl cyanoacrylate; CA, contact angle; IFT, interfacial tension; UA, urethane acrylate. |
 | Table 7 Interfacial tension for acetone solvent and uncured binders with PC Abbreviations: ECA, ethyl cyanoacrylate; PC, polycarbonate; UA, urethane acrylate; CA, contact angle; IFT, interfacial tension; UA, urethane acrylate. |
The results in Table 6, for glass substrate, show very high interfacial tension values for both acetone/glass and binders/glass. Because high interfacial tension values means weak interactions, the solvent and binders demonstrate weak interaction energies, resulting in a flattened and more homogeneous film as evident by the respective SEM. The results in Table 7 can explain why ECA and UA did not fully wet the PC substrate. The interfacial tensions between ECA/PC and UA/PC were higher (lower interaction) than the acetone/PC interfacial tension, resulting in segregation and uncoated areas as shown by the respective SEM. For epoxy, the interaction energy with PC was lower than the acetone/PC interaction, meaning stronger interaction energy, resulting in a flattened and more homogeneous film as shown in the respective SEM.
Superhydrophobicity study
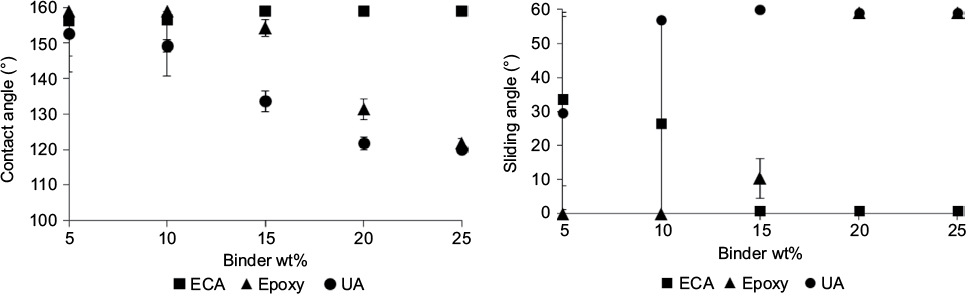
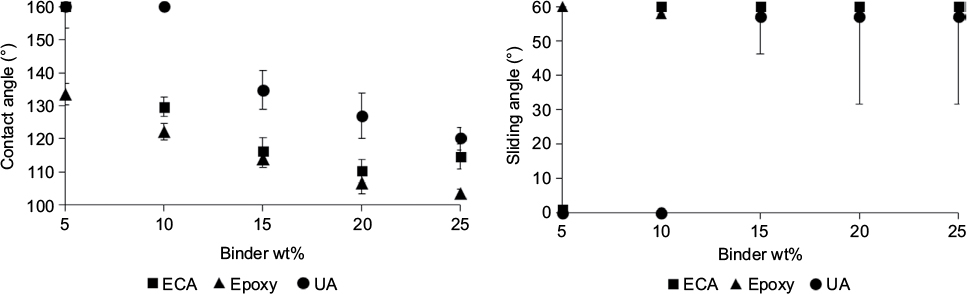
The superhydrophobicity of glass and PC substrates coated with silica NPs dispersed in different binders was evaluated by contact and sliding angle measurements. Three samples were prepared for each formulation, and the average values are shown in Figures 4 and 5.
 | Figure 4 Wetting characteristics on glass using contact angle and sliding angle measurements for three different binder formulations as a function of increasing wt% binder. Abbreviations: ECA, ethyl cyanoacrylate; UA, urethane acrylate. |
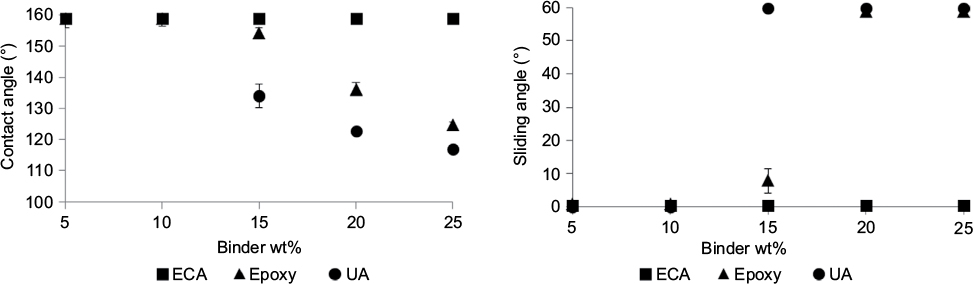
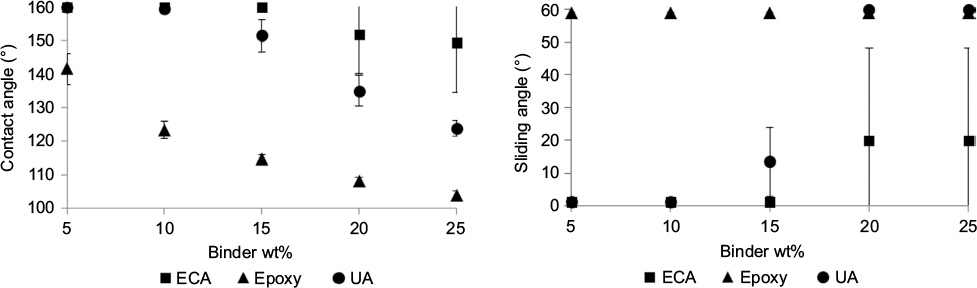 | Figure 5 Wetting characteristics on PC using contact angle and sliding angle measurements for three different binder formulations as a function of increasing wt% binder. Abbreviations: ECA, ethyl cyanoacrylate; PC, polycarbonate; UA, urethane acrylate. |
The contact angle results correlate well with the SEM images and with the formation of nanoroughness, as shown in Figures 4 and 5. ECA system exhibited superhydrophobicity for all ECA wt% on glass due to the presence of hydrophobic NPs on the top layer as shown in the respective SEM. On PC, however, superhydrophobicity was not obtained when ECA concentration was >10 wt%. SEM showed NPs located on the top layer; however ECA did not fully wet the substrate surface leading to non-coated regions. The presence of coated and non-coated regions on the PC can explain the high standard deviations of the contact angle results for high ECA concentrations – that is, some areas were superhydrophobic and some were not. Epoxy exhibited superhydrophobicity when coating glass from 5 to 10 binder wt%, but superhydrophobicity was lost at higher epoxy wt%. SEM showed that with an increase in binder wt%, it appeared that more NPs penetrated into the binder, resulting in the loss of nanoroughness, and hence, decreasing contact angle values. In the case of the PC substrate, contact angles increased with decreasing epoxy wt% due to the appearance of NPs on the surface; however, none of the epoxy formulations were superhydrophobic. This is probably because the appropriate roughness was not obtained due to the lack of sufficient numbers of NPs on the surface. The UA formulation showed superhydrophobicity at 5 and 10 binder wt% for both glass and PC. SEM showed that <10 wt% UA, NPs were on the surface. In general, the glass substrates provided superhydrophobicity over a wider range of compositions compared to PC.
As the formation of nanoroughness is essential for superhydrophobicity, it was necessary to characterize better the localization of NPs on the coating surface as they impart the nanoscale roughness to the surface. Hence, XPS was carried out to analyze whether the NPs were located on the surface, as they appeared to be in the SEM images. First, the as-supplied fumed silica NPs (control sample) and modified (with FAS) silica NPs were mounted on carbon tape and analyzed. The results are shown in Figure 6A. The XPS spectra detected the presence of silicon, oxygen, carbon, and fluorine on the surface, whereas no fluorine was detected for the as-supplied fumed NPs. Thus, the detection of FAS via fluorine atoms can be used to determine if the treated NPs are on the surface or embedded in the matrix. Because the coverage of the NPs on the carbon tape was not complete, the detection of carbon on the as-supplied fumed silica NPs was also related to the carbon tape. Figures 6B, C present XPS data for all glass and PC samples coated with 5 wt% binder concentration. The XPS data confirmed the presence of NPs with FAS on the coating surface as was also confirmed by the respective SEM analysis. It should be emphasized that all these coatings were superhydrophobic except 5 wt% epoxy on PC, although NPs were on the surface for this formulation as well. This non-superhydrophobic surface could be attributed to the lack of sufficient NPs to create the appropriate surface roughness for superhydrophobicity.
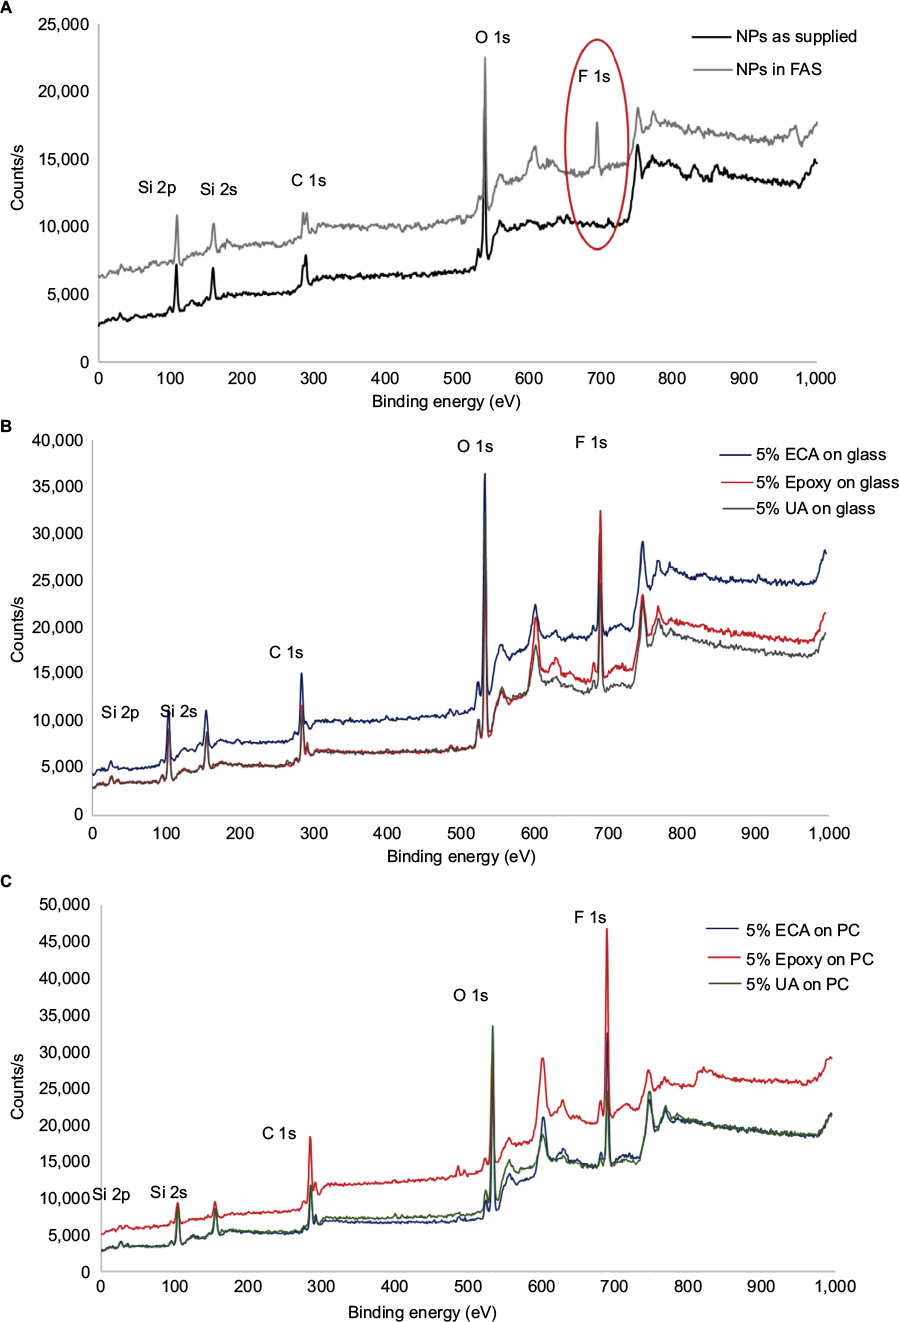 | Figure 6 XPS of silica, binders on glass and PC. Notes: (A) XPS survey scanning of the surface composition of dry, as-supplied silica NPs and with the presence of FAS; (B) XPS survey scanning of all 5 wt% binder formulations on glass; and (C) XPS survey scanning of all 5 wt% binder formulations on PC. The red circle indicates position of fluorine peak. Abbreviations: ECA, ethyl cyanoacrylate; NPs, nanoparticles; PC, polycarbonate; UA, urethane acrylate; XPS, X-ray photoelectron spectroscopy; FAS, fluoroalkylsilane. |
To conclude this part of the work, spreading coefficient calculation can predict NPs localization for formulations with high binder wt% (≥15) on high surface energy substrates, such as glass. At low binder loading (15 wt%) and with low surface energy substrates, NPs localization did not follow our prediction. The above-mentioned thermodynamic analysis showed that different binder systems demonstrate different behaviors due to the different spreading coefficients, which was shown to be an effective tool to predict the localization of the NPs within the binder used. This allows one to potentially predict which binder systems would create superhydrophobic surfaces when combined with the NPs.
Surface free energy (SFE)
Thermodynamic analysis was used to study the SFE of the different cured coatings leading to a variety of hierarchical structures with respect to the NPs location in the coatings. The SFE expresses the tendency of a system to increase its surface area resulting in a lower SFE. Hence, the presence of NPs on the surface increases the surface area and causes a reduction of SFE. SFE is further reduced by the presence of fluoro groups on the surface. To quantify the interactions, the SFEs of the component materials were calculated using both Zisman’s and LW/AB methods (Table 8). The surface tension of glass (high surface energy) was taken as 146 mN/m (based on the literature for microscope soda lime slides).44
 | Table 8 SFE calculation for neat cured binders and PC based on Zisman and LW/AB methods Note: γt is the total surface tension, γd is the dispersive component of the surface tension, and γp is the polar component of the surface tension. Abbreviations: ECA, ethyl cyanoacrylate; LW/AB, Lifshitz–van der Waals/acid–base; PC, polycarbonate; SFE, surface free energy; UA, urethane acrylate. |
A comparison of the SFE values shows that Zisman’s method has the best correlation with the LW/AB method for the epoxy binder. As Zisman’s method uses nonpolar liquids and LW/AB uses polar and nonpolar liquids, these values indicate that polar interactions are insignificant for epoxy. The Zisman SFE values for PC, ECA, and UA were lower than LW/AB values, indicating significant polar interactions in these cases. PC has two aromatic rings and a carbonyl group, ECA has a cyano group and ester group, and UA has urethane and acrylate groups, which are electron donors so their SFEs were taken as 44, 34, and 46 mN/m, respectively. The LW/AB values were used for comparison.
A similar procedure was used to determine the SFE for the binder formulations (cured binder, NPs, and fluoroalkylsilane). In this case, the determined LW/AB values were not suitable for highly hydrophobic surfaces, so Zisman’s method was used. Zisman’s values for all binder formulations on glass and PC are reported in Table 9 and graphs are shown in Figures S1–S4.
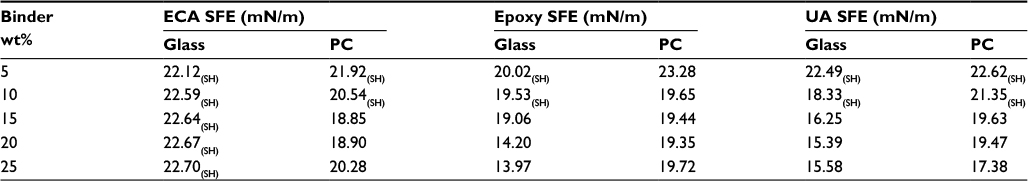 | Table 9 SFE values for all binder formulations on glass and PC using Zisman’s method Abbreviations: ECA, ethyl cyanoacrylate; PC, polycarbonate; SH, superhydrophobic; SFE, surface free energy; UA, urethane acrylate. |
As expected, all the surfaces showed lower SFE compared to the neat binders (Table 5). SFE results, however, did not indicate a clear distinction between the superhydrophobic and non-superhydrophobic surfaces. In fact, some non-superhydrophobic surfaces exhibited lower SFE than the superhydrophobic ones. These results confirmed that low SFE values alone are not sufficient to define superhydrophobicity and that surface morphology has an important role in achieving superhydrophobicity.
As observed in Table 9, for ECA formulations coated on glass no significant change in SFE was obtained due to the presence of NPs on the surface (as was shown in the SEM images). For PC, a small change in SFE was obtained between the formulations due to some non-coated areas and exposure of the PC substrate, which has a lower SFE value. As the droplet used to measure the contact angles was large enough (1 mm diameter) to encompass both the non-coated and coated areas, the size of the non-coated areas and their structure must be considered. In the case of epoxy formulations applied on glass, higher SFE values were found for the superhydrophobic formulations with the NPs on the top surface, compared to the non-superhydrophobic ones. For PC, there was no significant change in SFE for all formulations except 5 wt% (where the NPs were on the surface and thus gave a higher SFE value). Superhydrophobic UA formulations (5 and 10 wt%) on glass and PC showed higher SFE values than the non-superhydrophobic ones, as expected.
It should be noted that the surface tension of neat ECA and UA measured by the pendant drop method was not consistent with the calculated SFE of the cured binders using the LW/AB method; 25 and 27 mN/m compared to 34 and 47 mN/m, respectively. This difference was attributed to the low molecular weight of the monomers compared to the cured binder as the surface tension of polymers tends to increase with increasing molecular weight.56 In the case of the two-part epoxy, no significant change was observed between the surface tension and SFE of the cured binder, 38 and 39 mN/m, respectively. This result indicated that the uncured epoxy oligomers may have high enough molecular weight.
Durability evaluation and analysis
Superhydrophobic coatings can lose their nanoroughness by shear forces due to abrasion or other mechanical forces. As durability is critical for real applications, the mechanical integrity of the coatings was studied using the tape test. The superhydrophobicity after the tape test was determined and the results are shown in Figures 7 and 8.
 | Figure 7 Wetting characteristics after the tape test on glass using contact angle and sliding angle measurements for three different binder formulations with increasing binder wt%. Abbreviations: ECA, ethyl cyanoacrylate; UA, urethane acrylate. |
 | Figure 8 Wetting characteristics after the tape test on PC using contact angle and sliding angle measurements for three different binder formulations with increasing binder wt%. Abbreviations: ECA, ethyl cyanoacrylate; PC, polycarbonate; UA, urethane acrylate. |
Tape tests, which are often used to study coating adhesion, were used as a preliminary method to evaluate the adhesion and durability of the superhydrophobicity. No detachment of the coating was visually observed after the tape test. The results indicated that epoxy exhibited the highest durability on glass and PC compared to ECA and UA. All epoxy formulations (the superhydrophobic and non-superhydrophobic) showed only small changes in the contact angle and sliding angle values before (Figures 7 and 8) and after the tape test. This durability was attributed to the negative interfacial tension values between the NPs and epoxy (calculated in Table 4), resulting in good adhesion. The tape test results for the ECA/glass system indicated low durability for low binder wt%. This behavior was attributed to excess NPs on the top surface layer that can be detached easily. At higher binder wt%, high contact angles and low sliding angles were unchanged following the tape test due to the low interfacial tension of 4.14 mN/m between ECA and the NPs, which resulted in good adhesion. For the PC substrate, with increasing binder wt% some of the areas were coated, while some were not (Figure 3), a condition that resulted in high standard deviations of the measured contact angles. UA coatings demonstrated low durability even though NPs were embedded in the binder. This poor durability may be due to the increased SFE of the cured UA (46 mN/m) compared to the non-cured UA (27 mN/m), which resulted in higher interfacial tension and low adhesion between the binder and the NPs.
Of interest is the fact that some of the coatings are able to retain their superhydrophobic behavior after durability testing. The ECA formulations show good retention of superhydrophobic properties on glass. Clearly further work is needed to improve the behavior on PC.
Conclusion
To obtain the necessary surface morphology for superhydrophobicity (exposed NPs) combined with durability (embedded NPs), a balance should be achieved between wetting of the NPs by the binder and migration of the NPs to the surface. Thus, the use of thermodynamic analysis as an analytical tool to predict the localization of NPs is essential for the selection of binders, NPs, and substrates for different systems.
Three different binders, ECA, epoxy, and UA, and two substrates, PC and glass, were included in the study. The interfacial tensions and spreading coefficients of the as prepared solutions and the evaporation during spin coating were calculated to predict the localization of the NPs. The thermodynamic investigation was in good agreement with the SEM analysis with respect to the localization of the NPs as function of the binder concentration and substrate type. ECA showed a high negative spreading coefficient value with NPs resulting in localization of the NPs on the surface. Epoxy and UA showed moderately negative spreading coefficient values that can be overcome by heat during curing. In all three systems, with 5 and 10 binder wt%, although the spreading coefficient is positive, the NPs were on the surface due to the lack of sufficient binder to wet the NPs.
While the ECA formulations exhibited superhydrophobicity on glass from 5 to 25 binder wt%, they showed superhydrophobicity on PC only from 5 to 10 binder wt%. Epoxy exhibited superhydrophobicity on glass from 5 to 10 binder wt%, but did not form superhydrophobic structures on PC substrates. The UA formulation showed superhydrophobicity at 5 and 10 binder wt% for both glass and PC. In general, the glass substrates provided superhydrophobicity over a wider range of compositions compared to PC.
SEM analysis revealed the presence of nanoroughness from the presence of NP localization on the surface, which is critical for the creation of superhydrophobic surfaces. In all cases, the 5 and 10 binder wt% showed superhydrophobicity from insufficient binder to wet the NPs.
Some of the coatings retained their superhydrophobic behavior after durability testing demonstrating the potential of preparing durable superhydrophobic coatings for a variety of applications.
Acknowledgment
The authors appreciate the support of the National Science Foundation (Award #EEC-0832785) and the Davis and Francis Pernick Fund.
Disclosure
The authors report no conflicts of interest in this work.
References
Rios PF, Dodiuk H, Kenig S, McCarthy S, Dotan A. Durable ultra-hydrophobic surfaces for self-cleaning applications. Polym Adv Technol. 2008;19:1684–1691. | ||
Chen Y, Chen S, Yu F, Sun W, Zhu H, Yin Y. Fabrication and anti-corrosion property of superhydrophobic hybrid film on copper surface and its formation mechanism. Surf Interface Anal. 2009;41:872–877. | ||
Cheng J, Yang ZR, Hai J, Yang JX. Preparation and performance of RTV coating for anti-pollution flashover with superhydrophobicity by filling CaCO3/SiO2 composite particles into silicone rubber. Adv Mater Res. 2011;328–330:1263–1267. | ||
Seo HO, Kim KD, Jeong MG, et al. Superhydrophobic carbon fiber surfaces prepared by growth of carbon nanostructures and polydimethylsiloxane coating. Macromol Res. 2011;20(2):216–219. | ||
Wang Z, Li Q, She Z, Chen F, Li L. Low-cost and large-scale fabrication method for an environmentally-friendly superhydrophobic coating on magnesium alloy. J Mater Chem. 2012;22(1):4097–4105. | ||
Dikić T, Ming W, Van Benthem RA, Esteves AC, de With G. Self-replenishing surfaces. Adv Mater. 2012;24(27):3701–3704. | ||
Alizadeh A, Yamada M, Li R, et al. Dynamics of ice nucleation on water repellent surfaces. Langmuir. 2012;28(6):3180–3186. | ||
Hölken I, Hoppe M, Mishra YK, Gorb SN, Adelung R, Baum MJ. Complex shaped ZnO nano- and microstructure based polymer composites: mechanically stable and environmentally friendly coatings for potential antifouling applications. Phys Chem Chem Phys. 2016;18(10):7114–7123. | ||
Dotan A, Dodiuk H, Laforte C, Kenig S. The relationship between water wetting and ice adhesion. J Adhes Sci Technol. 2009;23(15):1907–1915. | ||
Kulinich SA, Farhadi S, Nose K, Du XW. Superhydrophobic surfaces: are they really ice-repellent? Langmuir. 2011;27(1):25–29. | ||
Farhadi S, Farzaneh M, Kulinich SA. Anti-icing performance of superhydrophobic surfaces. Appl Surf Sci. 2011;257(14):6264–6269. | ||
Arianpour F. Water and Ice-Repellent Properties of Nanocomposite Coatings Based on Silicone Rubber [Master’s thesis]. Vancouver, Canada: Universite du Quebec; 2010. French. | ||
Meng LY, Park SJ. Superhydrophobic carbon-based materials: a review of synthesis, structure, and applications. Carbon Letters. 2014;15(2):89–104. | ||
Lee J, Yong K. Surface chemistry controlled superhydrophobic stability of W18O49 nanowire arrays submerged underwater. J Mater Chem. 2012;22:20250–20256. | ||
Kwak G, Seol M, Tak Y, Yong K. Superhydrophobic ZnO nanowire surface: chemical modification and effects of UV irradiation. J Phys Chem C. 2009;113(28):12085–12089. | ||
Wang XL, Song WL, Gab YH, et al. Superhydrophobic modification of hydroxyapatite decreased in vitro streptococcus mutans adhesion and calcium dissolution. Chin J Dent Res. 2009;12(1):15–50. | ||
Barshilia HC, Mohan DK, Selvakumar N, Rajam KS. Effect of substrate roughness on the apparent surface free energy of sputter deposited superhydrophobic polytetrafluoroethylene thin films. Appl Phys Lett. 2009;95:033116. | ||
Kim TI, Baek Ch, Suh KY, Seo SM, Lee HH. Optical Lithography with printed metal mask and a simple superhydrophobic surface. Small. 2008;4(2):182–185. | ||
Feng J, Tuominen MT, Rothstein JP. Hierarchical superhydrophobic surfaces fabricated by dual-scale electron-beam-lithography with well-ordered secondary nanostructures. Adv Funct Mater. 2001;21(19):3715–3722. | ||
Kim BH, Lee DH, Kim JY, et al. Mussel-inspired block copolymer lithography for low surface energy materials of teflon, graphene, and gold. Adv Mater. 2011;23(47):5618–5622. | ||
Headrick JE, Armstrong M, Cratty J, Hammond S, Sheriff BA, Berrie CL. Nanoscale patterning of alkyl monolayers on silicon using the atomic force microscope. Langmuir. 2005;21(9):4117–4122. | ||
Schweikart A, Zimin D, Handge UA, Bennemann M, Altstädt V, Fery A, Koch K. Fabrication of artificial petal sculptures by replication of sub-micron surface wrinkles. Macromol Chem Phys. 2010, 211, 259–264. | ||
Nahum T, Dodiuk H, Dotan A, Kenig S, Lellouche JP. Superhydrophobic durable coating based on UV-photoreactive silica nanoparticles. J Appl Polym Sci. 2014;131:41122. | ||
Latthe SS, Imai H, Ganesan V, Venkateswara R. Porous superhydrophobic silica films by sol-gel process. Micropor Mesopor Mat. 2010;130:115–121. | ||
Karmouch R, Ross GG. Superhydrophobic wind turbine blade surfaces obtained by a simple deposition of silica nanoparticles embedded in epoxy. Applied Surface Science. 2010;257(3):665–669. | ||
Rios PF, Dodiuk H, Kenig S, McCarthy S, Dotan A. The effects of nanostructure and composition on the hydrophobic properties of solid surfaces. J Adhesion Sci Technol. 2006;20(6):563–587. | ||
Alexander S, Eastoe J, Lord AM, Guittard F, Barron AR. Branched hydrocarbon low surface energy materials for superhydrophobic nanoparticle derived surfaces. ACS Appl Mater Interfaces. 2016;8(1):660–666. | ||
Lee M, Lee S, Yim C, Jeon S. Surface wetting of superhydrophobic aluminum oxide nanostructures investigated using the fiber-optic spectrometer and quartz crystal microbalance. Sensor Actuat B Chem. 2015;220:799–804. | ||
Kartini I, Santosa SJ, Febriyanti E, Nugroho OR, Yu H, Wang L. Hybrid assembly of nanosol titania and dodecylamine for superhydrophobic self-cleaning glass. J Nanopart Res. 2014;16:2514. | ||
Xu QF, Liu Y, Lin FJ, Mondal B, Lyons AM. Superhydrophobic TiO2-polymer nanocomposite surface with UV-induced reversible wettability and self-cleaning properties. ACS Appl Mater Interfaces. 2013;5(18):8915–8924. | ||
Peng M, Liao Z, Qi J, Zhou Z. Nonaligned carbon nanotubes partially embedded in polymer matrixes: a novel route to superhydrophobic conductive surfaces. Langmuir. 2010;26(16):13572–13578. | ||
Jung S, Dorestijn M, Raps D, Das A, Megaridis CM, Poulikakos D. Are superhydrophobic surfaces best for icephobicity? Langmuir. 2011;27(6):3059–3066. | ||
Srinivasan S, Praveen V, Philip R, Ajayaghosh A. Bioinspired superhydrophobic coatings of carbon nanotubes and linear pi systems based on the bottom-up self-assembly approach. Angew Chem Int Ed. 2008;47(31):5750 –5754. | ||
Lau KKS, Bico J, Teo KBK, et al. Superhydrophobic carbon nanotube forests. Nano Lett. 2003;3(12):1701–1705. | ||
Jin X, Deng M, Kaps S, et al. Study of tetrapodal ZnO-PDMS composites: a comparison of fillers shapes in stiffness and hydrophobicity improvements. PLoS One. 2014;9(9):e106991. | ||
Wang BB, Feng JT, Zhao YP, Yu TX. Fabrication of novel superhydrophobic surfaces and water droplet bouncing behavior — part 1: stable ZnO–PDMS superhydrophobic surface with low hysteresis constructed using ZnO nanoparticles. J Adhes Sci Technol. 2010;24(15–16):2693–2705. | ||
Ates ES, Unalan HE. Zinc oxide nanowire enhanced multifunctional coatings for cotton fabrics. Thin Solid Films. 2012;520(14):4658–4661. | ||
Wang H, Tang L, Wu X, Dai W, Qiu Y. Fabrication and anti-frosting performance of super hydrophobic coating based on modified nano-sized calcium carbonate and ordinary polyacrylate. Appl Surf Sci. 2007;253:8818–8824. | ||
Zhang H, Zeng H, Gao Y, Shi F, Zhang P, Chen JF. A facile method to prepare superhydrophobic coatings by calcium carbonate. Ind Eng Chem Res. 2011;50(6):3089–3094. | ||
Wang GG, Zhu LQ, Liu HC, Li WP. Self-assembled biomimetic superhydrophobic CaCO3 coating inspired from fouling mineralization in geothermal water. Langmuir. 2011;27(20):12275–12279. | ||
Attaa AM, Al-Lohedana HA, Ezzata AO, Al-Hussainc SA. Characterization of superhydrophobic epoxy coatings embedded by modified calcium carbonate nanoparticles. Prog Org Coat. 2016;101:577–586. | ||
Qian B, Shen Z. Fabrication of superhydrophobic surfaces by dislocation-selective chemical etching on aluminum, copper, and zinc substrates. Langmuir. 2005;21(20):9007–9009. | ||
Teshima K, Sugimura H, Inoue Y, Takai O, Takano A. Transparent ultra water-repellent poly(ethylene terephthalate) substrates fabricated by oxygen plasma treatment and subsequent hydrophobic coating. Appl Surf Sci. 2005;244(1–4):619–622. | ||
Bhushan B. Bioinspired Structured Surfaces. Langmuir. 2012;28(3):1698–1714. | ||
Zhang X, Shi F, Yu X, et al. Polyelectrolyte multilayer as matrix for electrochemical deposition of gold clusters: toward super-hydrophobic surface. J Am Chem Soc. 2004;126(10):3064–3065. | ||
Rahmawan Y, Xu L, Yang S. Self-assembly of nanostructures towards transparent, superhydrophobic surfaces. J Mater Chem A. 2013;1(9):2955–2969. | ||
Xiu Y, Zhu L, Hess DW, Wong CP. Hierarchical silicon etched structures for controlled hydrophobicity/superhydrophobicity. Nano Lett. 2007;7(11):3388–3393. | ||
Scarratt LR, Hoatson BS, Wood ES, Hawkett BS, Neto C. Durable superhydrophobic surfaces via spontaneous wrinkling of teflon AF. ACS Appl Mater Interfaces. 2016;8(10):6743–6750. | ||
Zisman WA. Relation of the equilibrium contact angle to liquid and solid constitution. Adv Chem. 1964;43:1–51. | ||
Girifalco LA, Good RJ. Theory for the estimation of surface and interfacial energies. I. derivation and application to interfacial tension. J Phys Chem. 1957;61(7):904–909. | ||
Gubbels F, Jerome R. Kinetic and thermodynamic control of the selective localization of carbon black at the interface of immiscible polymer blends. Chem Mater. 1998;10(5):1227–1235. | ||
Elias L, Fenouillot F, Majeste JC, Cassagnau Ph. Morphology and rheology of immiscible polymer blends filled with silica nanoparticles. Polymer. 2007;48(20):6029–6040. | ||
Smallwood IM. Handbook of Organic Solvent Properties. New York, NY: John Wdey & Sons; 1996. | ||
Tillotson EW. On the surface tension of silicate and, borosilicate, glasses. Ind Eng Chem. 1912;4(9):651–652. | ||
Braz J. Characterization of spin-coated polymer films. Chem Soc. 2002;13(5):695–699. | ||
Moreira JC, Demarquette NR. Influence of temperature, molecular weight, and molecular weight dispersity on the surface tension of PS, PP, and PE. I. experimental. J Appl Polym Sci. 2001;82:1907–1920. |
Supplementary materials
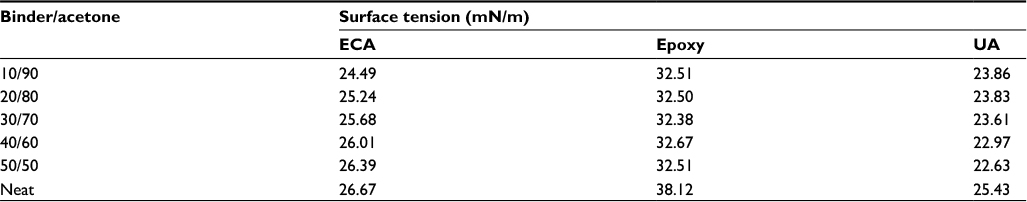 | Table S1 Surface tension calculation for neat and diluted binders Abbreviations: ECA, ethyl cyanoacrylate; UA, urethane acrylate. |
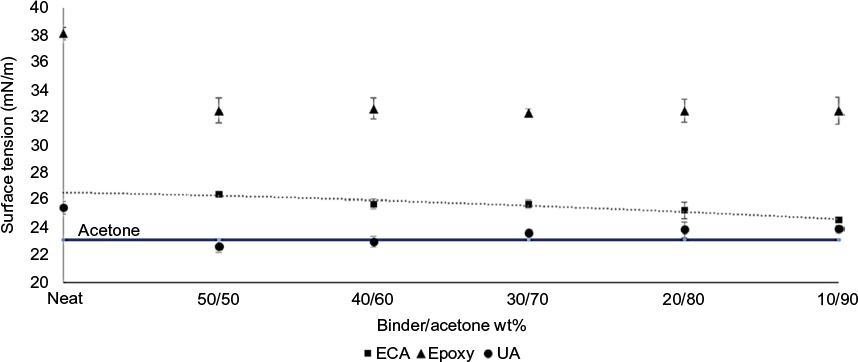 | Figure S1 Surface tension results for neat and diluted uncured binders using pendant drop method. Abbreviations: ECA, ethyl cyanoacrylate; UA, urethane acrylate. |
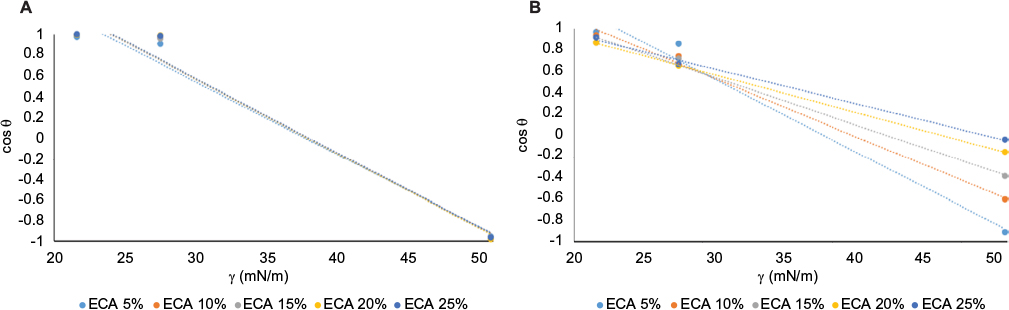 | Figure S2 Zisman linear regression plot to find the critical surface free energy for ECA formulations (A) on glass (B) on PC. Abbreviations: ECA, ethyl cyanoacrylate; PC, polycarbonate. |
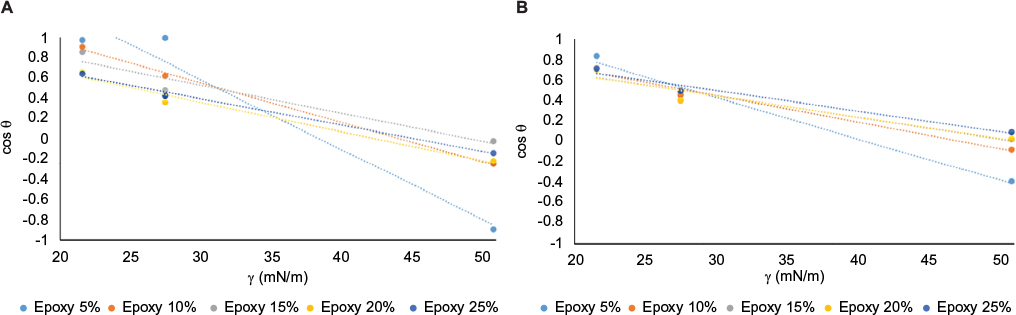 | Figure S3 Zisman linear regression plot to find the critical surface free energy for epoxy formulations (A) on glass (B) on PC. Abbreviation: PC, polycarbonate. |
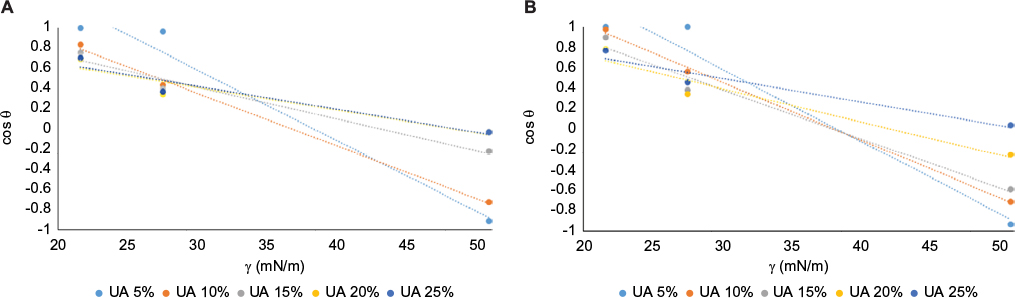 | Figure S4 Zisman linear regression plot to find the critical surface free energy for UA formulations (A) on glass and (B) on PC. Abbreviations: PC, polycarbonate; UA, urethane acrylate. |
 © 2017 The Author(s). This work is published and licensed by Dove Medical Press Limited. The
full terms of this license are available at https://www.dovepress.com/terms
and incorporate the Creative Commons Attribution
- Non Commercial (unported, 3.0) License.
By accessing the work you hereby accept the Terms. Non-commercial uses of the work are permitted
without any further permission from Dove Medical Press Limited, provided the work is properly
attributed. For permission for commercial use of this work, please see paragraphs 4.2 and 5 of our Terms.
© 2017 The Author(s). This work is published and licensed by Dove Medical Press Limited. The
full terms of this license are available at https://www.dovepress.com/terms
and incorporate the Creative Commons Attribution
- Non Commercial (unported, 3.0) License.
By accessing the work you hereby accept the Terms. Non-commercial uses of the work are permitted
without any further permission from Dove Medical Press Limited, provided the work is properly
attributed. For permission for commercial use of this work, please see paragraphs 4.2 and 5 of our Terms.