Back to Journals » Clinical Optometry » Volume 10
The effect of astigmatic axis on visual acuity measured with different alphabets in Roman alphabet readers
Authors Serra PM ![]() , Cox MJ
, Cox MJ ![]() , Chisholm CM
, Chisholm CM
Received 27 February 2018
Accepted for publication 20 April 2018
Published 6 August 2018 Volume 2018:10 Pages 93—102
DOI https://doi.org/10.2147/OPTO.S166786
Checked for plagiarism Yes
Review by Single anonymous peer review
Peer reviewer comments 3
Editor who approved publication: Mr Simon Berry
Pedro M Serra, Michael J Cox, Catharine M Chisholm
Bradford School of Optometry and Vision Sciences, University of Bradford, Bradford, UK
Objective: Astigmatism produces meridional variations in the retinal blur pattern, thus interacting with object spatial detail and altering visual performance as the axis changes. This study investigates the influence of astigmatic axis orientation on visual acuity (VA) for four alphabets used worldwide.
Methods: Visual acuity was measured monocularly in 25 Roman alphabet users (mean age: 25.6±7.5 years) using computer-presented logarithm of the minimum angle of resolution (logMAR) charts with letters from four different alphabets (Arabic, Chinese, Roman, and Tamil). VA was assessed under the effect of four optical conditions: best distance correction and three astigmatic conditions (using a +2.00 cylindrical diopter trial case lens with its axis oriented at 180, 45, or 90 degrees). For each alphabet, single optotypes were presented on a monitor viewed from a distance of 4.0 m, and a matching technique was used to identify the letters.
Results: The degradation in VA with astigmatic defocus was influenced by the alphabet used (p<0.001) and by the astigmatic axis (p<0.001). Interactions in VA degradation between astigmatic axes and alphabet (p<0.001) showed differences within 0.10 logMAR. These interactions were more pronounced in alphabets with higher dominance of curves and vertical (Tamil) and horizontal (Arabic) detail.
Conclusion: Interactions between alphabet and type of astigmatism indicate that the effects of meridional blur on letter discrimination differ between alphabets. These findings have relevance in the way VA is assessed in populations using different typographies, and ultimately in the impact of astigmatic axis on their visual performance.
Keywords: visual acuity, astigmatism, meridional blur, optotypes, letter charts
Introduction
Refractive astigmatism (RA) is a common ocular refractive error in the population1 characterized by the cylinder modulus and its axis.2 Uncorrected RA of small magnitude diminishes the ability to discriminate small printing,3 reduces reading fluency4 which may affect the academic performance,5 and its detrimental effects increase with the modulus magnitude.3,4 In infants, high cylinders presented during the developmental period may cause meridional amblyopia.6 Regarding the effect of cylinder axis on visual performance, different axes produce blur patterns on retina which differ in orientation and its interaction with the object creates different distorted images.7 Visual acuity (VA) is more affected by oblique astigmatism 3,8–12 and with-the-rule (WTR) astigmatism (horizontal negative corrective cylinder) tends to produce the least degradation. 3,8,13–15 Contrary evidence on the dependence of axis in visual performance has been reported in studies,16–20 which may reflect differences in sample size or methodology.17,18 The effects of astigmatic axis have been shown in reading performance,3,4,12,21 subjective tolerance to letter blur,22 and subjective quality of vision,23 using optically simulated astigmatism.
The prevalence of astigmatism has been associated with the ethnic origin of the population.24 Multiethnic studies have found differences in the prevalence of astigmatism among ethnic groups,25–28 and these differences also extend to the axis component. Huynh et al26,27 comparing East Asian, Middle Eastern, South Asian, and European Caucasian patients found a lower prevalence of WTR astigmatism in the European group compared to other ethnic groups. In Israel, Mandel et al29 reported more WTR astigmatism in a group of young Asian and African descendents than in Caucasians.
Different ethnic groups use specific alphabets. It is desirable that the optotypes used to measure the ability to discriminate letters (VA) resemble the observers’ common visual tasks30 and visual experience.31 Alphabets used across the world have different typography such as letter stroke frequency and complexity, which are relevant factors for letter discrimination.32–34 Therefore, using VA charts made with different alphabets may alter the way the optics of the eye (e.g., refractive error) interacts with the stimulus, hence influencing letter recognition.
To date, much of the research conducted to investigate the effect of meridional blur on visual performance has used the Roman alphabet; however, this is not representative of the typography used worldwide. This leads to the question of how visual performance measured with different alphabets for a fixed amount of astigmatism changes with astigmatic axis orientation. This study measured the effect of astigmatic blur orientation on distance VA using VA charts based on the Early Treatment of Diabetic Retinopathy Study protocol35 with letter optotype derived from four different alphabets, the Roman, Arabic, Chinese, and Tamil (Indian), in a group of Roman alphabet users. Tamil, although specific from a region, has similar features to other Indian alphabets (e.g., Hindi, Gujarati, and Punjabi). We hypothesize that VA degradation will depend on the alphabet used and axis of astigmatism.
Methods
Participants
The study enrolled 25 participants aged (average ± standard deviation) 25.6±7.5 years (median age =23 years, range: 19 to 51 years). All participants were subjectively refracted (spherical equivalent =–0.88 ± 2.15 spherical diopter) and achieved a VA (retro-illuminated Snellen VA chart) better than 0.0 logarithm of the minimum angle of resolution (logMAR) in at least one eye. Only participants with refractive astigmatism ≤0.75 cylindrical diopter (DC), (RA = –0.05 ± 0.26 DC) were included. The participants performed the experiment monocularly with the fellow eye occluded using a black occluder. The eye under test was the one achieving the best distance VA or randomly chosen if the VA scores of both eyes were identical. An artificial pupil (3.0 mm) was placed in the rear cell of the trial frame to standardize the entrance of the pupil of the eye and level the extent of retinal blur pattern across participants. If present, the spherical component of the subjective correction was placed in the trial frame cell immediately in front of the artificial pupil, and the cylindrical lens was placed in the next frontward cell. Four different refractive conditions were tested, which were as follows: “in-focus” (i.e., best distance correction), “WTR astigmatism” (+2.00 DC × 180), “oblique astigmatism” (+2.00 DC × 45), and “against-the-rule (ATR) astigmatism” (+2.00 DC × 90). This study protocol was approved by the Ethics Committee of the University of Bradford and all participants gave their written informed consent.
Chart construction
The letters used for presentation were extracted from previously validated VA charts in four different languages; Arabic,36 Chinese37, Roman,38 and Indian (Tamil)39 (Figure 1). Each VA line was generated with the same combination of letters used in the original charts to maintain similar levels of legibility per line. Four different charts using logarithmic size progression were produced for each alphabet by changing the order the letters were presented in a line. The Roman letters were electronically available (http://psych.nyu.edu/pelli/software.html) in a Sloan font type format, whereas the Arabic, Chinese, and Tamil letters were cropped from the original publication and posteriorly fitted in a 5-by-5 framework using a font creation software (FontCreator v 6.1, High Logic B.V., Utrecht, the Netherlands). A 0.0 logMAR letter viewed at 4.0 m had a width/height equal to 5.8 mm.39
 | Figure 1 Letters used to construct the visual acuity charts in Roman, Arabic, Chinese, and Tamil. |
Visual acuity protocol
The letters were generated using Psychophysical Toolbox 3 (PTB-3) supported by MatlabTM (MatlabTM 2010, The MathWorks, Inc., Massachusetts, USA) and presented individually on an LCD monitor (Nec LCD 175VXM+, resolution: 1280×1024 pixels, pixel size: 0.264 mm) at the maximum contrast level (99%) with a surround background of 292×236 arcminutes and a luminance level of 150 cd·m-2.40 Ten visual acuity levels, with five letters per level, ranging from 0.70 logMAR to –0.20 logMAR in 0.10 steps were defined for a 4.0 m viewing distance. Letter identification consisted of a matching visual acuity type of task.41 The participant was asked to carefully match the letter presented on the monitor with one of the letters presented on a template (identified with numbers from 0 to 9) which included the 10 letters corresponding to the alphabet being presented. There was no time limit to perform the match, and the participant was forced to guess when they could not identify the match. The template was laid down on a plane angled perpendicular to the participants’ line of sight at ~0.50 m from the participant. The template’s background luminance was 130 cd·m-2 and each letter on the template subtended 1.70 logMAR units. The participant had to orally dictate to the researcher the number on the template attributed to the chosen letter. All participants were Roman alphabet users and naive to the Arabic, Chinese, and Tamil alphabets. The researcher was blind to the association between the letter presented and the number dictated. The protocol started by presenting letters of 0.50 logMAR units, progressing to smaller letter sizes when three out of the five letters were correctly matched. If, at the initial VA level (0.50 logMAR), fewer than three letters were matched correctly, a larger letter size was presented. The termination criterion for each chart was more than four incorrect letters identified in a line. The VA score was calculated by subtracting from the last VA line presented, 0.02 logMAR for each letter presented but not identified correctly.42 To generate a balanced random presentation, a Latin square was designed using the type of alphabet and the refractive condition.
Statistical analysis
The effect of the fixed astigmatic defocus on VA was analyzed by the intra-individual change in VA from the in-focus condition for the three astigmatic axes; this difference was defined as VA degradation. The normality of the VA and VA degradation was verified using the Shapiro-Wilk test. Repeated measures analysis of variance (ANOVA) (one-factor: alphabet) was used to analyze differences in VA (logMAR) across the charts in the in-focus condition. The influence of the astigmatic axis on VA was analyzed using repeated measures ANOVA (two-factors: alphabet and astigmatic axis). Post hoc analysis using repeated measures ANOVA (one-factor) was applied to analyze the differences in VA degradation induced by the VA charts for each astigmatic condition and the differences in VA degradation induced by the astigmatic conditions within each VA chart. Statistical analysis was performed using SPSS (IBM SPSS 23).
Results
Table 1 presents the VA scores for the four alphabets in the four refractive conditions.
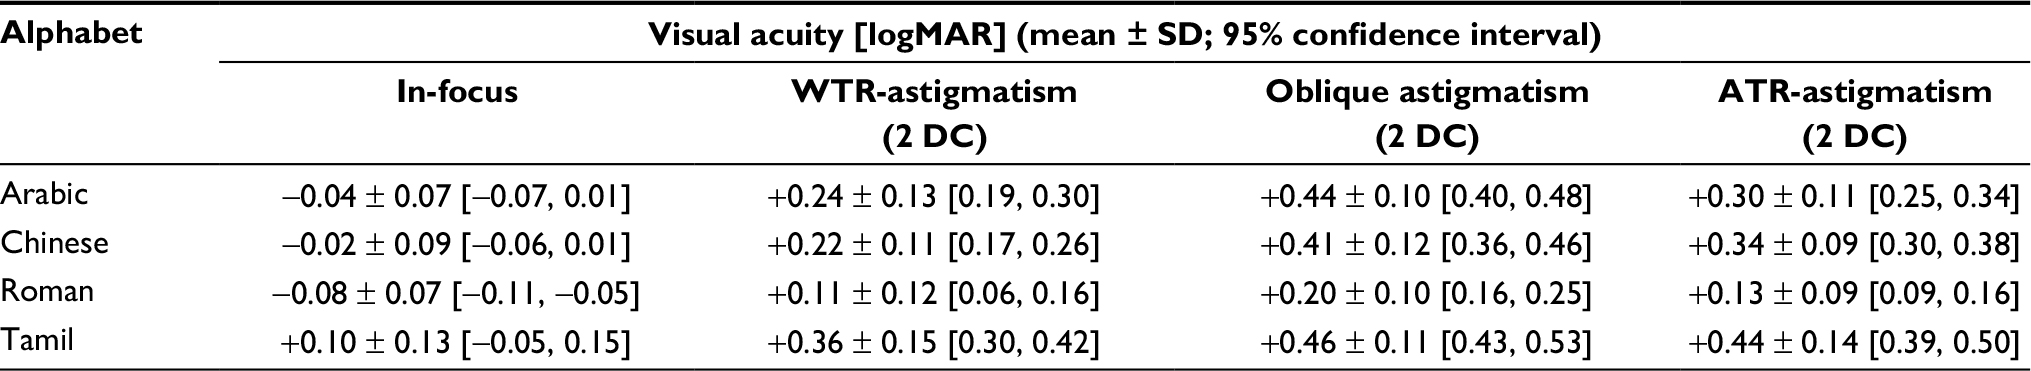 | Table 1 Visual acuity scores for the different alphabet charts and refractive conditions Notes: Values represent mean visual acuity score, standard deviation, and the 95% confidence intervals for the mean. Abbreviations: ATR, against-the-rule; DC, cylindrical diopter; logMAR, logarithm of the minimum angle of resolution; WTR, with-the-rule. |
In-focus visual acuity
For the in-focus condition, VA varied depending on the alphabetic chart presented F(3,72)=24.7, p<0.001. Compared to the VA measured with the Roman chart, with which participants exhibited best VA, VA measured using the Arabic and Chinese charts was ~0.05 logMAR line poorer (difference [logMAR]: Arabic vs Roman 0.04 [CI: 0.01, 0.08], p=0.040; Chinese vs Roman 0.06 [CI: 0.02, 0.10], p=0.050). Among the four VA charts, VA measured with the Tamil chart was the poorest, with approximately one logMAR line difference compared to the Arabic and Chinese charts (difference [logMAR]: Arabic vs Tamil –0.13 [CI: –0.19, 0.09], p<0.001; Chinese vs Tamil: –0.12 [CI: –0.17, –0.07], p<0.001) and approximately two lines compared to the Roman chart (difference [logMAR]: Tamil vs Roman 0.18 [CI: 0.12, 0.24], p<0.001).
VA dependence upon axis of astigmatism
The VA degradation induced by the three astigmatic conditions for each alphabetic chart is shown in Figure 2. Two-factors repeated-measures ANOVA showed differences in the magnitude of VA degradation induced by the three astigmatic conditions on each alphabetic chart (main factor: alphabet) F(3,72)=12.1, p<0.001. Across all three axes of astigmatism, the average VA degradation obtained with the Roman chart was the lowest (VA degradation [logMAR]: Roman –0.23 [CI: –0.28, –0.17]) compared to other three VA charts (Arabic vs Roman, p<0.001; Chinese vs Roman, p<0.001; and Tamil vs Roman, p=0.006). The Arabic, Chinese, and Tamil charts showed similar levels of VA degradation (VA degradation [logMAR]: Arabic –0.36 [CI: –0.42, –0.31], Chinese –0.35 [CI: –0.40, –0.29], Tamil –0.36 [CI: –0.42, –0.31], all pairwise comparisons p>>0.05). Post hoc repeated-measures ANOVA one-factor (alphabet) for each refractive condition showed statistically significant lower VA degradation for the Roman charts compared to the other three VA charts for the oblique (F[3,72]=11.6, p<0.001) and ATR astigmatism (F[3,72]=13.1, p<0.001). See Figure 3 for pairwise comparisons. For WTR astigmatism (F[3,72]=3.4, p=0.022), only the Arabic alphabet had a degradation significantly different to that of the Roman.
 | Figure 2 VA degradation induced by the astigmatic conditions for each alphabet. The VA degradation values represent the average of the intra-individual reductions in VA relative to the best-corrected VA. The gray box indicates the 95% confidence interval limits for the mean, the light gray line represents the mean, and the bars indicate the standard deviation. Abbreviations: ATR, against-the-rule; logMAR, logarithm of the minimum angle of resolution; VA, visual acuity; WTR, with-the-rule. |
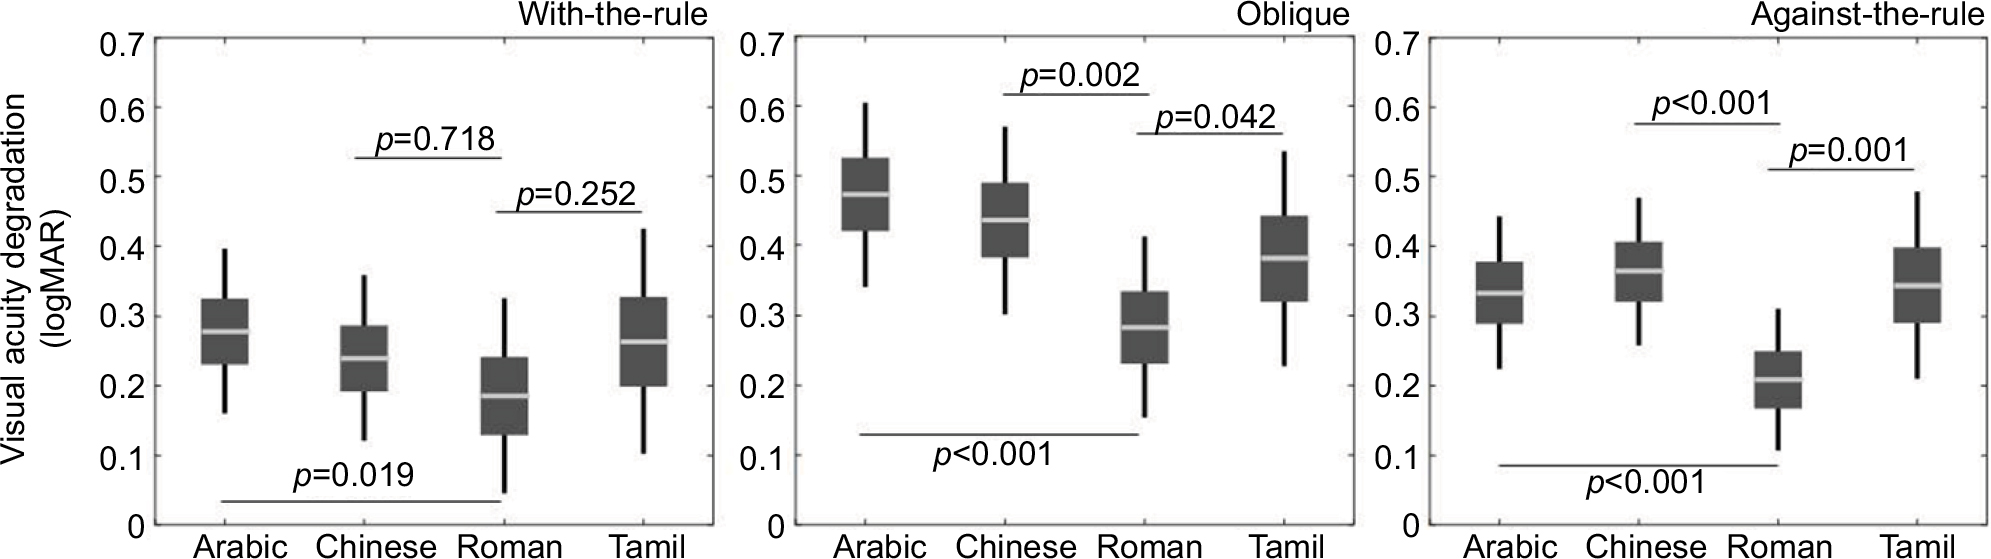 | Figure 3 VA degradation induced by the astigmatic conditions for each astigmatic condition. The gray box indicates the 95% confidence interval limits for the mean, the light gray line represents the mean, and the bars indicate the standard deviation. Pairwise comparisons between Arabic, Chinese, and Tamil alphabets (all p>0.200) are omitted for the sake of clarity. Abbreviations: logMAR, logarithm of the minimum angle of resolution; VA, visual acuity. |
Regarding the effect of the astigmatic axis on VA independently of the alphabet used, participants showed different performances depending on the axis orientation (main factor: astigmatic axis), F(2,48)= 37.6, p<0.001. Among the four charts, the average VA degradation for the WTR, oblique, and ATR conditions were –0.23 [CI: –0.29, –0.18] logMAR, –0.38 [CI: –0.43, –-0.32] logMAR, and –0.31 [CI: –0.36, –0.25] logMAR, respectively. WTR astigmatism was the least degrading (WTR vs ATR: p=0.002 and WTR vs oblique: p<0.001), and oblique astigmatism was the most (oblique vs ATR: p<0.001). The post hoc repeated-measures ANOVA one-factor (astigmatic axis) applied for each alphabet showed statistically significant influence of the astigmatic axis on the four alphabets tested (Arabic: F[1, 24]=23.0 p<0.001, Chinese: F[1, 24]=31.5 p<0.001, Roman: F[1,24]=8.0, p=0.001, Tamil: F(1,24)=12.0, p<0.001). The general tendency for WTR astigmatism and oblique astigmatism to be the least and most degrading conditions, respectively, was observed in all four alphabets; however, there were differences in the magnitude of degradation between axis and alphabets. See Figure 2 for pairwise comparisons. The differences between astigmatic axes are also reflected in the percentage of participants presenting clinical significant differences in VA defined as differences equal to or higher than ±0.1 logMAR between orientations (Table 2).43
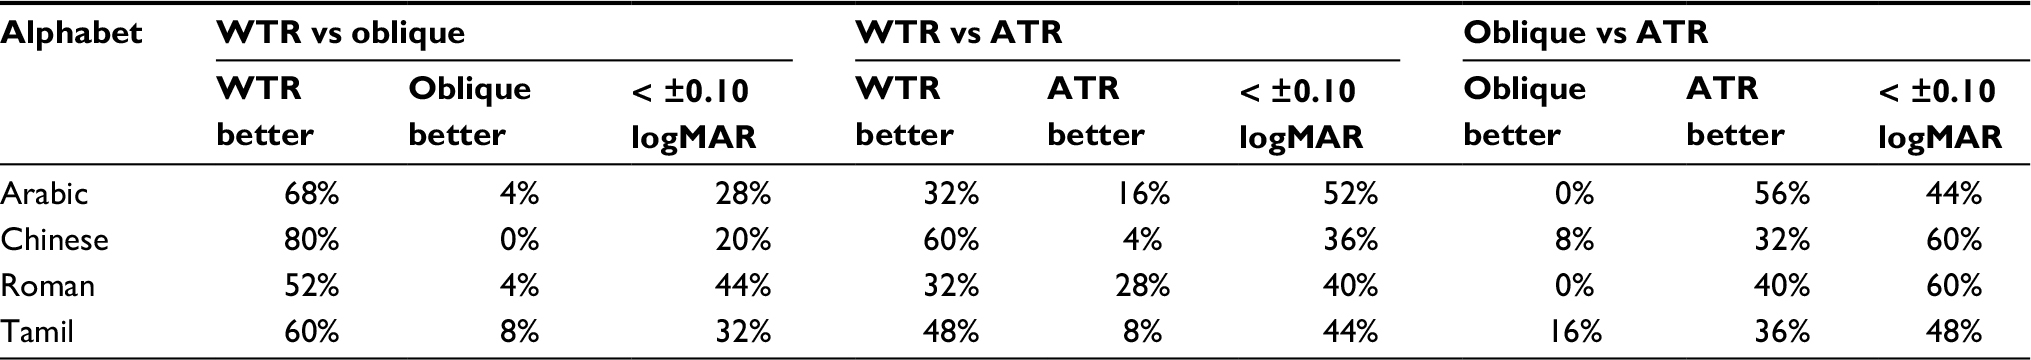 | Table 2 Percentage of participants exhibiting VA differences ≥ ±0.10 logMAR between two astigmatic conditions and percentage of participants exhibiting a VA difference of 0.10 logMAR or less Abbreviations: ATR, against-the-rule; logMAR, logarithm of the minimum angle of resolution; VA, visual acuity; WTR, with-the-rule. |
The alphabet and astigmatic axis showed significant interactions (F[6,144]=4.1, p<0.001), suggesting that the VA degradation between different astigmatic axes differed among the four charts (Table 3). In general, the magnitude of the interactions calculated as the difference in VA degradation between two astigmatic axes for two alphabetic charts was smaller than one logMAR line. The strongest interactions (0.1 logMAR) show that VA measured with Arabic and Chinese charts is more affected by a rotation in astigmatic axis from WTR to oblique astigmatism than the Roman chart. Similarly, the Chinese chart was more sensitive to whether the axis was WTR or ATR compared to the Roman chart. Between the Arabic and Tamil charts, altering the axis orientation from ATR to oblique induced a higher change in VA for the Arabic alphabet.
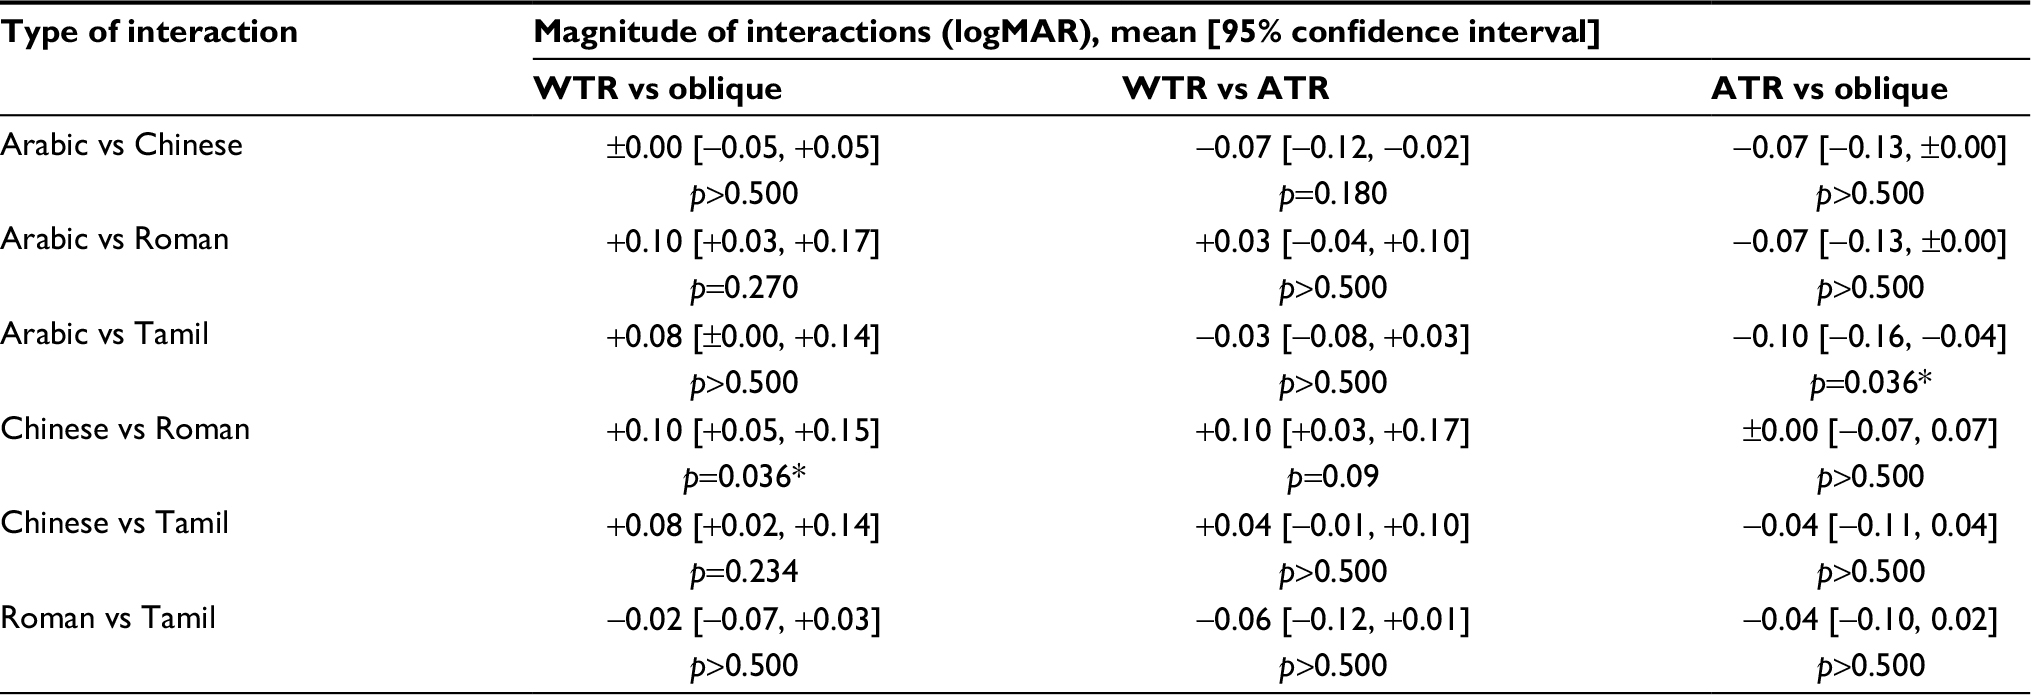 | Table 3 Magnitude of interactions (logMAR) between alphabet and astigmatic axis Notes: Calculated as the intra-individual difference between two alphabets of the intra-individual difference in VA degradation between two astigmatic conditions. *Indicates statistical significant differences (p<0.05) using Bonferroni correction (0.05/18). Abbreviations: ATR, against-the-rule; logMAR, logarithm of the minimum angle of resolution; VA, visual acuity; WTR, with-the-rule. |
Discussion
The present study evaluated the effect of meridional blur variation, produced through optically simulated simple myopic astigmatism, on distance VA assessed with charts built with letters from different alphabets, in a population of Roman alphabet users (Figure 4). The main findings are that in-focus VA and VA degradation depended on the type of alphabet used, astigmatic axis influenced the amount of degradation, and differences in VA degradation between astigmatic axes differed between charts, indicating that the effects of meridional blur depend on typography.
 | Figure 4 Convolutions for the 10 letters used in the VA charts for each alphabet (Arabic, Chinese, Roman, and Tamil). The PSFs for letter convolution were calculated using the Liou-Brennan model eye with a 3.0 mm pupil. The different astigmatic conditions were simulated using a paraxial lens placed in contact with the anterior cornea. The paraxial lens produced and generated 0.75 DC and the letter size was 0.1 logMAR. Abbreviations: ATR, against-the-rule; DC, cylindrical diopter; logMAR, logarithm of the minimum angle of resolution; PSF, point spread function; VA, visual acuity; WTR, with-the-rule. |
In-focus visual acuity
The VA attained with Roman letters was the highest and within the values expected for fully corrected young adults.38,44 The differences in VA between the Roman chart and the remaining three charts can potentially be explained by a combination of factors. The first is lack of familiarity with the Arabic, Chinese, and Tamil alphabets, since letter recognition of unfamiliar alphabets requires training to achieve the abilities of an experienced observer.34 Familiarity might explain the difference in VA between Roman, Arabic, and Chinese charts, since these alphabets have similar letter stroke frequency and complexity (Table 4). The Chinese chart is similar to a Roman chart when tested in a population familiarized with both alphabets.37 For the Tamil chart, the lack of familiarity might have had a stronger effect due to higher complexity of Tamil letters.34,45 The second and third factors are letter stroke width33,46,47 and letter complexity,34,48 both contributing for Tamil letters with a ~15% thinner stroke (corresponding to –0.07 logMAR). The thinner letter stroke width matches the difference in VA reported for the Tamil and Gujarati chart compared to the Roman chart for a population familiarized with both alphabets.39,49 Therefore, the present in-focus VA results indicate that lack of familiarity with optotypes decreases VA on average between 0.05 and 0.1 logMAR.
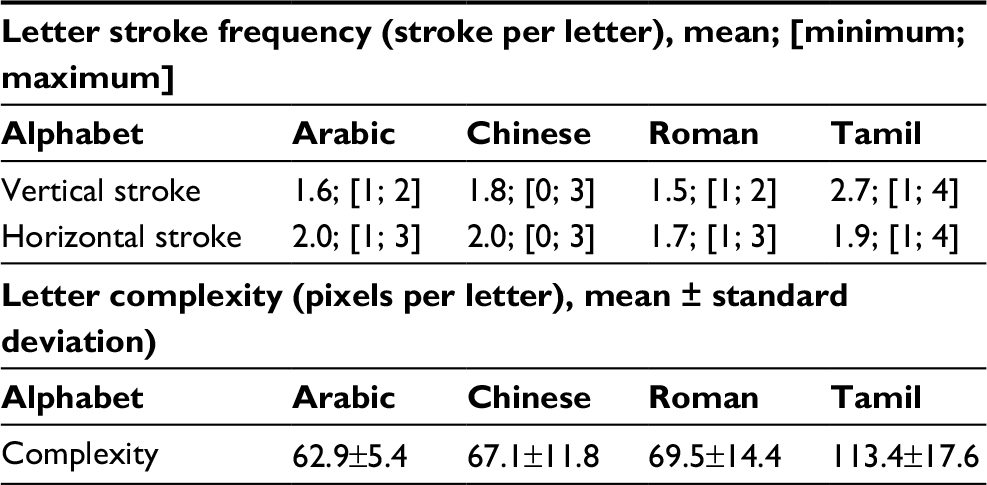 | Table 4 Letter stroke frequency and letter complexity for the individual four alphabets used Notes: Vertical and horizontal letter stroke frequencies were determined by the number of times a horizontal or a vertical crossed a letter stroke.46 The letter width/height was constant for the four alphabets. Letter complexity was calculated by measuring the perimeter of the letter outline (pixels) divided by the area occupied by the letter (pixels).48 |
Reduction in VA with astigmatic defocus
The degradation in VA induced by 2.00 DC of astigmatism depended on the alphabet used to measure VA. The Roman chart produced an average VA degradation of 0.23 logMAR. This degradation was lower than in previous studies testing the same magnitude of simple myopic astigmatism (range: 0.54 to 0.36 logMAR/2.00 DC).8,17,18,21,50 Accounting for the lowest degradation is the use of a 3.0 mm pupil limiting the extent of blur on the retina.13,51 Also, the matching technique used might have facilitated letter recognition by allowing observers to carefully match the letter presented from a fixed set of 10 letters, instead of mentally choosing a letter from the full alphabet.52
The astigmatic degradation in VA for the Arabic, Chinese, and Tamil charts increased similarly to ~0.35 logMAR. This indicates that lack of familiarity with the optotype magnified the effects of optical degradation, suggesting that experience allows observers to use critical object features, although degraded, to assist in object recognition. Additionally, the effect of astigmatism in unfamiliar letters tended to be stronger for oblique and ATR astigmatism, being the axes that degrade VA the most.
The absence of differences in VA degradation between the Arabic, Chinese, and Tamil charts suggests that differences in alphabet typography are not significant when the effect of astigmatism is considered independently from the axis. The concept of VA degradation leveled out differences related to letter stroke width and complexity in the in-focus condition, and the astigmatic defocus decreased the spatial frequency required for letter identification evenly across the three alphabets.32
Dependence of VA upon astigmatic axis
The degradation in VA depended on the type of simulated astigmatism; WTR astigmatism being the least degrading axis and oblique the most. The effect of ATR astigmatism varied between charts; for the Arabic and Roman charts the degradation was closer to that induced by WTR astigmatism, whereas for the Tamil chart its effect was similar to oblique astigmatism. The effects of ATR astigmatism on the Chinese chart differed from those of WTR and oblique astigmatism. These intra-chart differences are further evidenced by interactions between astigmatic axis and alphabet, revealing that the combination of typography and astigmatic axis influence VA degradation. For the Roman alphabet, the effects of astigmatic axis on VA were found to agree with previous studies that used simple myopic astigmatism. Wildsoet et al8 found an average of 0.20 logMAR difference in VA between 2.00 DC of WTR and ATR against oblique astigmatism, for Bailey-Lovie chart and other pictorial charts. The data in Kamiya et al’s study showed a consistent lower effect of WTR astigmatism on VA compared to ATR.13 Miller et al reported that oblique and ATR astigmatism induce higher dissatisfaction compared to WTR astigmatism.23 Using an adaptive optics system, Guo and Atchison found 18% higher tolerance to blur created by WTR astigmatism compared to oblique astigmatism,22 and Vinas et al found a lower effect of WTR astigmatism on VA compared to oblique and ATR astigmatism.53 The effect of axis orientation extends to reading tasks with oblique and ATR astigmatism producing worse reading performance compared to WTR.3–5,21 For Roman letters, differences in visual performance have been associated with the low dominance of oblique detail in letters and with the vertical stroke dominance in lower-caps letters which favors the interaction with vertical blur patterns as happens in WTR.9,22
Among the three unfamiliar alphabets, the pattern of VA degradation with astigmatic axis resembles that observed with the Roman alphabet, mainly due to the low prevalence of oblique detail. However, the different spatial features of the letters among alphabets create differences in this pattern of VA degradation. When using the Tamil chart, nearly 15% of the participants performed better with oblique astigmatism compared to ATR astigmatism (Table 2), contrasting with the absence of participants performing better with oblique astigmatism against ATR in the Arabic alphabet. The explanation might lie in the absence of oblique detail and dominance of horizontal detail in the Arabic letters, compared to the vertical stroke dominance and curvy layout of the Tamil letters. This favored the interaction with oblique blur patterns in the Tamil letters and with horizontal blur patterns for the Arabic letters. In general, when compared with WTR and ATR astigmatism, oblique astigmatism was better tolerated with the Tamil alphabet than with Arabic or Chinese. Interactions between letter typography and meridional blur orientation were suggested by Kobashi et al to explain the lack of significance in reading performance between WTR and ATR using the Japanese reading chart.12 Although the magnitude of the interactions found in the present study are generally lower than one logMAR line within the clinical variability expected in VA assessment, the influence of astigmatic axis on VA is dependent on the nature of the object and should be taken into consideration.
Limitations
This study exhibits a number of limitations. One is the fact that our participants were familiar with one of the alphabets (Roman) but not with the others, which might have unbalanced the ability to recognize letters from the different alphabets. Based on the present findings, further work including common users of different alphabets could confirm the present results using VA charts and using more realistic tasks (e.g., reading). Another limitation regards the single-letter presentation method,18,22 which did not account for the effects of adjacent blur as would happen in a line of letters.22 Also related to the letter presentation method, the application of a methodological approach based on numerically simulated defocus18 could have facilitated the investigation of additional astigmatic conditions and increasing the number of repetitions per condition to improve the reliability of the study. The authors opted for using an optical simulated method since it is a more common experimental approach (given in detail in studies of Wolffsohn ey al, Kamiya et al, and Remon et al3,13,17), resembles more the ocular defocus effect, and previous work has shown differences between numerical and simulated defocus.18 A third limitation was the use of optically simulated blur which differs from uncorrected refractive astigmatism, due to magnification effects produced by the defocusing lens and the lack of long-standing neuronal adaptation to the astigmatic error.54 The sample included in the study did not present significant RA, minimizing the effects of any meridional long-term blur adaptation,53,55 and the effects of blur adaptation on the optical conditions were balanced throughout the sample by randomization.
Conclusion
The present results demonstrate that astigmatic axis influences letter discrimination which may vary depending on the alphabet in use. Considering the ethnic variations in prevalence of type of astigmatism reported, the assessment of visual performance using letters as optotypes should take into consideration the commonly used typography/calligraphy to weigh the effect of astigmatism on the day-to-day visual function of the patient. The new electronic VA assessment devices56 are versatile tools which can have incorporated optotypes adapted to different ethical backgrounds.
Acknowledgment
The authors would like to thank Dr Brendan Barrett for helpful discussions during the manuscript preparation.
Disclosure
CMC is employed by Topcon Eye Care Company as Senior Manager for Global Education and Clinical Affairs. The authors report no other conflicts of interest in this work.
References
Hartwig A, Atchison DA. Analysis of higher-order aberrations in a large clinical population. Invest Ophthalmol Vis Sci. 2012;53(12):. 7862–7870. | ||
McKendrick AM, Brennan NA. Distribution of astigmatism in the adult population. J Opt Soc Am A. 1996;13(2):206–214. | ||
Wolffsohn JS, Bhogal G, Shah S. Effect of uncorrected astigmatism on vision. J Cataract Refract Surg. 2011;37(3): 454–460. | ||
Wills J, Gillett R,Eastwell E, et al. Effect of simulated astigmatic refractive error on reading performance in the young. Optom Vis Sci. 2012;89(3):271–276. | ||
Narayanasamy S, Vincent SJ, Sampson GP, Wood JM. Simulated astigmatism impairs academic-related performance in children. Ophthalmic Physiol Opt 2015;35(1):8–18. | ||
Freeman RD, Thibos LN. Contrast sensitivity in humans with abnormal visual experience. J Physiol. 1975;247(3):687–710. | ||
Charman WN, Voisin L. Astigmatism, accommodation, the oblique effect and meridional amblyopia. Ophthalmic Physiol Opt. 1993;13(1):73–81. | ||
Wildsoet CF, Wood JM, Hassan S. Development and validation of a visual acuity chart for Australian Aborigines and Torres Strait Islanders. Opt Vis Sci. 1998;75(11):806–812. | ||
Bradley A, Thomas T, Kalaher M, Hoerres M. Effects of spherical and astigmatic defocus on acuity and contrast sensitivity: a comparison of three clinical charts. Optom Vis Sci. 1991;68(6):418–426. | ||
Atchison DA, Mathur A. Visual acuity with astigmatic blur. Optom Vis Sci. 2011;88(7):E798–805. | ||
Trindade F, Oliveira A, Frasson M. Benefit of against-the-rule astigmatism to uncorrected near acuity. J Cataract Refract Surg. 1997;23(1):82–85. | ||
Kobashi H, Kamiya K, Shimizu K, Kawamorita T, Uozato H. Effect of axis orientation on visual performance in astigmatic eyes. J Cataract Refract Surg. 2012;38(8):1352–1359. | ||
Kamiya K, Kobashi H, Shimizu K, Kawamorita T, Uozato H. Effect of pupil size on uncorrected visual acuity in astigmatic eyes. B J Ophthalmol. 2012;96(2):267–270. | ||
Casagrande M, Baumeister M, Bühren J, Klaproth OK, Titke C, Kohnen T. Influence of additional astigmatism on distance-corrected near visual acuity and reading performance. Br J Ophthalmol. 2014;98(1):24–29. | ||
Mimouni M, Nemet A, Pokroy R, Sela T, Munzer G, Kaiserman I. The effect of astigmatism axis on visual acuity. Eur J Ophthalmol. 2017;27(3): 308–311. | ||
Chen SI, Hove M, McCloskey CL, Kaye SB. The effect of monocularly and binocularly induced astigmatic blur on depth discrimination is orientation dependent. Optom Vis Sci. 2005;82(2):101–113. | ||
Remon L, Tornel M, Furlan WD. Visual acuity in simple myopic astigmatism: influence of cylinder axis. Optom Vis Sci. 2006;83(5): 311–315. | ||
Ohlendorf A, Tabernero J, Schaeffel F. Visual acuity with simulated and real astigmatic defocus. Optom Vis Sci. 2011;88(5):562–569. | ||
Singh A, Pesala V, Garg P, Bharadwaj SR. Relation between uncorrected astigmatism and visual acuity in pseudophakia. Optom Vis Sci. 2013;90(4):378–384. | ||
Watanabe K, Negishi K, Kawai M, Torii H, Kaido M, Tsubota K. Effect of experimentally induced astigmatism on functional, conventional, and low-contrast visual acuity. J Refract Surg. 2013;29(1):19–24. | ||
Serra P, Chisholm C, Sanchez Trancon A, Cox M. Distance and near visual performance in pseudophakic eyes with simulated spherical and astigmatic blur. Clin Exp Optom. 2016;99(2):127–134. | ||
Guo H, Atchison DA. Subjective blur limits for cylinder. Optom Vis Sci. 2010;87(8):E549–559. | ||
Miller AD, Kris MJ, Griffiths AC. Effect of small focal errors on vision. Optom Vis Sci. 1997;74(7):521–526. | ||
Read SA, Collins MJ, Carney LG. A review of astigmatism and its possible genesis. Clin Exp Optom. 2007;90(1):5–19. | ||
Kleinstein RN, Jones LA, Hullett S, et al. Refractive error and ethnicity in children. Arch Ophthalmol. 2003;121(8):1141–1147. | ||
Huynh SC, Kifley A, Rose KA, Morgan I, Heller GZ, Mitchell Pl. Astigmatism and its components in 6-year-old children. Invest Ophthalmol Vis Sci. 2006;47(1):55–64. | ||
Huynh SC, Kifley A, Rose KA, Morgan IG, Mitchell P,. Astigmatism in 12-year-old Australian children: comparisons with a 6-year-old population. Invest Ophthalmol Vis Sci. 2007;48(1):73–82. | ||
Pan CW, Chiang PP, Wong TY, et al. Ethnic differences in undercorrected refractive error in Asians. Optom Vis Sci. 2014;91(2):212–220. | ||
Mandel Y, Stone RA, Zadok D. Parameters associated with the different astigmatism axis orientations. Invest Ophthalmol Vis Sci. 2010;51(2):723–730. | ||
Zhang JY, Zhang T, Xue F, Liu L, Yu C. Legibility variations of Chinese characters and implications for visual acuity measurement in Chinese reading population. Invest Ophthalmol Vis Sci. 2007;48(5):2383–2390. | ||
Whitaker D,McGraw PV. Long-term visual experience recalibrates human orientation perception. Nat Neurosci. 2000;3(1):13. | ||
Thorn F, Schwartz F. Effects of dioptric blur on Snellen and grating acuity. Optom Vis Sci. 1990;67(1):3–7. | ||
Majaj NJ, Pelli DG, Kurshan P, Palomares M. The role of spatial frequency channels in letter identification. Vision Res. 2002;42(9):1165–1184. | ||
Pelli DG, Burns CW, Farell B, Moore-Page DC. Feature detection and letter identification. Vision Res. 2006;46(28):4646–4674. | ||
Ferris FL, 3rd, Kassoff A, Bresnick GH, Bailey I. New visual acuity charts for clinical research. Am J Ophthalmol. 1982;94(1):91–96. | ||
Al-Mufarrej MM, Abo-Hiemed FA, Oduntan AO. A new Arabic distance visual acuity chart. Optom Vis Sci. 1996;73(1):59–61. | ||
Lam AK., Tong C, Tse J, Yu M. Repeatability of near visual acuity measurement at high and low contrast. Clin Exp Optom. 2008;91(5):447–452. | ||
Plainis S, Tzatzala P, Orphanos Y, Tsilimbaris MK. A modified ETDRS visual acuity chart for European-wide use. Optom Vis Sci. 2007;84(7):647–653. | ||
Varadharajan S, Srinivasan K, Kumaresan B. Construction and validation of a Tamil logMAR chart. Ophthalmic Physiol Opt. 2009;29(5):526–534. | ||
Ferris FL, 3rd, Bailey I. Standardizing the measurement of visual acuity for clinical research studies: Guidelines from the Eye Care Technology Forum. Ophthalmology, 1996;103(1):181–182. | ||
Sheridan MD, Gardiner PA. Sheridan-Gardiner test for visual acuity. Br Med J. 1970;2(5701):108–109. | ||
Carkeet A. Modeling logMAR visual acuity scores: effects of termination rules and alternative forced-choice options. Optom Vis Sci. 2001;78(7):529–538. | ||
Bailey IL, Lovie-Kitchin JE. Visual acuity testing. From the laboratory to the clinic. Vision Res. 2013;90:2–9. | ||
Elliott DB. Clinical Procedures in Primary Eye Care. 4th ed. Amsterdam: Elsevier; 2013: 318. | ||
Wiley RW, Wilson C, Rapp B. The effects of alphabet and expertise on letter perception. J Exp Psychol Hum Percept Perform. 2016;42(8):1186–1203. | ||
Parish DH, Sperling G. Object spatial frequencies, retinal spatial frequencies, noise, and the efficiency of letter discrimination. Vision Res. 1991;31(7–8): 1399–1415. | ||
Akutsu H, Bedell HE, Patel SS. Recognition thresholds for letters with simulated dioptric blur. Optom Vis Sci. 2000;77(10):524–530. | ||
Arnoult MD, Attneave F. The quantitative study of shape and pattern perception. Psychol Bull. 1956;53(6):452–471. | ||
Sailoganathan A, Siderov J, Osuobeni E. A new Gujarati language logMAR visual acuity chart: development and validation. Indian J Ophthalmol. 2013;61(10):557–561. | ||
Watanabe K, Negishi K, Kawai M, Torii H, Kaido M, Tsubota K. Effect of experimentally induced astigmatism on functional, conventional, and low-contrast visual acuity. J Refractive Surg. 2013;29(1):19–24. | ||
Atchison DA, Smith G, Efron N. The effect of pupil size on visual acuity in uncorrected and corrected myopia. Am J Optom Physiol Opt. 1979;56(5):315–323. | ||
Rice ML, Leske DA, Holmes JM. Comparison of the amblyopia treatment study HOTV and electronic-early treatment of diabetic retinopathy study visual acuity protocols in children aged 5 to 12 years. Am J Ophthalmol. 2004;137(2):278–282. | ||
Vinas M, de Gracia P, Dorronsoro C, et al. Astigmatism impact on visual performance: meridional and adaptational effects. Optom Vis Sci. 2013;90(12):1430–1442. | ||
Sawides L, Marcos S, Ravikumar S, Thibos L, Bradley A, Webster Ml. Adaptation to astigmatic blur. J Vis. 2010;10(12):22. | ||
Hughes AR, Mallen EA, Elliott DB. The visual impact of lens-induced astigmatism is linked to habitual axis. Optom Vis Sci. 2017;94(2):260–264. | ||
Rhiu S, Lee HJ, Goo YS, Cho K, Kim JH. Visual acuity testing using a random method visual acuity application. Telemed J E-Health. 2016;22(3): 232–237. |
 © 2018 The Author(s). This work is published and licensed by Dove Medical Press Limited. The
full terms of this license are available at https://www.dovepress.com/terms
and incorporate the Creative Commons Attribution
- Non Commercial (unported, 3.0) License.
By accessing the work you hereby accept the Terms. Non-commercial uses of the work are permitted
without any further permission from Dove Medical Press Limited, provided the work is properly
attributed. For permission for commercial use of this work, please see paragraphs 4.2 and 5 of our Terms.
© 2018 The Author(s). This work is published and licensed by Dove Medical Press Limited. The
full terms of this license are available at https://www.dovepress.com/terms
and incorporate the Creative Commons Attribution
- Non Commercial (unported, 3.0) License.
By accessing the work you hereby accept the Terms. Non-commercial uses of the work are permitted
without any further permission from Dove Medical Press Limited, provided the work is properly
attributed. For permission for commercial use of this work, please see paragraphs 4.2 and 5 of our Terms.