Back to Journals » Clinical Ophthalmology » Volume 14
The Effect of Anti-Vascular Endothelial Growth Factor on Retinal Microvascular Changes in Diabetic Macular Edema Using Swept-Source Optical Coherence Tomography Angiography
Authors Pongsachareonnont P ![]() , Charoenphol P, Hurst C
, Charoenphol P, Hurst C ![]() , Somkijrungroj T
, Somkijrungroj T
Received 2 July 2020
Accepted for publication 12 October 2020
Published 16 November 2020 Volume 2020:14 Pages 3871—3880
DOI https://doi.org/10.2147/OPTH.S270410
Checked for plagiarism Yes
Review by Single anonymous peer review
Peer reviewer comments 4
Editor who approved publication: Dr Scott Fraser
Pear Pongsachareonnont,1 Pulthip Charoenphol,1 Cameron Hurst,2,3 Thanapong Somkijrungroj1
1Vitreoretinal Research Unit, Department of Ophthalmology, Faculty of Medicine, Chulalongkorn University and King Chulalongkorn Memorial Hospital, Thai Red Cross Society, Bangkok, Thailand; 2Biostatistics Center, Department of Research Affairs, Faculty of Medicine, Chulalongkorn University, Bangkok, Thailand; 3QIMR Berghofer Medical Research Institute, Brisbane, Queensland, Australia
Correspondence: Pear Pongsachareonnont
Vitreoretinal Research Unit, Department of Ophthalmology, Faculty of Medicine, Chulalongkorn University and King Chulalongkorn Memorial Hospital, Thai Red Cross Society, 1873 Rama IV Road, Pathumwan, Bangkok 10330, Thailand
Tel +66-2256-4142
Fax +66-2-252-8290
Email [email protected]
Purpose: This study evaluates the effect of anti-vascular endothelial growth factor (anti-VEGF) therapy on microaneurysm changes and foveal avascular zone (FAZ) using optical coherence tomography angiography (OCTA) in patients with diabetic macular edema (DME).
Design: Prospective observational study.
Materials and Methods: This study involved patients with DME undergoing anti-VEGF treatment (aflibercept, ranibizumab, and bevacizumab). Macula OCTA images were obtained before (visit 0) and 1 month after (visit 1) anti-VEGF injection. Microaneurysm counts were performed, and the FAZ was evaluated in the superficial capillary plexus (SCP) and deep capillary plexus (DCP). The differences in microaneurysms, FAZ, and clinical correlations were analyzed.
Results: A total of 152 eyes were analyzed. The patients’ mean age was 59 years. Bevacizumab was used in 69.7%, ranibizumab in 15.1%, and aflibercept in 15.1%. There was a significant reduction in the FAZ in the SCP and DCP between visits 0 and 1. All anti-VEGF medications reduced the number of microaneurysms (p< 0.01). After treatment, changes in the FAZ in SCP and DCP corresponded with changes in visual acuity (p< 0.01).
Conclusion: Microaneurysms as detected by OCTA might serve as a biomarker for a clinical response to anti-VEGF treatment in the short term. The FAZ might also predict visual acuity improvement after anti-VEGF injection.
Trial Registration: Thai Clinical Trials Registry (TCTR20161010005).
Keywords: diabetic macular edema, diabetic retinopathy, foveal avascular zone, microaneurysms, anti-VEGF, OCT-A
Background
Pericyte loss and endothelial cell proliferation in patients with diabetic retinopathy (DR) weaken the vascular walls, resulting in the formation of microaneurysms (MAs) and increased vascular permeability by upregulation of inflammatory cytokines. These changes lead to the development of diabetic macular edema (DME).1 Early detection and close follow-up can diminish the progression of DME. An MA itself is one imaging biomarker used to detect the progression of DR and assess the pathophysiological treatment response of central-involved macular edema in patients with type 2 diabetes.2 Vascular endothelial growth factor (VEGF) is the main factor associated with the development of retinal vascular hyperpermeability; thus, anti-VEGF agents are used as the primary treatment for DME, effectively improving macular edema and vision in most patients. The efficacy of different anti-VEGF medications has been compared in many randomized controlled trials in terms of visual acuity and reduction of macular thickness shown by optical coherence tomography (OCT).3
OCT angiography (OCTA) is able to show changes in patients with DR and is noninferior to fundus fluorescein angiography (FA). In a swept source OCTA (ss-OCTA) study of patients with diabetic maculopathy, 41% showed enlargement of the foveal avascular zone (FAZ) on OCTA, and 100% of microvascular lesions, DME, and neovascularization of the optic disc seen on fundus FA were also detected on OCTA.4 OCTA can demonstrate MAs, vascular nonperfusion, vascular loops, microvascular abnormalities, neovascularization, some intraretinal fluid patterns, and cotton wool spots consistent with fundus FA findings.5 Salz et al.6 reported that the sensitivity and specificity of detection of MAs by ss-OCTA versus fundus FA were 85% and 75%, respectively, and that the retinal depth of 100% of MAs could be located by ss-OCTA. Patients with DR exhibit FAZ enlargement, and with the ability to determine the microvascular lesion depth by OCTA, the superficial capillary plexus (SCP) and deep capillary plexus (DCP) have been found to differ in patients with DR.7 The DCP plays an important role in oxygenation of the outer retina and has been shown to be related to macular photoreceptor disruption, which leads to deterioration of visual acuity.8,9 OCTA also helps in DME in terms of the differentiation of cystoid space and nonperfused area by the location of the flow void area; this is not correlated with the distribution around the foveal capillary, and an irregular border can be shown in the nonperfused area.9,10 In comparison with the standard ophthalmic clinical examination, OCTA can detect foveal microvascular changes that are missed by the clinical fundus examination.11
The present study was performed to evaluate the effect of anti-VEGF agents on MA changes using OCTA in patients with DME. The secondary main objective was to compare structural changes of DME in patients treated with aflibercept, bevacizumab, and ranibizumab and describe the OCTA findings in association with the visual outcome.
Materials and Methods
This prospective descriptive analytic study was conducted at King Chulalongkorn Memorial Hospital (KCMH), Bangkok, Thailand. The institutional review board of the Faculty of Medicine, Chulalongkorn University approved the study (IRB number 395/59). All patients were given a full explanation of the study, and written informed consent was obtained prior to enrollment. The study protocol adhered to tenets of the Declaration of Helsinki. The study was registered with the Thai Clinical Trials Registry before its commencement (TCTR20161010005).
Among patients with a diagnosis of DME who presented to the outpatient clinic of KCMH, those who underwent a comprehensive eye examination and routine diagnostic evaluation and who planned to undergo treatment with an intravitreal anti-VEGF agent (aflibercept, ranibizumab, or bevacizumab) were included in the study from June 2016 to July 2017. The exclusion criteria were an age of <18 years, severe media opacity, prior macular laser or intravitreal steroid treatment of DME (including focal/grid laser therapy or intravitreal steroid injection/implantation), other eye diseases that cause retinal microvascular changes (including eye injuries, retinal detachment surgery, previous surgery within 3 months, glaucoma, uveitis, retinal vascular disease, hereditary and degenerative macular disease, and retinal and choroidal detachment), and outer retinal structural changes defined by OCT (large drusen, large retinal pigment epithelium detachment, or loss of the ellipsoid layer). Demographic data were recorded. Information on visual acuity, OCTA imaging findings, central macular thickness (CMT), and the FAZ area were collected and compared between two time points: prior to intravitreal injection (Week 0) and approximately 4 weeks (Week 4) after injection. The CMT is obtained by center volumetric 1000 microns of automated ETDRS grid from OCT machine.
OCTA images were obtained using an ss-OCT device (DRI OCT Triton; Topcon Corporation, Tokyo, Japan) with a central wavelength of 1050 nm. Image scans were taken from 3 × 3-mm cubes, with each cube containing 320 clusters of four repeated B-scans centered on the fovea. En face images of the retinal vasculature were generated from the superficial retinal layer and deep retinal layer based on the automated layer segmentation performed by IMAGEnet 6 software (Topcon Medical Systems, Inc., Tokyo, Japan). The en face images of the SCP layer were derived from an en face slab that extended from the internal limiting membrane to the border between inner plexiform layer and inner nuclear layer in the automated software. The automated en face images of the DCP were derived from a slab that extended from the border between the inner plexiform layer and inner nuclear layer to the border of the outer plexiform layer and outer nuclear layer. All automated images were checked for correction of the retina slab with manual adjustment before sending for analysis.
For subgroup analysis between naïve case and non-naïve case (have had previous anti-VEGF injection), MAs changes was compared between Week 0 (Visit 0) and Week 4 (Visit 1) in only the center area (area 9), then the changes were categorized as improved or non-improved. Improvement is defined as MAs count at Week 0 is higher than MAs count at Week 4. Non -improvement is defined as the MAs count from Week 0 is equal or lower to Week 4. The association of improvement of MAs count between naïve and non-naïve was calculated in each layer (SCP and DCP) and reported in odds ratio. Figure 1 demonstrates the MAs labels.
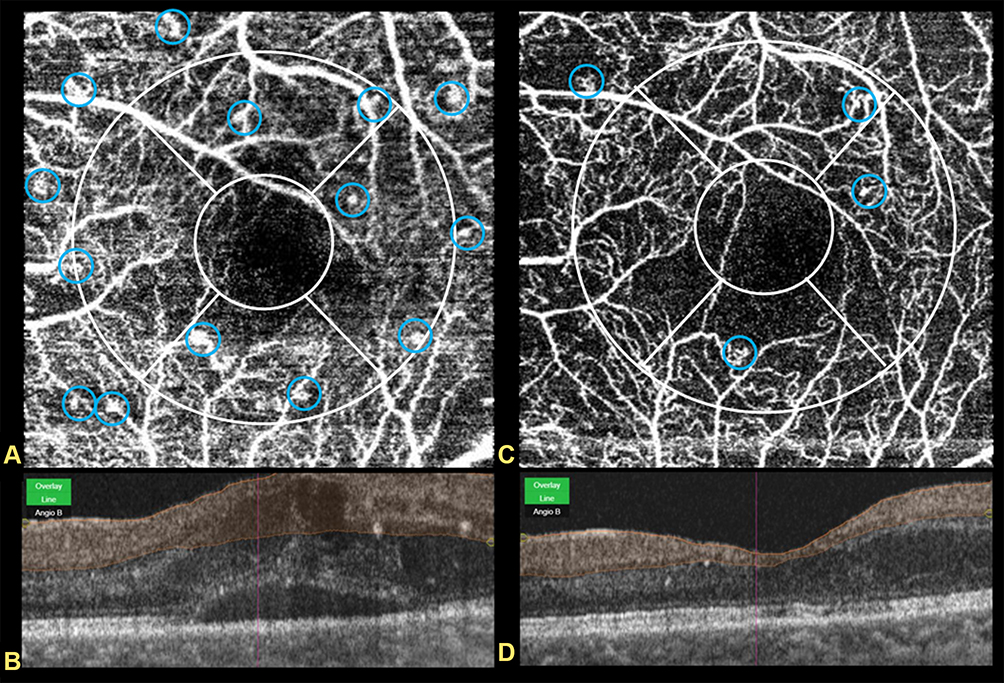 |
Figure 1 Demonstrates the OCTA image of visit 0 and visit 1 in the same patient. Blue circle shows the microaneurysm count. (A and B) shows OCTA image of superficial capillary plexus at visit 0 and visit 1 respectively. (C and D) shows B-scan of the OCTA in foveal area of A and B respectively. |
The fovea was defined as the area within the central 1-mm ring of the Early Treatment Diabetic Retinopathy Study (ETDRS) grid. The parafoveal region was defined as the area between the central 1- and 3-mm ring of the ETDRS grid. We superimposed the ETDRS grid on the OCTA image. The FAZ area and MAs in the SCP and DCP were independently graded by two trained experienced graders (intraclass correlation coefficient [ICC], 0.99) according to each segment from ETDRS circles. Figure 2 shows the ETDRS circle and area segment. Only high-quality images (<80% segmentation artifact from entered images and no involvement of the center of the images by the artifact) were selected for analysis.
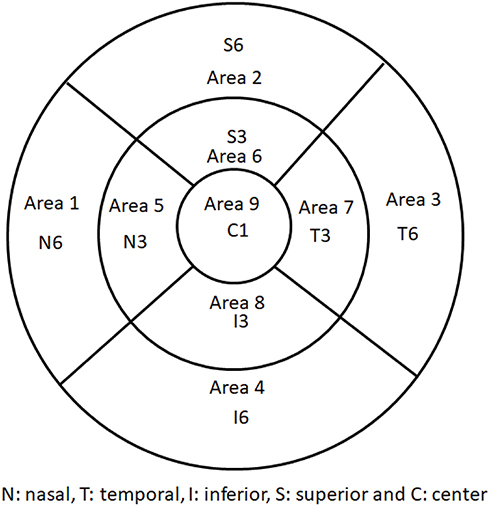 |
Figure 2 Demonstrates ETDRS grid of the left eye and area labeled in each segment which use for image analysis. |
Definitions
- DME was diagnosed when retinal thickening was noted by slit-lamp biomicroscopy or OCT by an ophthalmologist.
- The FAZ area was defined as the area inside the central border of the capillary network, which was outlined manually for the superficial and deep retinal layers in accordance with our previously described technique.
- MAs were defined as distinctly round, saccular, or fusiform hyperfluorescent spots with an estimated diameter of 20–90 μm that appeared to be connected to the retinal capillaries.
- The capillary nonperfused area was defined as an area devoid of flow signal that would normally be a vascular area.
Image Processing
OCTA images (3 × 3-mm scans) were exported as JPEG files for analysis. To locate the border of the FAZ in the SCP and DCP, the pen function in the Snipping Tool software of Microsoft Windows 10 (Microsoft Corp., Redmond, WA, USA) was used to outline the border of the FAZ area in both the SCP and DCP. To obtain the MA count, MAs were manually selected by the examiner according to the definition of MAs in this study. The FAZ area which includes the foveal avascular zone connected to the capillary non-perfused area of its border were measured manually in the same fashion.4 The two examiners were blinded to the outcome of the study.
Statistical Analysis
Paired t-test were used to compare the mean change in the FAZ between each visit and between different layers. The Wilcoxon signed rank test was used to compare the MA count in different regions and at different visits. Mixed-effects Poisson regression with the random effect as individual patient with calculation of the rate ratio was used to analyze the MA changes. A linear mixed model with propensity score adjustment for age, sex, duration of diabetes, diabetes treatment, use of antiplatelet agents, HbA1c level, grade of DR, and lens status was used to evaluate the changes in MAs and CMT between anti-VEGF. The patients’ baseline demographics and CMT were recorded and analyzed. For subgroup analysis between the change of MAs between naïve and non-naïve cases, mixed effect logistic regression analysis was used. We used both the R program (R Foundation for Statistical Computing, Vienna, Austria) and STATA® version 15.1 (StataCorp, Texas, USA). P value of <0.05 was considered statistically significant. The sample size calculation based on the one-sample testing mean with Zα=1.96 (two-sided test), σ2=(1.2)2, and d=4.9 gave rise to at least 50 patients needed for study. The ICC with 95% confidence interval (CI) was calculated to assess interexaminer agreement. Our estimated reliability between examiners was 0.997 (95% CI: 0.993–0.998) for the FAZ area. The ICC for the MA between examiners was 0.994 (95% CI: 0.987–0.997). Repeatability of the measurements of the pre- and post-treatment parameters between the examiners was excellent for the SCP and DCP.
Results
In total, 152 eyes of 124 patients were included in the study. The mean age of the patients was 59 years, and 73 (48%) were male. The mean HbA1c level was 7.62%±0.82%. PDR was present in 45.4%, severe non-proliferative DR (NPDR) in 25.7%, moderate NPDR in 25%, and mild NPDR in 3.9%. The anti-VEGF agents comprised bevacizumab (69.7%), ranibizumab (15.1%), and aflibercept (15.1%), and 50% of the study eyes were treatment-naïve. The baseline clinical characteristics are shown in Table 1. The visual acuity at visit 0 (before anti-VEGF injection) and visit 1 (1 month after anti-VEGF injection) is shown in Table 2. The overall mean FAZ area in the SCP and DCP at visit 0 was 0.41±0.08 and 0.47±0.09 mm2, respectively. The overall mean FAZ area in the SCP and DCP at visit 1 was 0.35±0.10 and 0.4±0.10 mm2, respectively. The mean CMT at visits 0 and 1 was 397.64±91.17 and 364.59±84.3 µm, respectively. The FAZ area in the DCP layer at visits 0 and 1 was larger than that in the SCP with a mean difference of 0.05 mm2 (95% CI, 0.05–0.06, p<0.01) and 0.05 mm2 (95% CI, 0.04–0.05, p<0.01), respectively.
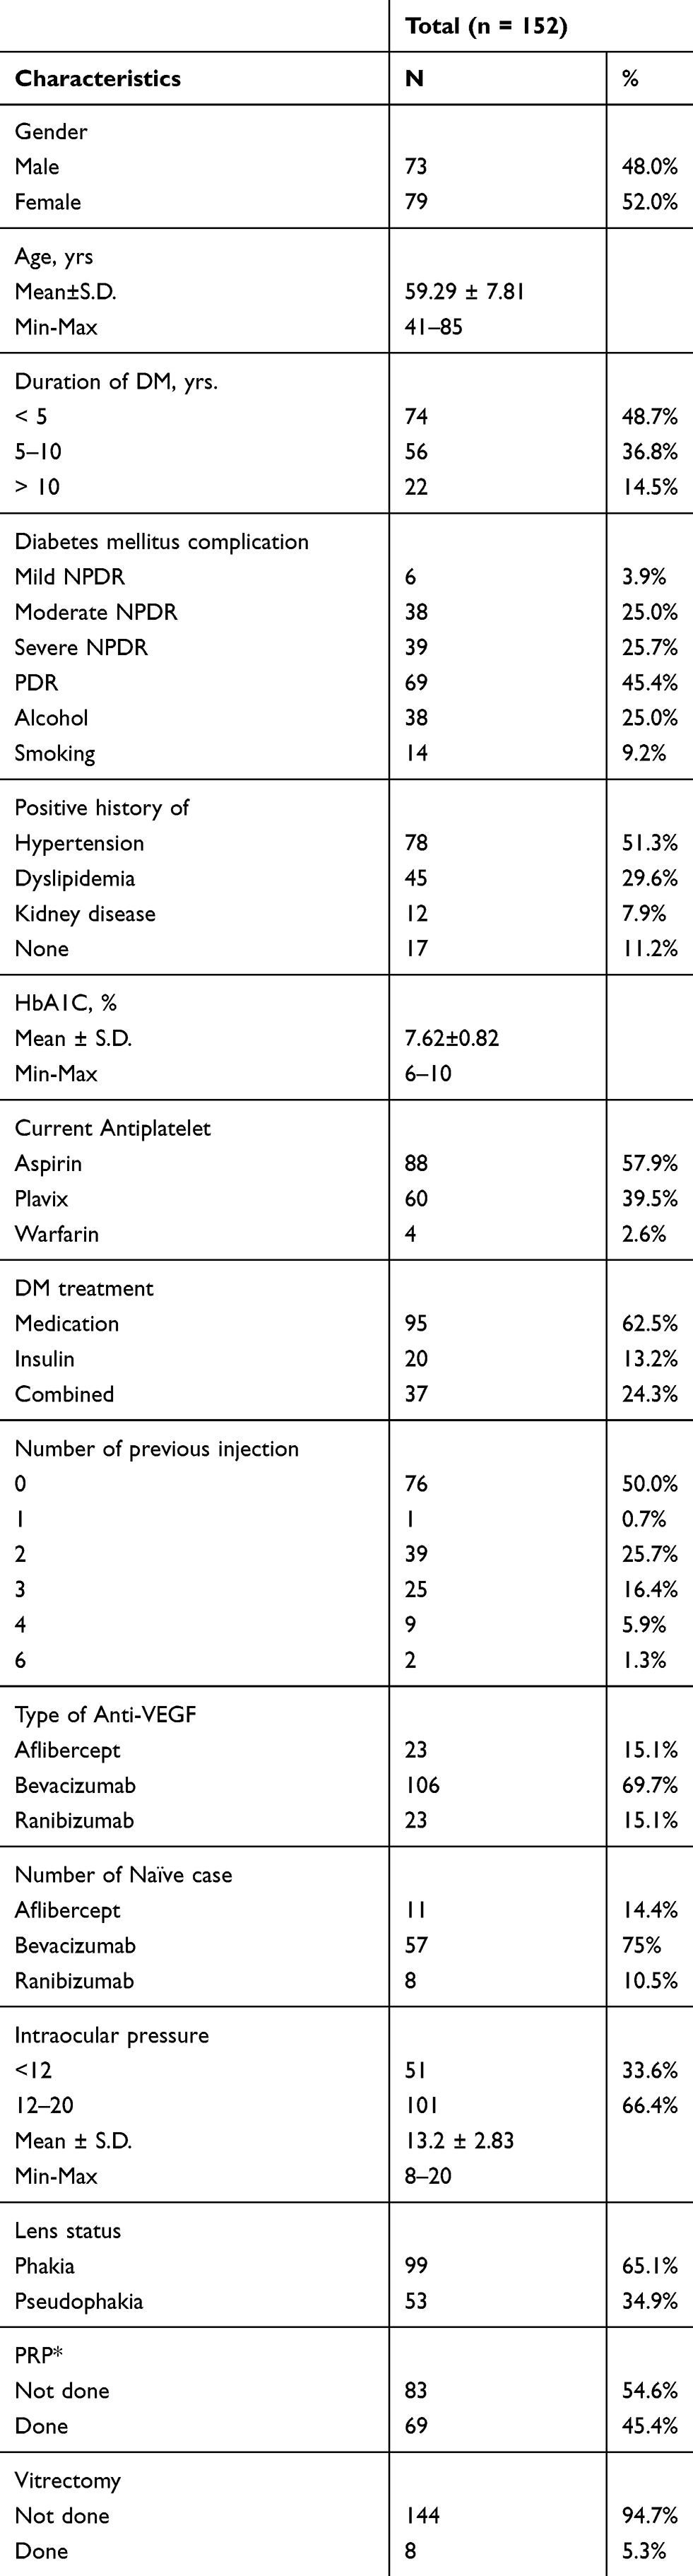 |
Table 1 Baseline Clinical Characteristics |
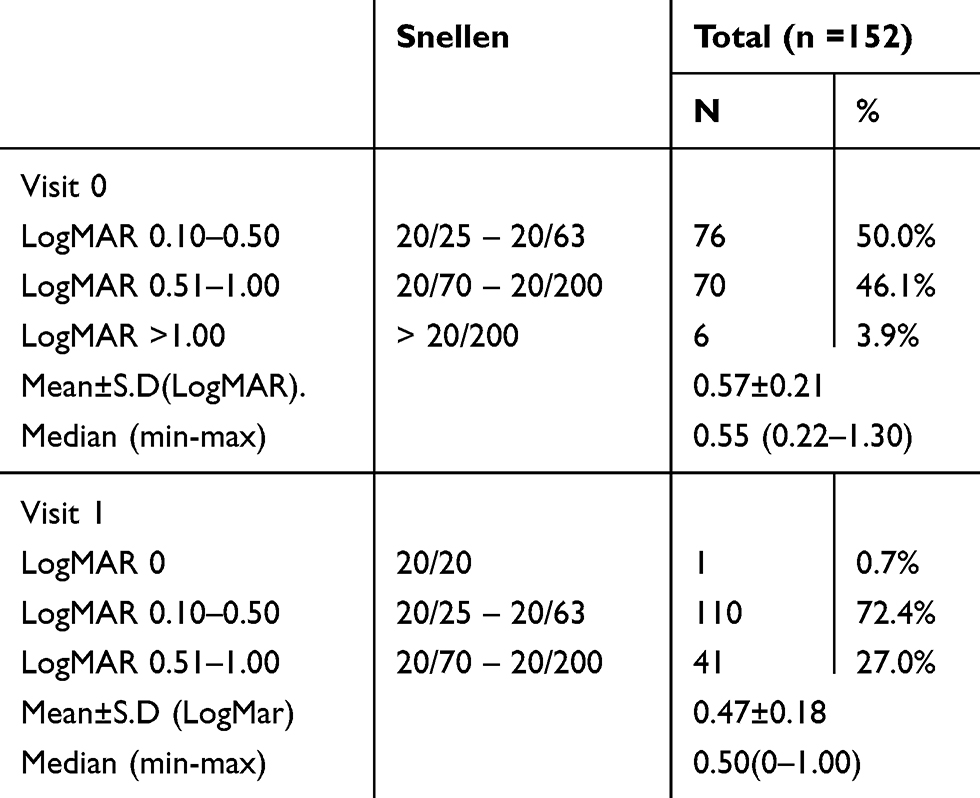 |
Table 2 Visual acuity before and one month after treatment with intravitreal anti-VEGF |
In a comparison of visits 0 and 1, a significant reduction in the FAZ area in the SCP and DCP was noted, with a mean difference of 0.064 mm2 (95% CI: 0.07–0.05, p<0.01) and 0.067 mm2 (95% CI: 0.07–0.05, p<0.01), respectively. A reduction in the number of MAs in SCP and DCP was also noted in association with all anti-VEGF medications (p<0.01) as shown in Table 3. This finding was correlated with the changes in the CMT with a rate ratio reduction of 0.64 (95% CI: 0.6–0.68), 0.61 (95% CI, 0.53–0.7), and 0.57 (95% CI, 0.5–0.65) for aflibercept, bevacizumab, and ranibizumab treatment, respectively. The CMT changes among the three groups were not significantly different (p=0.7). The overall MAs were reduced by 40% relative to baseline. Ranibizumab induced the highest MA reduction among the three treatment groups (p<0.01). MA reduction in the ranibizumab group was 44% lower (rate ratio, 0.56; 95% CI: 0.5–0.65; p<0.001). There is no statistically significant association of the MA reduction and changes of VA. Alteration of the FAZ area after treatment corresponded with the changes in visual acuity (p<0.01) in both the SCP (ΒZ=0.25; β=0.33; 95% CI: 0.10–0.56) and DCP (ΒZ=0.25; β=0.37; 95% CI: 0.10–0.56).
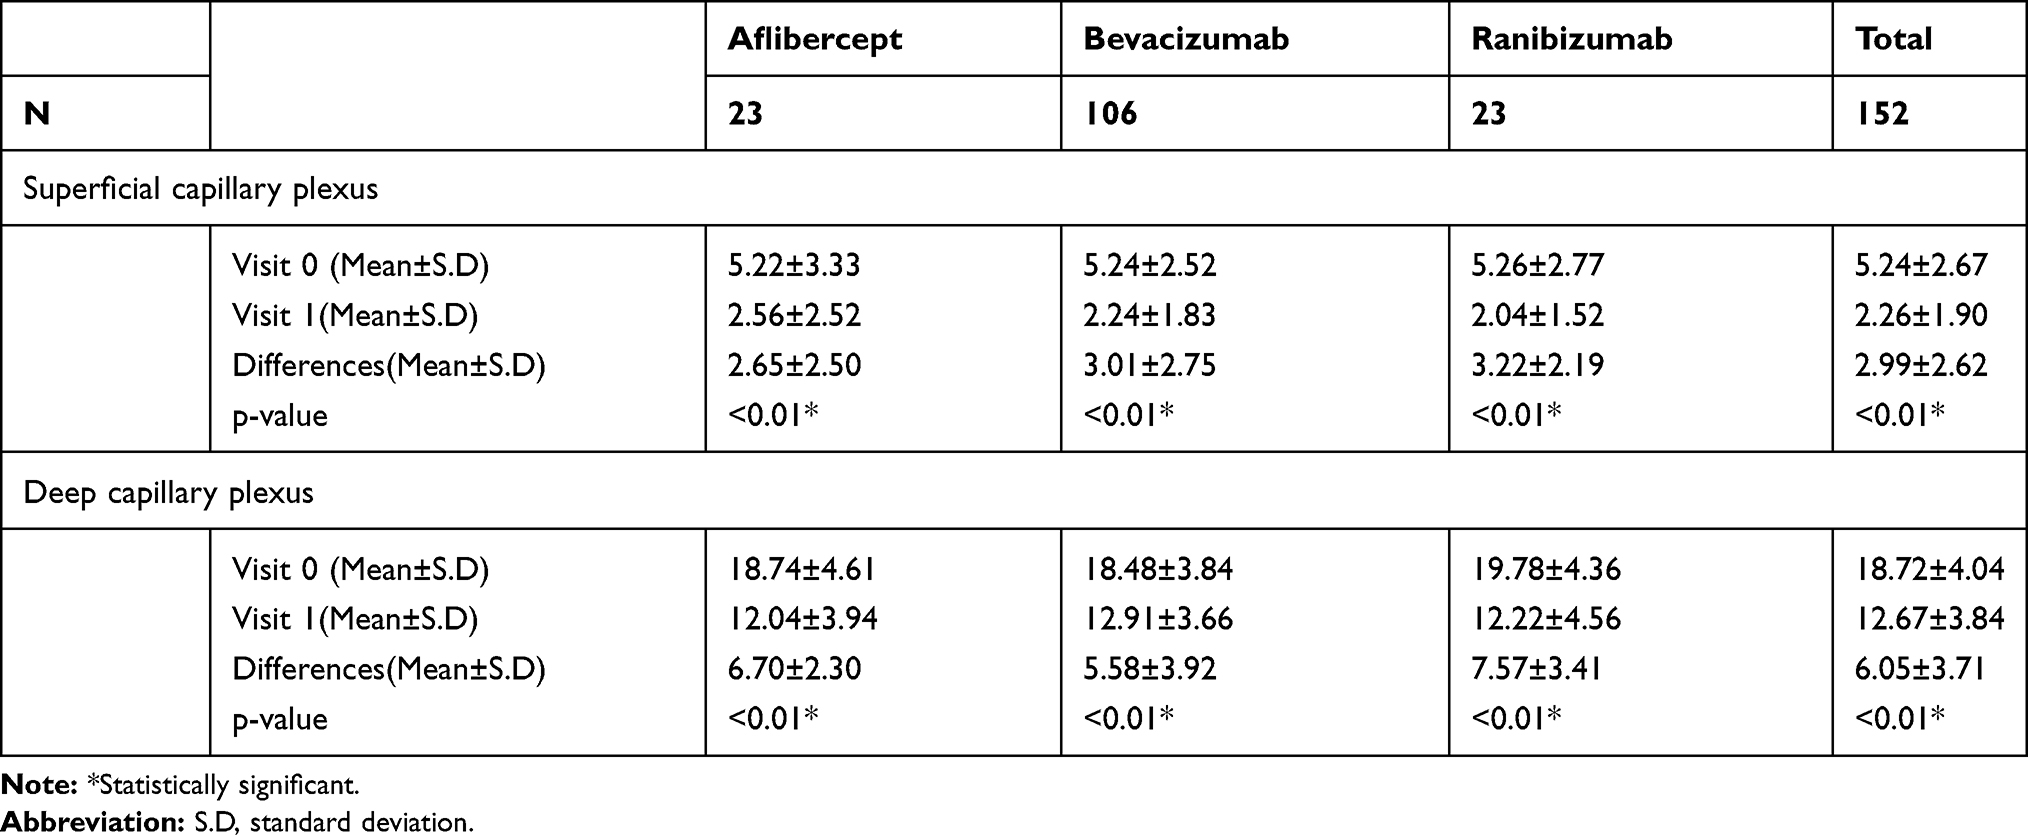 |
Table 3 Comparison of Microaneurysm Changes in Superficial Capillary Plexus and Deep Capillary Plexus Between 3 Anti-VEGF Treatments |
The overall amount of MAs was counted in locations related to fovea reference by ETDRS section which has 9 areas as shown in Figure 2, the highest number of MAs was located in area 9 in the foveal and parafoveal areas. The distribution of MA counts at visit 0 is shown in Figure 3. There were no significant differences in the amount of MAs in each quadrant according to ETDRS segment related to the center of fovea, where areas 2 and 6 were superior, areas 7 and 3 were temporal, areas 1 and 5 were nasal, areas 8 and 4 were inferior, and area 9 was central. At visit 0, the amount of MAs in the DCP was higher than that in the SCP with median differences in the superior, temporal, inferior, nasal, and center areas of 2, 2, 1, 1, and 2 MA counts, respectively. The center had the highest amount of MAs, followed by the superior and inferior areas. The nasal area had the least amount of MAs as shown in Table 4.
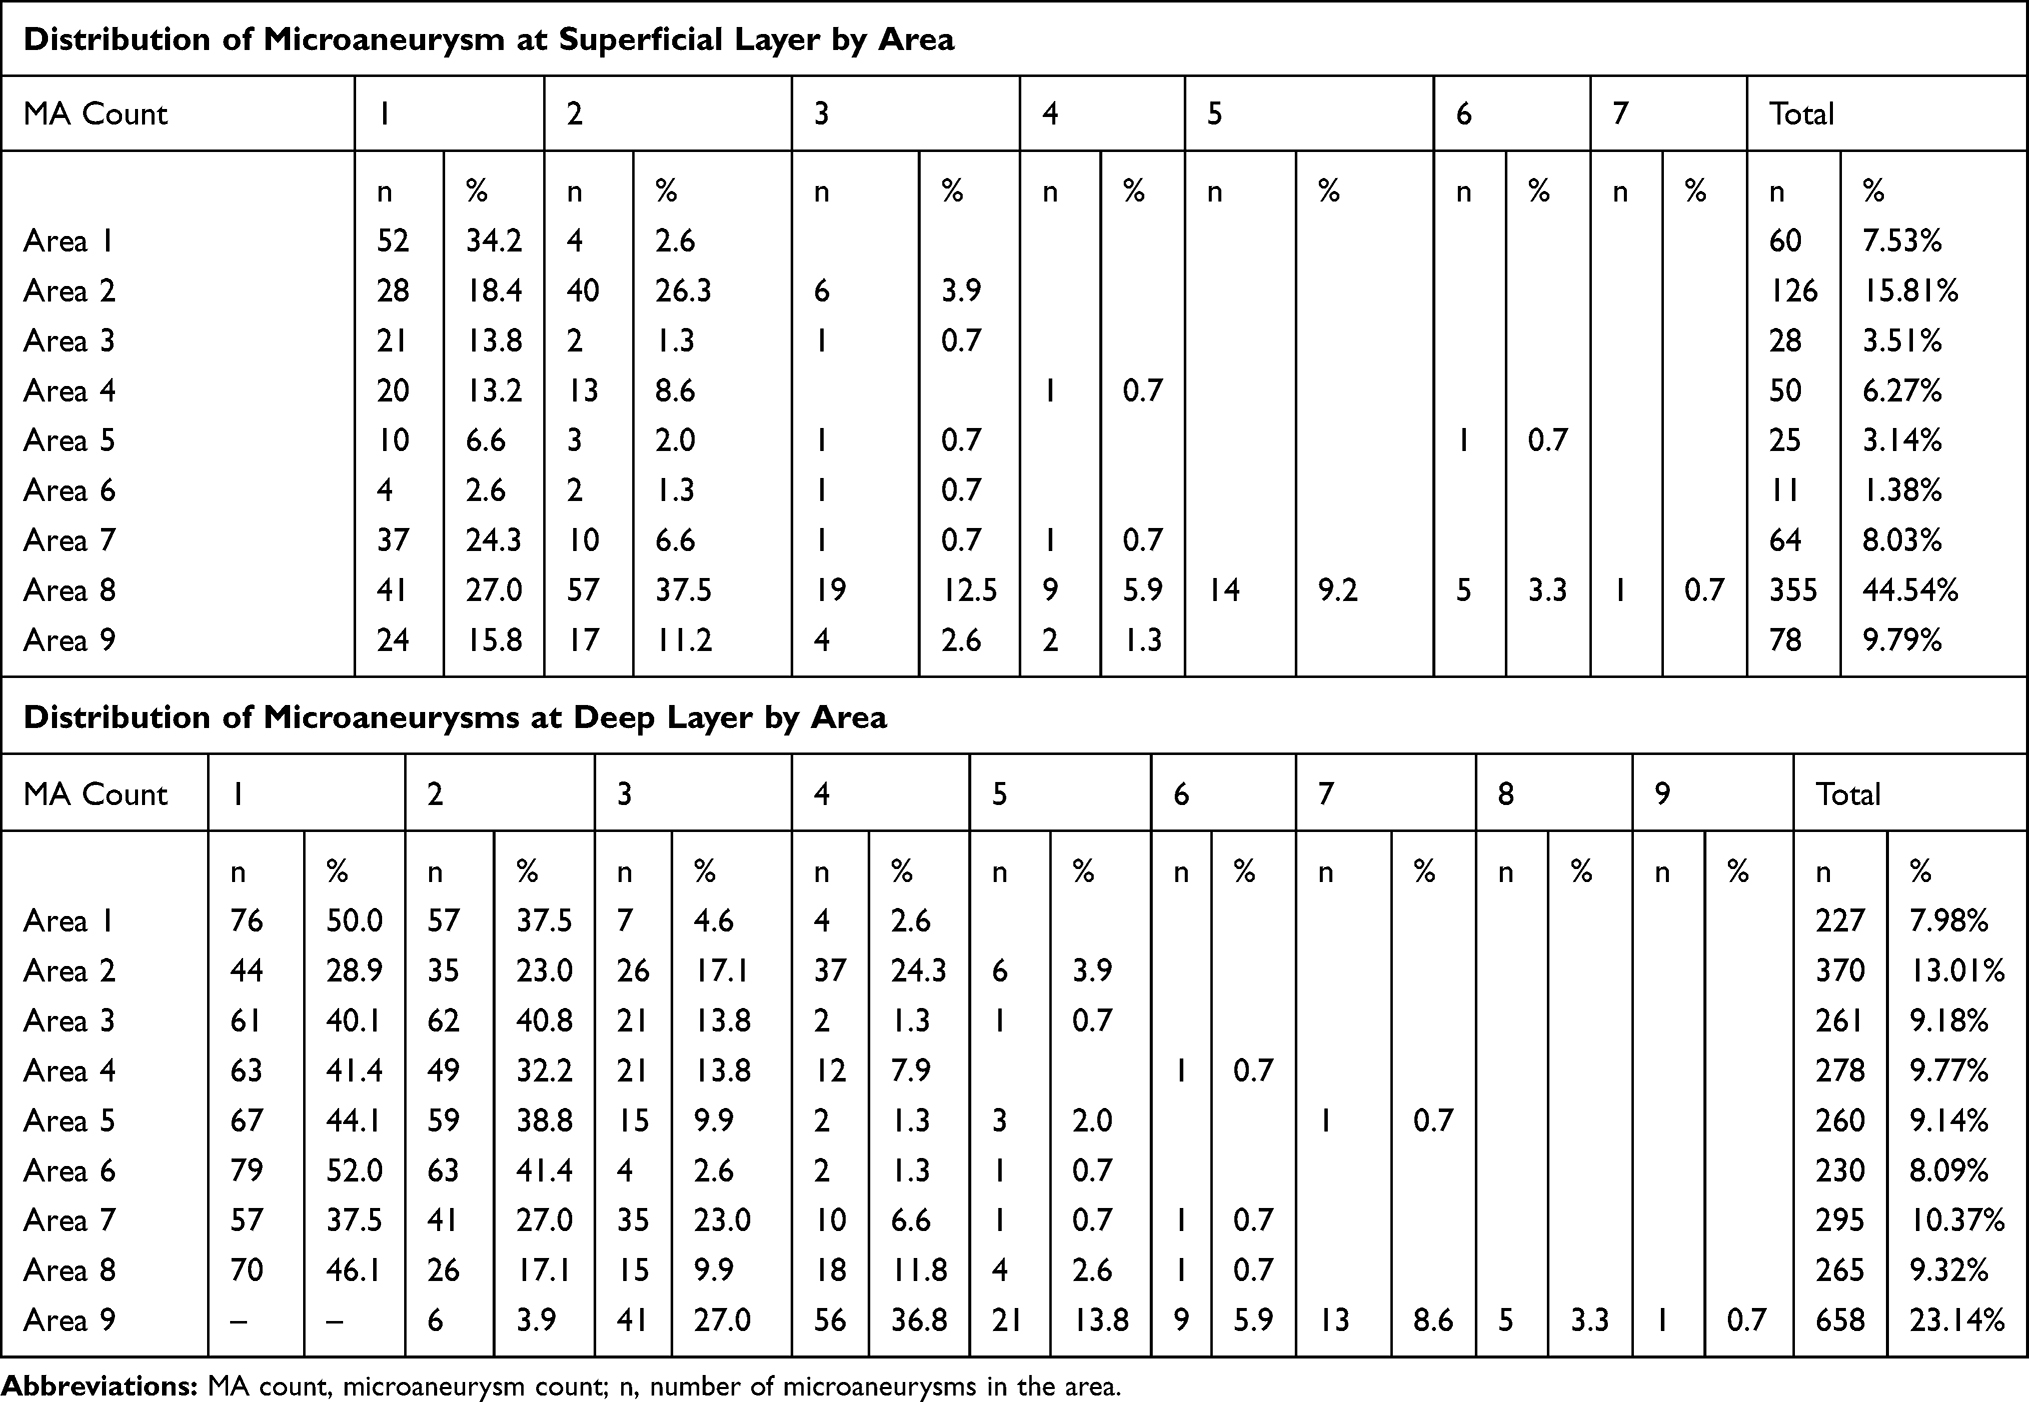 |
Table 4 Microaneurysm Counts in Location According to ETDRS Grid |
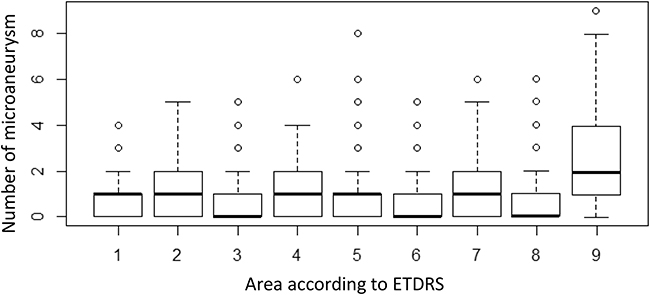 |
Figure 3 Demonstrates the count of microaneurysm in area according to location by ETDRS grid super impose on OCTA image. The area is shown in Figure 2. |
In subgroup analysis of naïve and non-naïve changes of MAs, there were 76 naïve eyes and 76 non-naïve eyes. Among those who were naïve, there was non-improvement in 23 eyes (30.2%). In those who were non-naïve, there was non-improvement for 38 eyes (50%). When the improvement between naïve and non-naïve groups in the center area is compared (area 9), the improvement in number of MAs in naïve group was higher when compared with non-naïve group in both SCP and DCP, but this was not statistically significant, with odds ratio 2.03 (95% CI: 0.70 –5.83) and odds ratio 2.31 (95% CI: 0.76 –7.00) respectively.
Discussion
The presence of microaneurysms is a biomarker that predicts the response to anti-VEGF therapy, the severity of DME,12 and progression of DR.13 Pappuru et al.14 performed a 2-year large observational study and found that an MA turnover rate of ≥6 was highly associated with the progression of the disease to center involvement of DME in the patients who were initially diagnosed with NPDR without DME. In this study, we investigated the number of MAs in the retinal SCP and DCP in patients with DR complicated by macular edema at baseline and after an intravitreal anti-VEGF injection using OCTA, and we found a significant reduction in the number of MAs and the FAZ area after short treatment. Carneiro et al.15 reported marked differences in systemic pharmacokinetics and pharmacodynamics among these three anti-VEGF treatments following intravitreal administration. Ranibizumab is available for the treatment of DME and has been shown to not only affect visual acuity and CMT but also to reduce the severity of DR.16 Therefore, we may assume that this fact is also reflected in MA turnover. However, not all retinal thickening in patients with DME is caused by MAs; fluid imbalance, loss of tissue integrity, and cytotoxic edema in response to tissue injury can produce retinal thickening which leads to the absence of FA leakage.17 Accordingly, in the present study we found that the average total number of MAs decreased the most in the ranibizumab group. However, because the nature of this observational study resulted in a different sample size in each treatment group and the lack of a control factor, this finding is not conclusive. Regardless, MAs are thought to be dynamic structures.18
Moore et al.19 used immunohistochemistry to perform a postmortem examination of human diabetic eyes and found that most of the MAs (approximately 80%) were derived from the inner nuclear layer and therefore were in the deeper part of the inner retinal capillary plexus. MAs are usually located in the inner-most portion of the inner plexiform layer, extending to the junction of the inner nuclear layer and outer plexiform layer.17,20 Couturier et al. reported OCTA of DR and demonstrated that the mean number of MAs located in the DCP and SCP was 4.4 and 2.9, respectively. Although these previous studies included diabetic eyes without DME, their findings were harmonious with our current results; they showed that 78% of the MAs were in the DCP, which is consistent with the result of this study in which MAs also are in this layer. Lee et al. also reported that the SCP in patients with DME was not different between anti-VEGF responders and nonresponders. Furthermore, the VEGF nonresponders showed greater damage in the FAZ and more MAs in the DCP. However, although DCP abnormality played a role in the development of DME, it was not significantly associated with the clinical severity of DR.12
DME-associated MAs are usually found adjacent to the cystoid space; only 10 –20% are found to protrude into the cystoid space.21 The cystoid spaces are also much more apparent on OCTA images of the DCP than SCP, which is consistent with the location of intraretinal fluid in histopathological studies of DME.22 In some patients with DME, central visual loss may not only be due to the macular edema itself but also to changes in the FAZ and retinal capillary alterations in the macula.23 However, FA cannot show the pathology in a layer-by-layer manner. The dye leakage pattern may obscure the details of the macular vessels.24 In addition, the effect of the appearance and disappearance of intraretinal fluid on the anatomy of the FAZ in eyes with DME is unclear because FA is invasive and thus difficult to perform at consecutive visits. Freiberg et al.25 and Takase et al.26 examined both the SCP and DCP and found more prominent changes in the FAZ area in the DCP of patients with DME than in healthy eyes. The enlarged FAZ area in the DCP could occur because (a) vascular changes secondary to DME occur more prominently in the DCP or (b) fluid accumulation in DME may cause a reflection effect on OCTA and loss of the OCT signal in the deeper layers. This may cause the FAZ to appear larger in the DCP, but the apparent enlargement in the FAZ might also be due to artifact. Our data are also consistent with recent studies. Several types of artifacts may affect the OCTA measurements, especially in eyes with ocular pathology. The findings of this study support those of previous studies in terms of the pathophysiologic finding of MAs in the retinal layer and help to understand the pathophysiology of different MA locations. Anti-VEGF treatment helped to reduce the number of MAs in conjunction with the reduction of CME and improvement of visual acuity. This study found no statistically significant changes of MAs in center area after treatment with VEGF when comparing between naïve DME and non-naïve DME (previous anti-VEGF injection). However, the sample size of this study does not give enough power to detect this association between these 2 subgroups.
The main limitation of this study is that it was an observational study which led to small and unequal numbers of treated eyes in the aflibercept and ranibizumab groups. The treatment selection was dependent upon the doctor’s preference and some patients had previous treatment which might interfere with the response to anti-VEGF treatment. The short follow-up period may not have been long enough to detect the magnitude of the efficacy of different drugs by OCTA findings. A longer prospective observation period and larger sample size might be needed to obtain more data to support our findings and compare the different between naïve and non-naïve DME OCTA characteristics. Furthermore, this study included only patients with DME who required treatment, which might explain why the highest number of MAs was located in the central area and caused foveal/perifoveal involvement of retinal thickening. Additionally, OCTA images themselves result from an automated algorithm might cause several artifacts that lead to misinterpretation of images.
Conclusion
OCTA can be used to detect MAs, which might serve as a biomarker for a clinical response to anti-VEGF treatment within a short follow-up duration. The FAZ area can also be used to predict improvement in visual acuity after anti-VEGF injection. Understanding the quantity of MAs withnon-invasive OCTA imaging can help in predicting the outcome of DME treatment. However, the present study did not show significant differences in the CMT or visual acuity among aflibercept, ranibizumab, and bevacizumab. We found that the most prominent changes in the FAZ area over time occurred in the DCP, which is consistent with the pathogenesis of DME and the current literature. We believe that MA analysis by OCTA may play an important therapeutic role in the management of DME.
Abbreviations
DME, diabetic macular edema; OCTA, optical coherence tomography angiography; FAZ, foveal avascular zone; NPA, capillary nonperfusion area; BRB, blood retinal barrier; VEGF, vascular endothelial growth factor; OCT, optical coherence tomography; FA, fluorescein angiography; DR, diabetic retinopathy; ICC, intraclass correlation coefficient; CSME, clinically significant macular edema.
Data Sharing Statement
Datasets generated and/or analyzed during this study are not publicly available but are available from the corresponding author on reasonable request.
Ethics Approval and Consent to Participate
This study has been approved by the institutional review board of the Faculty of Medicine; Chulalongkorn University; IRB number 395/59. All participants were informed and signed a written consent before enrolling in this study.
Acknowledgment
We thank Angela Morben, DVM, ELS, from Edanz Group (www.edanzediting.com/ac), for editing a draft of this manuscript.
Author Contributions
All authors made a significant contribution to the work reported, whether that is in the conception, study design, execution, acquisition of data, analysis and interpretation, or in all these areas; took part in drafting, revising or critically reviewing the article; gave final approval of the version to be published; have agreed on the journal to which the article has been submitted; and agree to be accountable for all aspects of the work.
Funding
The Ratchadapisek Sompoch Endowment Fund, Faculty of Medicine, Chulalongkorn University, provided grant number; RA 60/004. The funding institute had no part in setting up the study design analysis or in overseeing the results in the manuscript.
Disclosure
Pear Pongsachareonnont reports grants from Topcon Thailand, outside the submitted work. Pulthip Charoenphol reports grants from The Ratchadapisek Sompoch Endowment Fund, during the conduct of the study. None of the authors has any other potential conflicts of interest to report.
References
1. Das A, McGuire PG, Rangasamy S. Diabetic macular edema: pathophysiology and novel therapeutic targets. Ophthalmology. 2015;122(7):1375–1394. doi:10.1016/j.ophtha.2015.03.024
2. Nunes S, Pires I, Rosa A, Duarte L, Bernardes R, Cunha-Vaz J. Microaneurysm turnover is a biomarker for diabetic retinopathy progression to clinically significant macular edema: findings for type 2 diabetics with nonproliferative retinopathy. Ophthalmologica. 2009;223(5):292–297. doi:10.1159/000213639
3. Cai S, Bressler NM. Aflibercept, bevacizumab or ranibizumab for diabetic macular oedema: recent clinically relevant findings from DRCR. net Protocol T. Curr Opin Ophthalmol. 2017;28(6):636–643. doi:10.1097/ICU.0000000000000424
4. Stanga PE, Papayannis A, Tsamis E, Stringa F, Cole T, D'Souza Y, Jalil A. New Findings in Diabetic Maculopathy and Proliferative Disease by Swept-Source Optical Coherence Tomography Angiography. Dev Ophthalmol. 2016;56:113–21..
5. Matsunaga DR, Jack JY, De Koo LO, Ameri H, Puliafito CA, Kashani AH. Optical coherence tomography angiography of diabetic retinopathy in human subjects. Ophthalmic Surg Lasers Imaging Retina. 2015;46(8):796–805. doi:10.3928/23258160-20150909-03
6. Salz DA, Talisa E, Adhi M, et al. Select features of diabetic retinopathy on swept-source optical coherence tomographic angiography compared with fluorescein angiography and normal eyes. JAMA Ophthalmol. 2016;134(6):644–650. doi:10.1001/jamaophthalmol.2016.0600
7. Ishibazawa A, Nagaoka T, Takahashi A, et al. Optical coherence tomography angiography in diabetic retinopathy: a prospective pilot study. Am J Ophthalmol. 2015;160(1):35–44. e31. doi:10.1016/j.ajo.2015.04.021
8. Scarinci F, Nesper PL, Fawzi AA. Deep retinal capillary nonperfusion is associated with photoreceptor disruption in diabetic macular ischemia. Am J Ophthalmol. 2016;168:129–138. doi:10.1016/j.ajo.2016.05.002
9. Gill A, Cole ED, Novais EA, et al. Visualization of changes in the foveal avascular zone in both observed and treated diabetic macular edema using optical coherence tomography angiography. Int J Retina Vitreous. 2017;3(1):19. doi:10.1186/s40942-017-0074-y
10. de Carlo TE, Chin AT, Joseph T, et al. Distinguishing diabetic macular edema from capillary nonperfusion using optical coherence tomography angiography. Ophthalmic Surg Lasers Imaging Retina. 2016;47(2):108–114. doi:10.3928/23258160-20160126-02
11. De Carlo TE, Romano A, Waheed NK, Duker JS. A review of optical coherence tomography angiography (OCTA). Int J Retina Vitreous. 2015;1(1):5. doi:10.1186/s40942-015-0005-8
12. Lee J, Moon BG, Cho AR, Yoon YH. Optical coherence tomography angiography of DME and its association with anti-VEGF treatment response. Ophthalmology. 2016;123(11):2368–2375. doi:10.1016/j.ophtha.2016.07.010
13. Klein R, Meuer SM, Moss SE, Klein BE. The relationship of retinal microaneurysm counts to the 4-year progression of diabetic retinopathy. Arch Ophthalmol. 1989;107(12):1780–1785. doi:10.1001/archopht.1989.01070020862028
14. Pappuru RK, Ribeiro L, Lobo C, Alves D, Cunha-Vaz J. Microaneurysm turnover is a predictor of diabetic retinopathy progression. Br J Ophthalmol. 2019;103(2):222–226. doi:10.1136/bjophthalmol-2018-311887
15. Carneiro AM, Costa R, Falcao MS, et al. Vascular endothelial growth factor plasma levels before and after treatment of neovascular age-related macular degeneration with bevacizumab or ranibizumab. Acta Ophthalmol. 2012;90(1):e25–30. doi:10.1111/j.1755-3768.2011.02240.x
16. Kernt M, Cserhati S, Seidensticker F, et al. Improvement of diabetic retinopathy with intravitreal Ranibizumab. Diabetes Res Clin Pract. 2013;100(1):e11–13. doi:10.1016/j.diabres.2013.01.006
17. Blair NP, Shahidi M, Lai WW, Zelkha R. Correlation between microaneurysms and retinal thickness in diabetic macular edema. Retina (Philadelphia, Pa). 2008;28(8):1097. doi:10.1097/IAE.0b013e318177f8ec
18. Kohner EM, Dollery CT. The rate of formation and disappearance of microaneurysms i diabetic retinopathy. Eur J Clin Invest. 1970;1(3):167–171. doi:10.1111/j.1365-2362.1970.tb00613.x
19. Moore J, Bagley S, Ireland G, McLeod D, Boulton ME. Three dimensional analysis of microaneurysms in the human diabetic retina. J Anat. 1999;194(1):89–100. doi:10.1046/j.1469-7580.1999.19410089.x
20. Wang H, Chhablani J, Freeman WR, et al. Characterization of diabetic microaneurysms by simultaneous fluorescein angiography and spectral-domain optical coherence tomography. Am J Ophthalmol. 2012;153(5):861–867.e861. doi:10.1016/j.ajo.2011.10.005
21. Horii T, Murakami T, Nishijima K, Sakamoto A, Ota M, Yoshimura N. Optical coherence tomographic characteristics of microaneurysms in diabetic retinopathy. Am J Ophthalmol. 2010;150(6):840–848. e841. doi:10.1016/j.ajo.2010.06.015
22. Byeon SH, Chu YK, Hong YT, Kim M, Kang HM, Kwon OW. New insights into the pathoanatomy of diabetic macular edema: angiographic patterns and optical coherence tomography. Retina. 2012;32(6):1087–1099. doi:10.1097/IAE.0b013e3182349686
23. Conrath J, Giorgi R, Raccah D, Ridings B. Foveal avascular zone in diabetic retinopathy: quantitative vs qualitative assessment. Eye (London, England). 2005;19(3):322–326. doi:10.1038/sj.eye.6701456
24. Weinhaus RS, Burke JM, Delori FC, Snodderly DM. Comparison of fluorescein angiography with microvascular anatomy of macaque retinas. Exp Eye Res. 1995;61(1):1–16. doi:10.1016/S0014-4835(95)80053-0
25. Freiberg FJ, Pfau M, Wons J, Wirth MA, Becker MD, Michels S. Optical coherence tomography angiography of the foveal avascular zone in diabetic retinopathy. Graefes Arch Clin Exp Ophthalmol. 2016;254(6):1051–1058. doi:10.1007/s00417-015-3148-2
26. Takase N, Nozaki M, Kato A, Ozeki H, Yoshida M, Ogura Y. Enlargement of foveal avascular zone in diabetic eyes evaluated by en face optical coherence tomography angiography. Retina. 2015;35(11):2377–2383. doi:10.1097/IAE.0000000000000849
 © 2020 The Author(s). This work is published and licensed by Dove Medical Press Limited. The
full terms of this license are available at https://www.dovepress.com/terms
and incorporate the Creative Commons Attribution
- Non Commercial (unported, 3.0) License.
By accessing the work you hereby accept the Terms. Non-commercial uses of the work are permitted
without any further permission from Dove Medical Press Limited, provided the work is properly
attributed. For permission for commercial use of this work, please see paragraphs 4.2 and 5 of our Terms.
© 2020 The Author(s). This work is published and licensed by Dove Medical Press Limited. The
full terms of this license are available at https://www.dovepress.com/terms
and incorporate the Creative Commons Attribution
- Non Commercial (unported, 3.0) License.
By accessing the work you hereby accept the Terms. Non-commercial uses of the work are permitted
without any further permission from Dove Medical Press Limited, provided the work is properly
attributed. For permission for commercial use of this work, please see paragraphs 4.2 and 5 of our Terms.