Back to Journals » Clinical Interventions in Aging » Volume 11
The development and standardization of Self-assessment for Hearing Screening of the Elderly
Authors Kim G, Na W, Kim G, Han W ![]() , Kim J
, Kim J
Received 24 February 2016
Accepted for publication 9 April 2016
Published 16 June 2016 Volume 2016:11 Pages 787—795
DOI https://doi.org/10.2147/CIA.S107102
Checked for plagiarism Yes
Review by Single anonymous peer review
Peer reviewer comments 5
Editor who approved publication: Dr Richard Walker
Gibbeum Kim,1 Wondo Na,1 Gungu Kim,1 Woojae Han,2 Jinsook Kim2
1Department of Speech Pathology and Audiology, Hallym University Graduate School, Chuncheon, Republic of Korea; 2Division of Speech Pathology and Audiology, Research Institute of Audiology and Speech Pathology, College of Natural Sciences, Hallym Universtiy, Chuncheon, Republic of Korea
Purpose: The present study aimed to develop and standardize a screening tool for elderly people who wish to check for themselves their level of hearing loss.
Methods: The Self-assessment for Hearing Screening of the Elderly (SHSE) consisted of 20 questions based on the characteristics of presbycusis using a five-point scale: seven questions covered general issues related to sensorineural hearing loss, seven covered hearing difficulty under distracting listening conditions, two covered hearing difficulty with fast-rated speech, and four covered the working memory function during communication. To standardize SHSE, 83 elderly participants took part in the study: 25 with normal hearing, and 22, 23, and 13 with mild, moderate, and moderate-to-severe sensorineural hearing loss, respectively, according to their hearing sensitivity. All were retested 3 weeks later using the same questionnaire to confirm its reliability. In addition, validity was assessed using various hearing tests such as a sentence test with background noise, a time-compressed speech test, and a digit span test.
Results: SHSE and its subcategories showed good internal consistency. SHSE and its subcategories demonstrated high test–retest reliability. A high correlation was observed between the total scores and pure-tone thresholds, which indicated gradually increased SHSE scores of 42.24%, 55.27%, 66.61%, and 78.15% for normal hearing, mild, moderate, and moderate-to-severe groups, respectively. With regard to construct validity, SHSE showed a high negative correlation with speech perception scores in noise and a moderate negative correlation with scores of time-compressed speech perception. However, there was no statistical correlation between digit span results and either the SHSE total or its subcategories. A confirmatory factor analysis supported three factors in SHSE.
Conclusion: We found that the developed SHSE had valuable internal consistency, test–retest reliability, and convergent and construct validity. These results suggest that SHSE is a reliable and valid measure to represent the degree of hearing loss in the elderly.
Keywords: hearing screening, self-assessment, questionnaire, presbycusis, aging
Introduction
Hearing loss is the third most prevalent chronic disability in elderly people.1 Age-related hearing loss, or presbycusis, is estimated to exist in approximately two-thirds of people aged 70 years and older.2 The number of elderly who suffer from presbycusis worldwide is likely to increase rapidly as the population ages.3 Thus, presbycusis is a serious problem in an aging society and can threaten the elderly with another age-associated disability.
Researchers have argued that hearing loss may result from age-related changes in auditory processing (peripheral system)4,5 or reflect age-related deterioration in the cognitive processing of speech (central system)6,7 or both.8,9 Nevertheless, common audiometric results of presbycusis are interpreted as bilateral, symmetrical, and high-frequency hearing loss.10 Most elderly people with presbycusis experience difficulty in understanding speech, especially in noisy and reverberant enviroments.11 In addition, these individuals show some age-related cognitive decline.12 The occurrence of presbycusis causes a slowing of temporal auditory processing, and thus results in poor speech perception when a talker speaks at a slightly faster-than-normal tempo.12 Working memory is also influenced by the degree to which and rate at which one’s hearing ages.13 The negative effect from aging produces a smaller storage capacity for working memory than in younger adults and thus makes communication difficult, especially for the elderly with hearing loss. Indirectly, presbycusis may contribute to the isolation of elderly people by limiting their interaction at social gatherings and restricting their use of the phone.14 Regardless, presbycusis is often difficult to recognize due to its slow progress, so hearing aids are not sufficiently used and rehabilitation is inefficient.15 Thus, a more convenient and valid screening tool for hearing assessment is essential for the elderly.
Many contemporary researchers have developed self-assessment questionnaires for hearing-impaired listeners. Their products are widely used for patients who suffer from hearing loss and related dysfunctions in the audiology clinical setting.16 However, existing questionnaires have limitations, particularly when applied to the elderly. First, most of the questionnaires were not developed for patients with age-related hearing loss but for all adults with hearing impairment caused by noise, ototoxic drugs, and injury. For example, the Client-Oriented Scale of Improvement (COSI) asks the hearing-impaired patient to list five listening situations in which he or she experiences difficulty, and clinicians use this information in counseling and creating a plan for rehabilitation.17 Although COSI is a valid self-reporting questionnaire, it asks the patient to name five listening conditions with questions in an open-set format. Consequently, older people may have more trouble and need more time with this type of question than other adults with hearing loss. One of the most popular questionnaires, the Abbreviated Profile of Hearing Aid Performance (APHAP), is useful in quantifying the degree of difficulty caused by hearing loss in the adult patient,18 but it does not consider specific features of age-related hearing loss such as hearing difficulty with fast-rate speech and working memory ability. Second, large parts of the self-reporting questionnaires focus on evaluating performance with the use of a hearing aid under various listening situations. For example, the International Outcome Inventory for Hearing Aids (IOI-HA), which has been translated into 24 languages and is used globally, only includes seven items that measure whether hearing-impaired patients improve their listening ability after wearing hearing aids in daily life.19 Also, the Profile of Hearing Aid Benefits (PHAB),20 Satisfaction with Amplification in Daily Life (SADL),21 and Speech Spatial and Quality of Hearing Scale (SSQ)22 have been widely employed by hearing aid users. However, those self-assessment questionnaires do not apply to elderly people who suspect hearing loss and are non-hearing-aid users.16 Third, the questionnaires for the elderly developed so far mainly evaluate the negative effect of their hearing deficit on emotional and social problems. The Hearing Handicap Inventory for the Elderly (HHIE)23 and Korean Evaluation Scale for Hearing Handicap (KESHH)24 are representative of the questionnaires for elderly hearing-impaired patients. But, their focus is on physical condition, personal characteristics, and psychosocial and emotional issues induced by hearing loss. Thus, these scores provide a complex and comprehensive index rather than a direct evaluation of hearing loss. In summary, none of these questionnaires highlights the degrees of hearing loss relating directly to the nature of presbycusis. In this respect, the purpose of the present study was to develop and standardize a hearing screening tool for the elderly who want to check themselves for their degree of hearing loss. The results will provide a valuable self-assessment questionnaire, yielding opportunities for earlier clinical interventions and better treatment options.
Methods
Selection of items
Two hundred and ninety-two items were extracted from eleven questionnaires (eg, APHAP, COSI, GHABP, HHIA, HHIE, IOI-HA, KESHH, PHAB, SADL, SSQ) that are popular and commonly used in the audiology clinic and then classified by category in terms of listening environments. After redundant items within each category and items unrelated to presbycusis were eliminated, only 56 items remained. These 56 items were regrouped into four subcategories – general issues, distracting conditions, fast-rate speech, and working memory – which represent the most common problems for those with presbycusis.11,25 A preliminary version of the questionnaire was evaluated and revised by audiologists and gerontologists. Finally, the questionnaire, named the Self-assessment for Hearing Screening of the Elderly (SHSE), was developed having in mind the valid concerns of the elderly, such as being too time-consuming and them having too short an attention span. SHSE consists of 20 items under four subcategories: seven under general issues, seven under distracting conditions, two under fast-rate speech, and four under working memory. General issues include ordinary problems caused by sensorineural hearing loss such as loudness, information from high-frequency sound, clear speech, talker familiarity, speech understanding, and auditory feedback. Distracting conditions include hearing difficulty in poor listening situations such as with background noise, reverberation, a multitalker environment, and conditions without visual cues. Fast-rate speech refers to the difficulty of understanding speech when a talker speaks a little too fast. Finally, working memory represents the short-term memory ability in long and rehearsable listening situations.
The respondent’s task was to choose from a five-point response scale to indicate the number of occasions for which the statement was true. Each point consisted of both a descriptor and an associated percentage: never (0%), occasionally (25%), half the time (50%), almost always (75%), and always (100%). In the scoring process, the responses for these items were reversed so that all items with a high percentage score indicated a high possibility of problems due to presbycusis. Table S1 shows the questionnaire developed in the present study.
Participants
Eighty-three elderly subjects (54 males and 29 females) from the Chuncheon community volunteered to participate in this study. Their average age was 77.33 years, and the age range was 68–84 years. They all passed the normal criteria of the Korean version of the Mini Mental State Examination (MMSE-K).26 Also, the participants reported no history of ear surgery, head trauma, or any other age-related chronic disease. After the hearing screening, otoscopy examination, tympanometry, and pure-tone audiometry were conducted, the subjects were then classified into four groups based on their degree of hearing loss in decibels (dB HL; average threshold of 0.5, 1, 2 kHz).27 Among them, 25, 22, 23, and 13 participants were designated as normal hearing, mild, moderate, and moderate-to-severe sensorineural hearing loss, respectively. All subjects were native Korean speakers and signed an informed consent form before the experimental process began. After finishing the experiments, they were awarded US$30 for their participation. All procedures were approved by the Institutional Review Board of Hallym University (#HIRB-2015-012).
Experiment procedure
After completing the hearing screening tests, all participants were asked to respond to the 20 items on the SHSE. The questionnaire was administered again 3 weeks later by the same researcher to evaluate test–retest reliability. To measure the validity of the SHSE, three hearing tests were also conducted. First, to evaluate speech perception ability in a noisy listening situation, the Korean Speech Perception in Noise28 was performed at the subject’s most comfortable level of +3 dB signal-to-noise ratio with babble noise. Forty sentences were presented via a recorded CD and scored by percentage. Second, sentence materials from the Korean Speech Audiometry29 were used to estimate speech perception ability in a fast-rate speech condition. A 30% time-compressed condition was created by using Adobe Audition (Version 5.0; Adobe Systems, Inc., San Jose, CA, USA), and then the root mean square was applied to adjust the amplitude of each sentence. Also, 40 compressed sentences were presented to all subjects via recorded CD and scored by percentage. Third, the working memory function was assessed using a forward digit span test, which consisted of a string of consequent numbers from 0 to 9 in random order. The subject was asked to repeat the strings, and a tester determined a threshold at the level at which the subject committed two errors out of three attempts.
Statistical analysis
The statistical analysis was performed using SPSS software (Version 20; IBM Corporation, Armonk, NY, USA). To see a significant group difference in pure-tone average (PTA) and word recognition scores (WRS) for the four experimental groups, an analysis of variance was conducted and Scheffe multiple comparisons were applied. To confirm the internal consistency of SHSE, Cronbach’s α was used as an estimate of the reliability analysis. Pearson correlation analysis was used to measure test–retest reliability (test scores vs retest scores in the SHSE total), convergent validity (SHSE total scores vs PTA and WRS), and construct validity (SHSE and its subcategories vs three hearing tests). In the final analysis, the items were subjected to confirmatory factor analysis with principal axis factoring and varimax.
Results
Hearing threshold of subjects
Table 1 shows a summary of demographic data and hearing status including PTA and WRS among the four groups. A significant difference existed in PTA (F[3, 82] =283.512; P=0.000) and WRS (F[3, 82] =23.594; P=0.000) among the groups when using one-way analysis of variance. The mean of both PTA and WRS showed a significant group difference when Scheffe multiple comparisons were applied (P<0.05; Table 1).
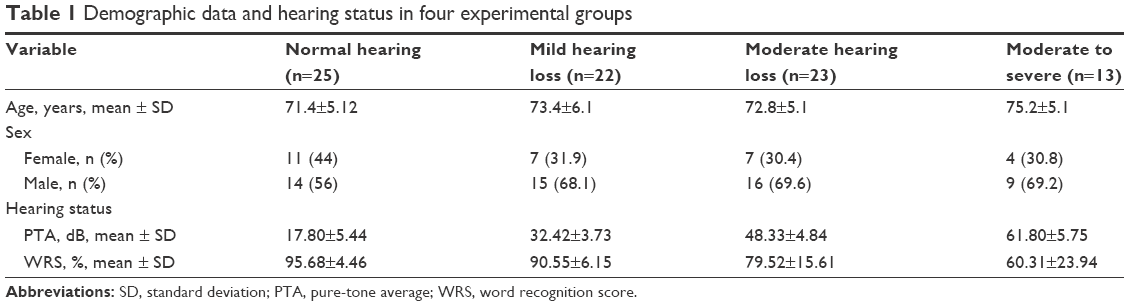 | Table 1 Demographic data and hearing status in four experimental groups |
Reliability of SHSE
Internal consistency
SHSE total scores showed a Cronbach’s α as high as 0.96, indicating high internal consistency. Each category of SHSE items was also calculated by Cronbach’s α. General issues, distracting conditions, fast-rate speech, and working memory were 0.87, 0.87, 0.75, and 0.80, respectively. This result confirmed that the four SHSE subcategories measure homogeneous content.
Test–retest reliability
Both SHSE’s total scores and its subcategories showed significant test–retest reliability (r=0.76–0.85; P=0.000), which indicated SHSE is a stable and consistent measurement even as time passes (Table 2).
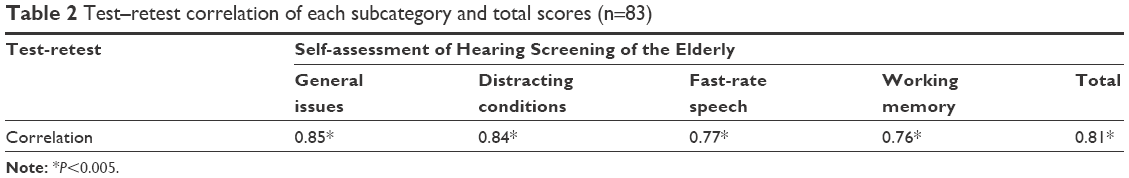 | Table 2 Test–retest correlation of each subcategory and total scores (n=83) |
Validity of SHSE
Convergent validity
A high positive correlation existed between SHSE total scores and PTA (r=0.83; P=0.000), and a high negative correlation existed between SHSE total scores and WRS (r=−0.71; P=0.000). That is, the SHSE scores can substitute for PTA and WRS, which typically estimate the degree of hearing loss in the clinic. A significant difference of SHSE total scores existed in the groups for test (F[3, 82] =28.709; P=0.000) and retest (F[3, 82] =26.842; P=0.000). In other words, as hearing loss increased, SHSE scores significantly increased. When applied for Scheffe multiple comparisons, the scores of the normal hearing group were significantly lower than those of the three hearing-impaired groups. The scores of the mild hearing-impaired group significantly differed from those of the moderate and moderate-to-severe groups. However, no significant difference appeared in scores between the moderate and moderate-to-severe groups (P>0.05).
Figure 1 illustrates the average percentage of SHSE total items in the four groups. Under test conditions, the normal hearing, mild, moderate, and moderate-to-severe groups scored 42.24% (standard deviation [SD] =11.19), 55.27% (SD =10.36), 66.61% (SD =17.06), and 78.15% (SD =7.03), respectively. Also, for the retest condition, the four groups showed similar results, 43.00% (SD =13.52), 55.91% (SD =13.29), 69.65% (SD =16.92), and 81.15% (SD =8.47).
 | Figure 1 Mean comparison of test and retest scores for SHSE as a function of degree of hearing loss. |
Construct validity
SHSE and its subcategories were used to analyze the correlation among scores of speech in noise, time-compressed speech, and forward digit span. They showed a high negative correlation with speech perception ability in noise (r=−0.50 to −0.68). This suggested that SHSE displayed higher scores as speech perception ability in noise deteriorated. Also, SHSE and its subcategories showed a moderately negative correlation with speech perception in fast-rate speech (r=−0.37 to −0.55), indicating that higher SHSE yielded lower scores for time-compressed speech. However, SHSE and its subcategories did not show a statistically significant correlation with the results of forward digit span (Table 3).
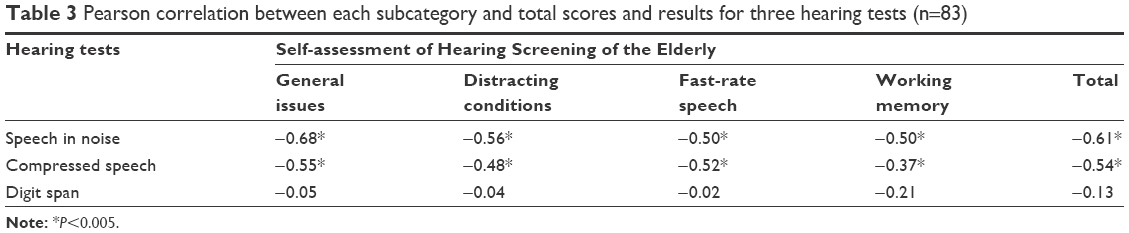 | Table 3 Pearson correlation between each subcategory and total scores and results for three hearing tests (n=83) |
Factor analysis of SHSE
Since the Kaiser–Meyer–Olkin measure of the sampling adequacy ratio of SHSE total items was 0.90, SHSE was quite appropriate for exploring the factor structure.30 While using principal axis factoring and varimax, the confirmatory factor analysis resulted in three factors. First, when applying the eigenvalue to determine the number of factors, three factors yielded 9.24 (factor 1), 1.45 (factor 2), 1.25 (factor 3), and the rest had an eigenvalue <1. Each factor revealed the variance as 46.18% for factor 1, 7.25% for factor 2, and 6.25% for factor 3. All three factors accounted for 59.67% of the variance (Table 4).
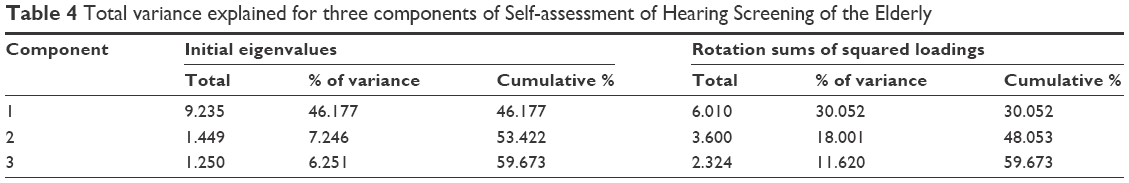 | Table 4 Total variance explained for three components of Self-assessment of Hearing Screening of the Elderly |
As a result of the factor analysis, the factor for distracting conditions consisted of ten items: six from the original category of distracting conditions, one from the general issues category, one from the working memory category, and two from the fast-rate speech category. The factor of general issues included all items from the original category of general issues, except for one item from the original distracting conditions category. The factor of working memory included three of four items from the previous categories (Table 5).
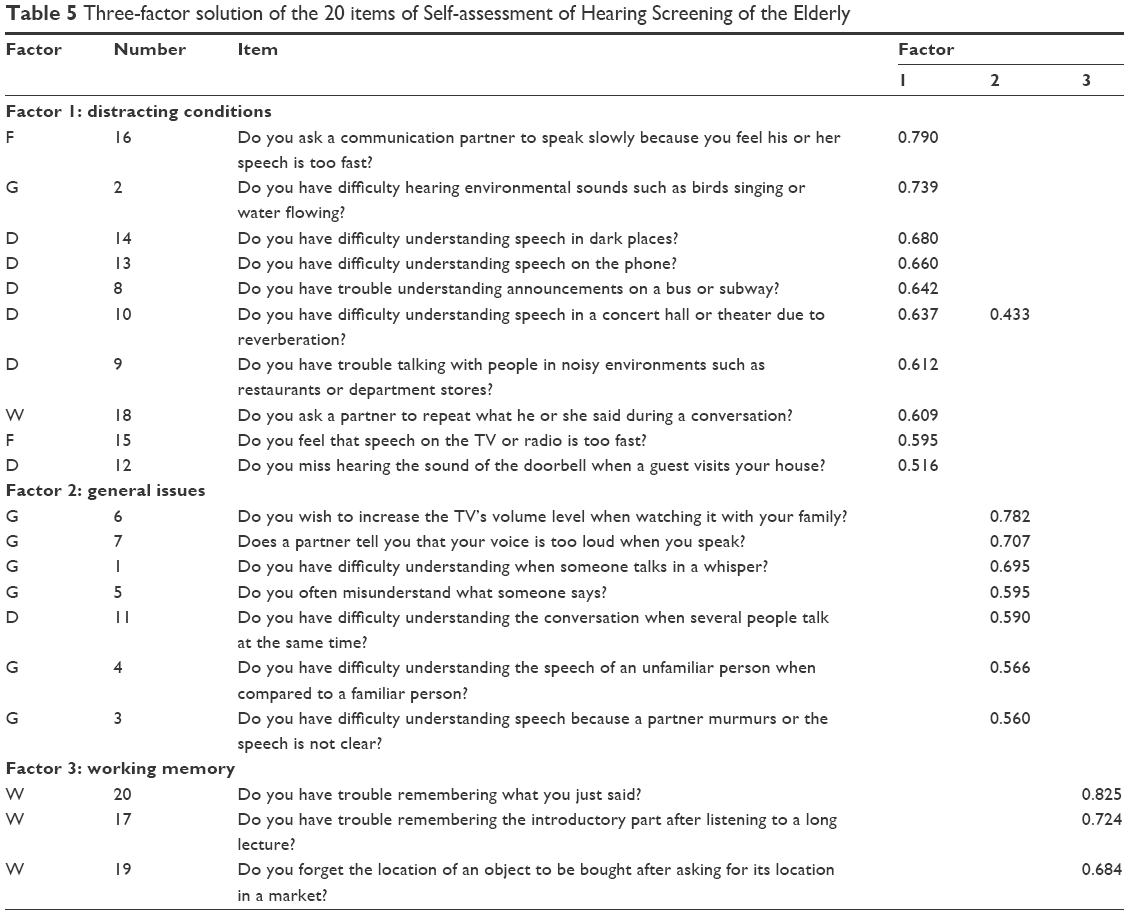 | Table 5 Three-factor solution of the 20 items of Self-assessment of Hearing Screening of the Elderly |
The item that had the highest factor loading for each factor is referred to as representative. The representative item describes the given factor well. For instance, the representative item for factor 1, distracting conditions, was number 16: “Do you ask a communication partner to speak slowly because you feel his or her speech is too fast?” For factor 2 of the general issues, the representative item was number 6: “Do you wish to increase the TV’s volume level when watching it with your family?” The representative item for factor 3, working memory, was number 20: “Do you have trouble remembering what you just said?” (Table 5). Interestingly, item number 10 was associated with both factors 1 and 2. However, because the result of the varimax rotation supported factor 1, the item is adequate for distracting conditions.
Discussion
Many developed countries estimate that presbycusis affects approximately 40% of the population older than 75 years.2,31 Health professionals anticipate that its prevalence will increase rapidly in the near future due to longer lives resulting from improved nutrition and greater access to health care.31,32 To respect their independence and reduce their financial burden, elderly people should have an easy and convenient opportunity to check themselves for their degree of hearing loss. The results from the self-assessment questionnaire will help them when they meet with health professionals and potentially give them access to early intervention and rehabilitation.33
According to the present study, the psychometric properties of SHSE appear to be acceptable because of good internal consistency and high test–retest reliability. Also, total SHSE scores corresponded highly to data obtained from the hearing test battery that has traditionally been used in the clinic, such as PTA and WRS, in terms of convergent and predictive validity. In particular, the scores of item number 1 (loudness), item number 3 (clear speech), item number 17 (working memory in listening), and item number 20 (working memory in speaking) systematically increased as hearing loss was greater. These results suggest, as we expected, that elderly listeners very often experience significant difficulty with noise,9 even though they have little difficulty in understanding speech in a quiet environment. When adding hearing loss, the aging effect is much worse for detecting and discriminating noise-masked acoustical cues such as consonants that have the energy of high frequencies.34 Consequently, it is effortful or tiring for the elderly to communicate with others in everyday life when surrounded by various types and levels of environmental noise.9 In addition, elderly people exhibit poor temporal processing in fast-rate speech tasks.35 Those factors, which are displayed in the items of distracting condition (factor 1), showed high statistical validity and marked characteristics of age-related hearing loss in the SHSE scores. Although there are only three items, working memory (factor 3), which is a cognitive function for speech recognition in the elderly, showed another feature of presbycusis. Vaughan and Letowski36 suggested that cognitive slowing may cause a reduced ability to perform the working memory function that processes incoming speech signals and to utilize its storage capacity. Cohen37 supported this opinion, asserting that in the peripheral and central auditory systems necessary for speech recognition, an overload of the function of working memory can contribute to the difficulties elderly people experience. Because hearing ability draws heavily on the working memory function responsible for both processing and temporary storage of information during the performance of cognitive tasks, one might expect age-related deficits in working memory capacity to have a different effect depending on the degree of hearing loss.9 In conclusion, the three factors of SHSE directly reflect the degree of presbycusis.
However, some limitations that warrant further study need explanation. For example, there was no significant difference in SHSE scores between moderate and moderate-to-severe hearing loss groups. The group with moderate-to-severe hearing loss might not have had enough members to show mean comparisons equally. In addition, because the total sample size is small for factor analysis regardless of whether there is good sampling adequacy or not, one cannot overlook the results of the current study. Second, our data showed no correlation between SHSE scores and the forward digit span test. Although the digit span scores can quantify the ability of working memory in the elderly because of significantly differentiating elderly subjects from young subjects,38 other measures should be added to support our results and evaluate working memory for elderly people with presbycusis. Third, factor analysis revealed that two items in the fast-rate speech category moved into distracting conditions. We need to discover why these items switched to another factor. This might be explained by the number of items being small. As another possibility, fast-rate speech is likely to be one of the factors in the distracting conditions, similar to noise, reverberation, and multitalker listening.35 Fourth, since we designed the test to classify the degree of hearing loss based on SHSE scores in hearing-impaired elderly people, we did not compare the scores with other previously developed self-reporting questionnaires in terms of concurrent validity. We expect that they will have a low correlation due to their different goals and contents; however, such a comparison will reinforce the current version of SHSE and also provide a better understanding of the nature of hearing impairment in elderly people. If possible, research should be extended to predict the hearing threshold at specific frequencies in presbycusis, as done in Hannula et al’s study,39 where they found a good correlation between self-reported hearing difficulties of patients with hyperausis and audiometric results of 4–8 kHz. Finally, a part of the statement in a few items should be modified because it was not appropriate to the culture or lifestyle of elderly people and required repetition or additional explanation during the experiment.
Despite the limitations mentioned, the paper-and-pencil profile can usually be completed in 7–10 minutes with 20 critical statements that yield a five-point scale quantifying the degree of hearing loss. Thus, SHSE seems well suited for application in the elderly people who want to evaluate themselves for hearing loss. Indeed, it is important to keep in mind that SHSE has been purposefully developed as a hearing screening tool for the elderly. Since the SHSE does not assess the social and emotional consequences of age-related hearing loss or the underlying personality attributes that might influence responses to a hearing impairment, in a further study, other questionnaires might accompany this one to measure comprehensively the problems of the elderly. We expect that continued study of responses from elderly people with presbycusis will provide numerous potential applications for SHSE. For example, SHSE can be translated into several languages for high utility globally. It is also accessible to the elderly via an online version, providing accurate scores and appropriate direction regarding the need to meet with health professionals and access to early intervention and rehabilitation.33
Acknowledgment
We are grateful to our subjects for their voluntary participation and their time in this experiment. Preliminary data of this work was presented at the 2016 Annual Conference of American Auditory Society (Scottsdale, AZ, USA). This research was completed with support from Hallym University Research Fund (HRF-201604-008).
Disclosure
The authors report no conflicts of interest in this work.
References
Lethbridge-Cejku M, Schiller JS, Bernadel L. Summary health statistics for US adults: National Health Interview Survey, 2002. Vital Health Stat 10. 2004;222:1–151. | ||
Zhan W, Cruickshanks KJ, Klein BE, et al. Generational differences in the prevalence of hearing impairment in older adults. Am J Epidemiol. 2010;171(2):260–266. | ||
Lin FR, Thorpe R, Gordon-Salant S, Ferrucci L. Hearing loss prevalence and risk factors among older adults in the United States. J Gerontol A Biol Sci Med Sci. 2011;66(5):582–590. | ||
Amos NE, Humes LE. Contribution of high frequencies to speech recognition in quiet and noise in listeners with varying degrees of high-frequency sensorineural hearing loss. J Speech Lang Hear Res. 2007;50:819–834. | ||
Humes LE, Roberts L. Speech-recognition difficulties of the hearing-impaired elderly: the contributions of audibility. J Speech Hear Res. 1990;33:726–735. | ||
Sommers MS. Speech perception in older adults: the importance of speech-specific cognitive abilities. J Am Geriatr Soc. 1997;45:633–637. | ||
van Rooij JC, Plomp R. Auditive and cognitive factors in speech perception by elderly listeners. III. Additional data and final discussion. J Acoust Soc Am. 1992;91:1028–1033. | ||
Humes LE. The contributions of audibility and cognitive factors to the benefit provided by amplified speech to older adults. J Am Acad Audiol. 2007;18:590–603. | ||
Pichora-Fuller MK, Schneider BA, Daneman M. How young and old adults listen to and remember speech in noise. J Acoust Soc Am. 1995;97(1):593–608. | ||
Liu XZ, Yan D. Ageing and hearing loss. J Pathol. 2007;211:188–197. | ||
Helfer KS, Laura AW. Hearing loss, aging, and speech perception in reverberation and noise. J Speech Hear Res. 1990;33(1):149–155. | ||
Pichora-Fuller MK, Singh G. Effects of age on auditory and cognitive processing: implications for hearing aid fitting and audiologic rehabilitation. Trends Amplif. 2006;10(1):29–59. | ||
Arehart KH, Souza P, Baca R, Kates JM. Working memory, age, and hearing loss: susceptibility to hearing aid distortion. Ear Hear. 2013;34(3):251–260. | ||
Ciorba A, Bianchini C, Pelucchi S, Pastore A. The impact of hearing loss on the quality of life of elderly adults. Clin Interv Aging. 2012;7:159–163. | ||
Davis A. Population study of the ability to benefit from amplification and the provision of a hearing aid in 55–74-year-old first-time hearing aid users. Int J Audiol. 2003;42(Suppl 2):2S39–2S52. | ||
Noble W. Self-Assessment of Hearing. 2nd ed. San Diego, CA: Plural Publishing; 2013. | ||
Dillon H, James A, Ginis J. Client Oriented Scale of Improvement (COSI) and its relationship to several other measures of benefit and satisfaction provided by hearing aids. J Am Acad Audiol. 1997;8:27–43. | ||
Cox RM, Alexander GC. The abbreviated profile of hearing aid benefit. Ear Hear. 1995;16(2):176–186. | ||
Cox RM, Alexander GC. The international outcome inventory for hearing aids (IOI-HA): psychometric properties of the English version. Int J Audiol. 2002;41(1):30–35. | ||
Cox RM, Rivera IM. Predictability and reliability of hearing aid benefit measured using the PHAB. J Am Acad Audiol. 1992;3(4):242–254. | ||
Cox RM, Alexander GC. Measuring satisfaction with amplification in daily life: the SADL scale. Ear Hear. 1999;20(4):306–320. | ||
Gatehouse S, Noble W. The speech, spatial and qualities of hearing scale (SSQ). Int J Audiol. 2004;43(2):85–99. | ||
Ventry IM, Weinstein BE. The hearing handicap inventory for the elderly: a new tool. Ear Hear. 1982;3(3):128–134. | ||
Ku HR, Kim JS. The development of the Korean evaluation scale for hearing handicap (KESHH) for the geriatric hearing loss. J Korea Gerontol Sci. 2010;30(3):973–992. | ||
Gordon-Salant S. Hearing loss and aging: new research findings and clinical implications. J Rehabil Res Dev. 2005;42(4):9–24. | ||
Kwon YC, Park JH. Korean version of mini-mental state examination (MMSE-K). Part I: development of the test for the elderly. J Korean Neuropsychiatr Assoc. 1989;28:125–135. | ||
Jerger J, Jerger S. Measurement of hearing in adults. In: Paperella NN, Shumrick DA, editors. Otolarybgology. 2nd ed. Philadelphia, PA: W B Saunders; 1980. | ||
Kim JS, Bae SY, Lee JH. Development of a test of Korean speech intelligibility in noise (KSPIN) using sentence materials with controlled word predictability. Korean J Speech Sci. 2000;7(2):37–50. | ||
Jang HS, Lee JH, Lim DW, Lee KW, Jeon AR, Jung EJ. Development of Korean standard sentence lists for sentence recognition tests. Audiology. 2008;4:161–177. | ||
Thompson B. Exploratory and Confirmatory Factor Analysis: Understanding Concepts and Applications. Washington, DC: American Psychological Association; 2004. | ||
Roth TN, Hanebuth D, Probst R. Prevalence of age-related hearing loss in Europe: a review. Eur Arch Otorhinolaryngol. 2011;268:1101–1107. | ||
Lin FR, Yaffe K, Xia J, et al; Health ABC Study Group. Hearing loss and cognitive decline among older adults. JAMA Intern Med. 2013;173:293–299. | ||
CHABA. Speech understanding and aging. Working Group on Speech Understanding and Aging. Committee on Hearing, Bioacoustics, and Biomechanics, Commission on Behavioral and Social Sciences and Education, National Research Council. J Acoust Soc Am. 1988;83(3):859–895. | ||
Lee JH. Age-related deficits in the processing of fundamental frequency differences for the intelligibility of competing voices. Korean J Audiol. 2013;17(1):1–8. | ||
Gordon-Salant S, Fitzgibborn P. Effects of stimulus and noise rate variability on speech perception by younger and older adults. J Acoust Soc Am. 2004;115(4):1808–1817. | ||
Vaughan NE, Letowski T. Effects of age, speech rate, and type of test on temporal auditory processing. J Speech Lang Hear Res. 1997;40(5):1192–1200. | ||
Cohen G. Inferential reasoning in old age. Cognition. 1981;9:59–72. | ||
Cervera TC, Soler MJ, Dasi C, Ruiz JC. Speech recognition and working memory capacity in young-elderly listeners: effects of hearing sensitivity. Can J Exp Psychol. 2009;63(3):216–226. | ||
Hannula S, Bloigu R, Majamaa K, Sorri M, Maki-Torkko E. Self-reported hearing problems among older adults: prevalence and comparison to measured hearing impairment. J Am Acad Audiol. 2011;22(8):550–559. |
Supplementary material
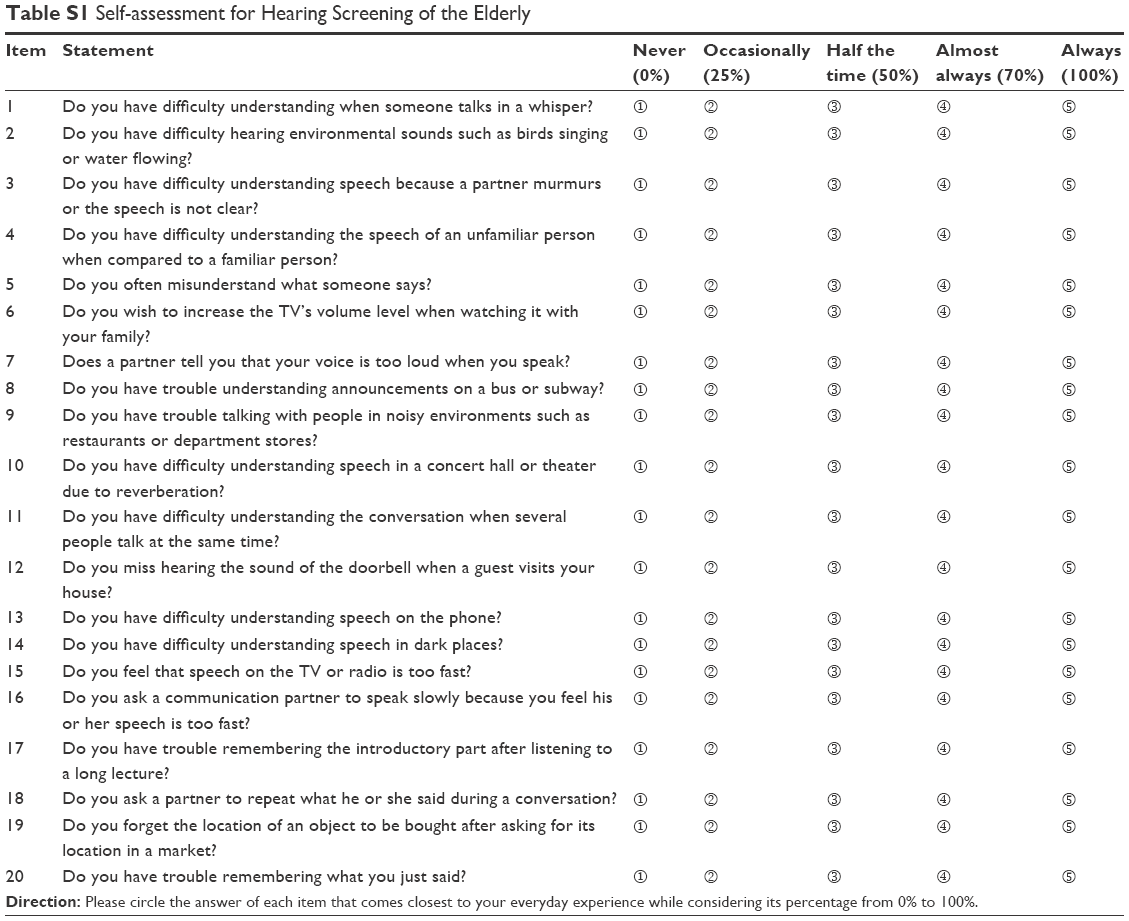 | Table S1 Self-assessment for Hearing Screening of the Elderly |
 © 2016 The Author(s). This work is published and licensed by Dove Medical Press Limited. The
full terms of this license are available at https://www.dovepress.com/terms
and incorporate the Creative Commons Attribution
- Non Commercial (unported, 3.0) License.
By accessing the work you hereby accept the Terms. Non-commercial uses of the work are permitted
without any further permission from Dove Medical Press Limited, provided the work is properly
attributed. For permission for commercial use of this work, please see paragraphs 4.2 and 5 of our Terms.
© 2016 The Author(s). This work is published and licensed by Dove Medical Press Limited. The
full terms of this license are available at https://www.dovepress.com/terms
and incorporate the Creative Commons Attribution
- Non Commercial (unported, 3.0) License.
By accessing the work you hereby accept the Terms. Non-commercial uses of the work are permitted
without any further permission from Dove Medical Press Limited, provided the work is properly
attributed. For permission for commercial use of this work, please see paragraphs 4.2 and 5 of our Terms.