Back to Journals » Pharmacogenomics and Personalized Medicine » Volume 15
The Cyp2b6 Gene Polymorphism and Phenotypic Correlation of Efavirenz-Based Combination Therapy Among the Niger Delta Ethnic Population: Implications in Modern Pharmacogenomics
Authors Bunu JS ![]() , Azibanasamesa DC Owaba, Vaikosen EN, Ebeshi BU
, Azibanasamesa DC Owaba, Vaikosen EN, Ebeshi BU
Received 18 October 2021
Accepted for publication 5 January 2022
Published 25 January 2022 Volume 2022:15 Pages 45—54
DOI https://doi.org/10.2147/PGPM.S345038
Checked for plagiarism Yes
Review by Single anonymous peer review
Peer reviewer comments 2
Editor who approved publication: Dr Martin H Bluth
Samuel J Bunu, Azibanasamesa DC Owaba, Edebi N Vaikosen, Benjamin U Ebeshi
Department of Pharmaceutical and Medicinal Chemistry, Faculty of Pharmacy, Niger Delta University, Wilberforce Island, Bayelsa State, Nigeria
Correspondence: Samuel J Bunu Tel +2348069703966
Email [email protected]
Purpose: DNA polymorphism describes the difference between individuals, groups, or ethnicities, races, etc., in terms of their DNA sequences or phenotypes as relates to drug metabolism. Using predictive genotyping of drug-metabolizing genes, we can develop individuals’ drug therapies that are less toxic and more effective. The main aim of the study was to evaluate genotype–phenotype-based correlation and incidence of genetic polymorphism of efavirenz blood levels among HIV/AIDS patients of the Niger Delta population.
Methods: A study questionnaire was designed to obtained patients’ data, blood samples were obtained, plasma was separated from the serum using a centrifuge for 5 minutes at 4000 rpm for HPLC analysis, polymerase chain reaction (PCR) and restriction fragment length polymorphism (RFLP) analysis was conducted using Bsrl endonuclease enzyme to digest the PCR amplicons. Standard efavirenz was used at 0.5, 1, 2, 4, 16 mg/L to construct a calibration curve. Data were analyzed with SPSS software using chi-square test at p-value ≤ 0.5 and Microsoft excel 2013, while PCR and RFLP results were obtained after 1% Agarose gel electrophoresis, respectively.
Results: Phenotypic results showed that the participants had different efavirenz plasma concentrations. Six subjects (12%) had efavirenz plasma levels below 0.10 mg/L, considered ultra-rapid metabolizers (UMs), 22 (44%) 0.10 mg/L to 0.90 mg/L, classified as extensive metabolizers (EMs), 19 (38%) had 1.0 to 3.9 mg/L and were noted as intermediate metabolizers (IM), while 3 (6%) subjects showed efavirenz plasma levels from 4.0 mg/L to 6.0 mg/L, categorized as poor metabolizers (PM). RFLP results showed more than half of the population (56%) with a homozygous wild-type gene with CYP2B6*1*1 allele, 38% were CYP2B6*1*6 (heterozygous mutant) allele and 6% had homozygous mutant gene (CYP2B6*6*6 allele). Out of the 15 male subjects among the 50 patients that participated in the study, 8% were UM, 12% EM, 14% IM while no PM was observed, on the contrary, out of the 35 females participated in the study, 4% were observed as UM, 32% EM, 24% IM, while 6% were PM.
Conclusion: There was no significant difference (p ≤ 0.05) between genotype and phenotype data for CYP2B6 polymorphism, among the HIV/AIDS patients that participated in this study. Genetic polymorphism of the CYP2B6 gene is prevalent among HIV/AIDs patients in the Niger Delta ethnic population on efavirenz-based HAART treatment, as the population having homozygous mutant gene or PM are > 1% (6%).
Keywords: Antiretroviral, NNRTIs, CYP2B6, Genetic polymorphism, efavirenz, phenotype
Introduction
By maximizing medication regimens using precision medicine approaches, modern medicine offers powerful techniques for optimizing treatment.1 As the name implies, precision medicine refers to prescribing individual therapeutic regimes based on one’s genetic makeup.2 The use of pharmacogenetics to identify genetic biomarkers that predict individual responses to medications has been studied.3 The Cytochrome P450 enzymes metabolize over 70% of clinically prescribed drugs worldwide, and pharmacogenetic studies have mainly focused on polymorphisms of genes encoding these enzymes.4
Efavirenz, (4S)-6-chloro-4-(2-cyclopropylethynyl)-4-(trifluoromethyl)-2, 4-dihydro-1H-1,3-benzoxazin-2-one), pharmacokinetics is associated with a long steady-state half-life of 40–55 hours, which is suitable for a once-daily dose.5 A threefold increase in oral clearance has been observed after multiple administrations of efavirenz due to its self-metabolism-inducing ability.6 Likewise, intermediate plasma efavirenz levels have been associated with therapeutic failure and can result in viral resistance, while levels at or above 4 mg/L increase the risk of neuropsychiatric adverse effects.7 Studies have also reported that efavirenz concentration inside cells as well as the genotype of CYP2B6 were predictors of neuropsychological toxicity. In addition, these authors suggested that CYP2B6 genotyping may be useful as a complement to individualized strategies derived from plasma drug levels to improve safety and reduce side effects associated with efavirenz. It was observed in Nigerians that no significant differences existed between wild type and the genotype (P≤ 0.05) for CYP2B6*6 and CYP2D6.8,9 Since there are platforms that can massively detect single-nucleotide polymorphisms (SNPs), these genetic differences are better characterized.10 There is a strong impact of HIV/AIDS on society; especially when considering the issue of discrimination against immunocompromised people. Also, it has indirect and direct economic consequences.11 There are guidelines of WHO for the use of Highly Active Anti-Retroviral Treatment (HAART) in sub-Saharan African countries.12 Clinical correlations have been found for the variants of CYP2B6 in numerous studies. In a population pharmacokinetic analysis, significant interindividual differences in bioavailability of efavirenz were observed, as well as an inverse correlation between exposure levels and central nervous system toxicities.13
In contrast to cloning and propagation from host cells, polymerase chain reaction provides an excellent molecular technique for amplification of a specific segment of DNA.14 DNA sequence variations can be used to analyze restriction fragment length polymorphism (RFLP). Gel electrophoresis is used to separate fragments of DNA following restriction digestion by enzymatic restriction endonuclease (RE). Both alleles can be identified using RFLP markers in heterozygous samples and are highly locus-specific.15 In addition to PCR-RFLP, another analytical technique used was high-performance liquid chromatography (HPLC), an important analytical approach used in chemical and biochemical analysis. This method was used to determine the plasma levels of efavirenz among the study population.16 Therefore, the study aimed to evaluate genotype, and phenotype-based correlation, and incidence of genetic polymorphism of efavirenz blood levels among HIV/AIDS positive patients.
Materials and Methods
Subjects
Fifty (50), HIV/AIDs positive not related patients consisting of males (15) and females (35), age 18 years and above, who were receiving efavirenz (600mg daily) in combination with either tenofovir and lamivudine or tenofovir with zidovudine, respectively, that met the study inclusion criteria, were randomly selected from the various ethnic groups in Niger Delta consisting of Akwa Ibom (9, 18%), Bayelsa (15, 3%), Cross River (6, 12%), Delta (7, 14%), Edo (5, 10%), Rivers (8, 16%). Details of the study procedures were explained to the potential subjects after which, they were allowed to make an independent decision whether or not to participate in the study. Qualified subjects were enrolled and signed the consent form.
Sampling and Genomic DNA Preparation
Blood samples (5mL) were collected from all participants who had received 600 mg of efavirenz for at least 3 weeks, using venous-puncture into EDTA tubes clearly labeled with the participant’s name. 2.0 mL was used for the genotyping, while 3.0 mL for HPLC analysis. The whole blood (3.0 mL) was centrifuged for 10 minutes at 10,000 rpm to produce plasma, which was then pipetted into EDTA tubes and heated for 60 minutes at 60°C to inactivate the HIV. After collection, blood samples and plasma were frozen at −20°C until further analysis. The remaining 2.0 mL of blood was used for genotyping procedures. Quick-DNA Blood Miniprep Kits (Inqaba Biotec, West Africa) was used to prepare the DNA. The frozen blood samples were thawed at normal room temperature (20°C) and 100 µL of blood was transferred to a polypropylene tube. On a separate tube rack, four sets of tubes were arranged, with each set labeled for a particular sample. The third tube set was added with a column and the fourth set with a secure label (tubes and columns are provided). We added 650 µL of Genomic lysis buffer and vortexed it for 4–6 seconds before letting it stand at 20°C for 6–10 minutes. The mixture was transferred to a Zymo-Spin Column in a collection tube and centrifuged at 10,000 rpm for about 1 minute. The collection tube was discarded with the flow-through. The Zymo-Spin Column was transferred into a new collection tube; 200 µL of DNA Pre-Wash Buffer was added to the spin column and was centrifuged at 10,000 rpm for one minute and 500 µL of gDNA wash buffer was added to the spin column and centrifuged at 10,000 rpm for another one minute. The spin column was transferred to a clean microcentrifuge tube and 50 µL DNA elution buffer was added to the spin column. Thereafter, the tube was incubated at room temperature for 2–5 minutes and then centrifuged at top speed for 30 seconds to elute the DNA. The eluted DNA purity, yield, UV/Vis absorbance, and ratio were quantified using the NanoDrop-1000 Spectrophotometer. DNA samples were then stored at 4°C before genotyping analysis and aliquots of the samples were stored at −20°C for further analysis.
Genotyping
DNA quantification was done using a Nanodrop-1000 spectrophotometer following the method by Bunu et al.17 The genotyping of CYP2B6 was performed using standard polymerase chain reaction-restriction fragment length polymorphism (PCR-RFLP) techniques following the method of Rotger et al18 validated by Ebeshi et al.9 The sequences for the reverse and forward primers for CYP2B6*6 were 5’-GGTCTGCCCATCTATAAAC-3’ (forward primer) and 5’-CTGATTCTTCACATGTCTGCG-3’ (reverse primer) were used for the gene amplification. The specificity of the primer sequence for each gene studied was confirmed by a BLAST analysis search and comparison of genomic sequences in the National Centre for Biotechnology Information (NCBI) databases (http://blast.ncbi.nlm.nih.gov/Blast.cgi).19 The PCR reaction was carried out in a total of 25 µL reaction mixture (Master Mix) containing, 200 µM of deoxynucleoside triphosphate mixture, 2.0 mM of MgCl2, 1xPCR buffer, and 1 Unit of Taq polymerase; 0.5 µM of each primer, 5 ng genomic DNA, nuclease-free water. All PCRs were performed on GeneAmp® PCR System 9700 programmable thermal cycler. The gene amplification method, PCR cycles for CYP2B6*6 consists of three major phases: including an initial denaturation of the DNA by incubating the reaction mixture at 94°C for 6 minutes, followed by 35 cycles of denaturation at 94°C for 30 seconds; primer annealing was performed at 54°C for 30 seconds; and primer extension at 72°C for 1 minute and a final extension at 72°C for 6 minutes. DNA polymerase (Taq polymerase) was used in extending the primers, adding nucleotides onto the primer in a sequential manner, using the target DNA as a template. The PCR product’s base pair (bp) was confirmed by 1% agarose gel electrophoresis and Gel Photosystem (blue light) – P1-1002.20
The restriction fragment length polymorphism (RFLP) reaction was performed in a total of 20 µL reaction mixture containing 1 µL of the restriction enzyme (BsrI), 5 µL of 10x NEBuffer, 8 µL of PCR amplicon, and 6 µL of nuclease-free water for 15 minutes at 65°C. The digested PCR products (amplicons) were visualized on 1% agarose gel electrophoresis. The agarose gel (1%) was prepared by weighing 1.5g of agarose into a conical flask and adding 100mL of 1xTBE gel buffer solution. The agarose was completely dissolved by heating in the microwave for 2 minutes, allowed to cool (55°C) and 1.5 µL of EZ vision dye was added to the gel and poured onto the plate. 5 µL of PCR product was loaded on the gel for analysis of amplified product, and 20 µL for digestion product analysis while 10 µL of the diluted molecular weight marker (DNA ladder) was loaded to the gel. The gel was run in the electrophoretic system at 130V, allowing migration of 2.5 to 3.0 cm, and viewed using the Gel Photosystem P1-1002.
High-Performance Liquid Chromatography
The HPLC mobile phase consists of methanol and 10mM potassium dihydrogen phosphate at pH 4.5 (70:30) percentage compositions. The column used was HYPERSIL C18 ODS, 250mm by 4.6mm, and 5µm particle size at a flow rate of 1.000mL/min. The Ultraviolet-Visible detector was set at 247 nm with a column oven at 40°C temperature. From the 5 mL of the blood collected from participants, 3 mL was used for the HPLC/phenotype analysis. Plasma was separated from the whole blood using a centrifuge at 4000 rpm for 5 minutes. The total concentrations of efavirenz in plasma following protein precipitation with acetonitrile were measured using reversed-phase high-performance liquid chromatography (HPLC) with UV detection following the method of Ebeshi et al21 with some modifications: introduction of an internal standard and solvent system. Standard curves were analyzed in the concentration ranging from 0.5 to 16.0 µg/mL for efavirenz. Plasma samples (1000 µL) were pipetted into new plain sample bottles followed by 10 µL of lamivudine (IS). 2mL of acetonitrile was added to precipitate the proteins. The mixture was vortex for 30 seconds and then centrifuged at 4000 rpm for 5 minutes. The supernatants were then filtered using a micro Millipore filter of 0.45µm particle size per sample. The filtrate of 20 µL was injected twice manually onto the HPLC, and the peak areas were recorded and integrated by an enhanced ChemStation software integrator.
Results
Series of information was generated in the study including demographics, genotyping, and phenotypic data. Demographic data were analyzed with Microsoft Excel windows vista 2013 (Microsoft Corporation, USA) and GraphPad Instat software. Results are presented in Tables and Charts.
Polymerase Chain Reaction (PCR) - Amplicons
The polymerase chain reaction (PCR) was carried for all the 50 samples obtained from study participants, and the results are presented below with codes B1–B50 (Figures 2), indicating participants’ numbers.
Restriction Fragment Length Polymorphism (RFLP)
The DNA amplicons (PCR products) were digested using Brsl endonuclease enzymes, and participants were classified into ultra-rapid, extensive, intermediate, or poor metabolizers based on the restriction fragment length polymorphism (RFLP) results (Figures 3).
Discussion
Participants were selected across all the major ethnic groups in the Niger Delta region (South–South) of Nigeria with Bayelsa state having the highest number (30%), while Edo state recorded the least participants (10%). This is largely due to the fact that, the facility approved for the study was within Bayelsa State; hence, more of the indigenes had ease access to HAART therapy. Efavirenz plasma concentration was determined by high-performance liquid chromatography (HPLC) and genotype frequencies were obtained by direct counting following PCR-RFLP analyses. The standard curve for HPLC was constructed with Microsoft Excel spreadsheet, Windows 2013 (Microsoft Corporation, USA). The linearity of the regression line, as well as the regression coefficient (R2), were; y = 0.1795 x + 0.6192 and 0.995, respectively, (Table 1 and Figure 1). The total plasma concentration of efavirenz following protein precipitation was accurately measured using reverse-phase high-performance liquid chromatographic (HPLC) technique with lamivudine as an internal standard (Table 1). Results from the analysis showed that the participants had efavirenz plasma concentrations from 0.00 mg/L to 6.0 mg/L. Six subjects had efavirenz plasma levels below 0.10 mg/L (Table 2). This category of patients may be considered as ultra-rapid metabolizers (UMs), as very low concentration of the drug was observed in their plasma (Table 1). It has been reported in several previous studies that polymorphisms in genes that normally encodes drug-metabolizing enzymes may lead to diverse enzyme activity and inter-individual variability in drug efficacy and as well as toxicity.22 However, several factors other than genetic mutation could lead to this low plasma levels among these subjects including non-adherence, missed dosage, alcoholic habit, polypharmacy, and opportunistic infections.23 Moreover, the rest of the participants (45) had efavirenz plasma levels ranging from 0.10mg/L to 6.0mg/L. Twenty-two (22) of the participants showed efavirenz plasma levels from 0.10m g/L to 0.90m g/L. These categories of patients were classified as extensive metabolizers (EMs), nineteen (19) had 1.0 to 3.9m g/L and were noted as intermediate metabolizers (IMs). In addition, 3 (6%) subjects showed efavirenz plasma levels from 4.0mg/L to 6.0 mg/L, which were categorized as poor metabolizers (PMs) (Table 3).
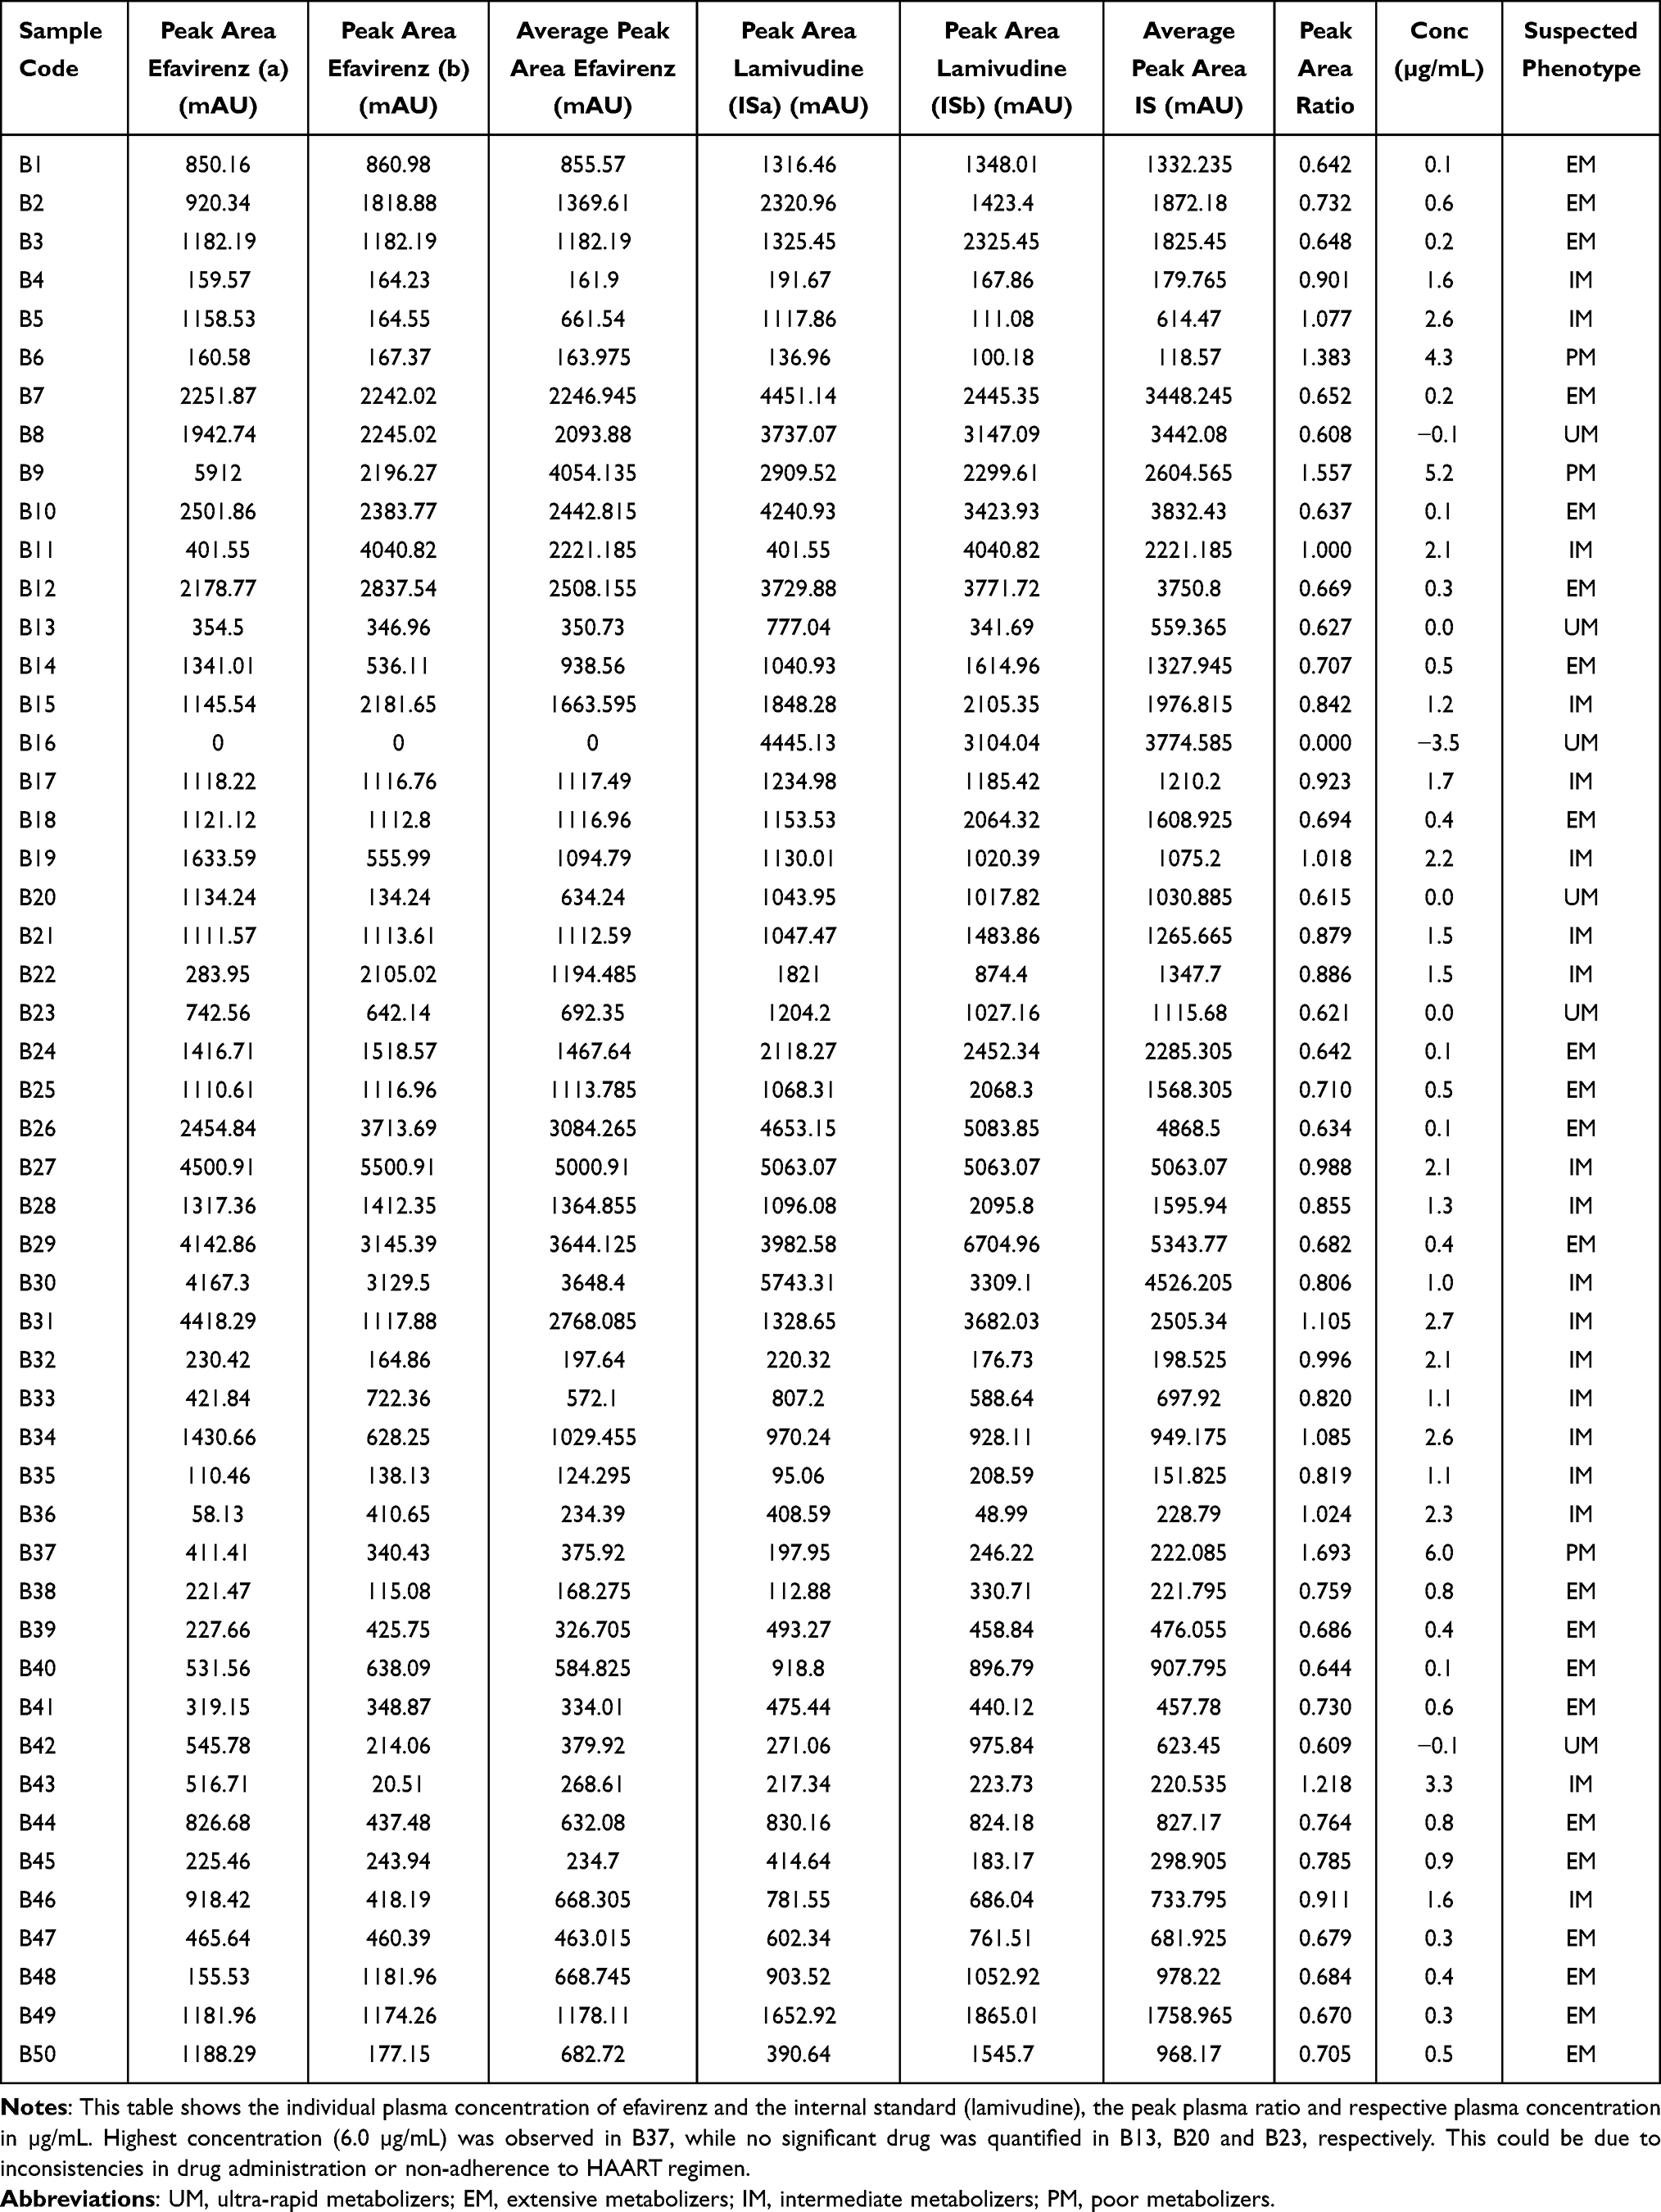 |
Table 1 HLPC Plasma Concentration of Efavirenz |
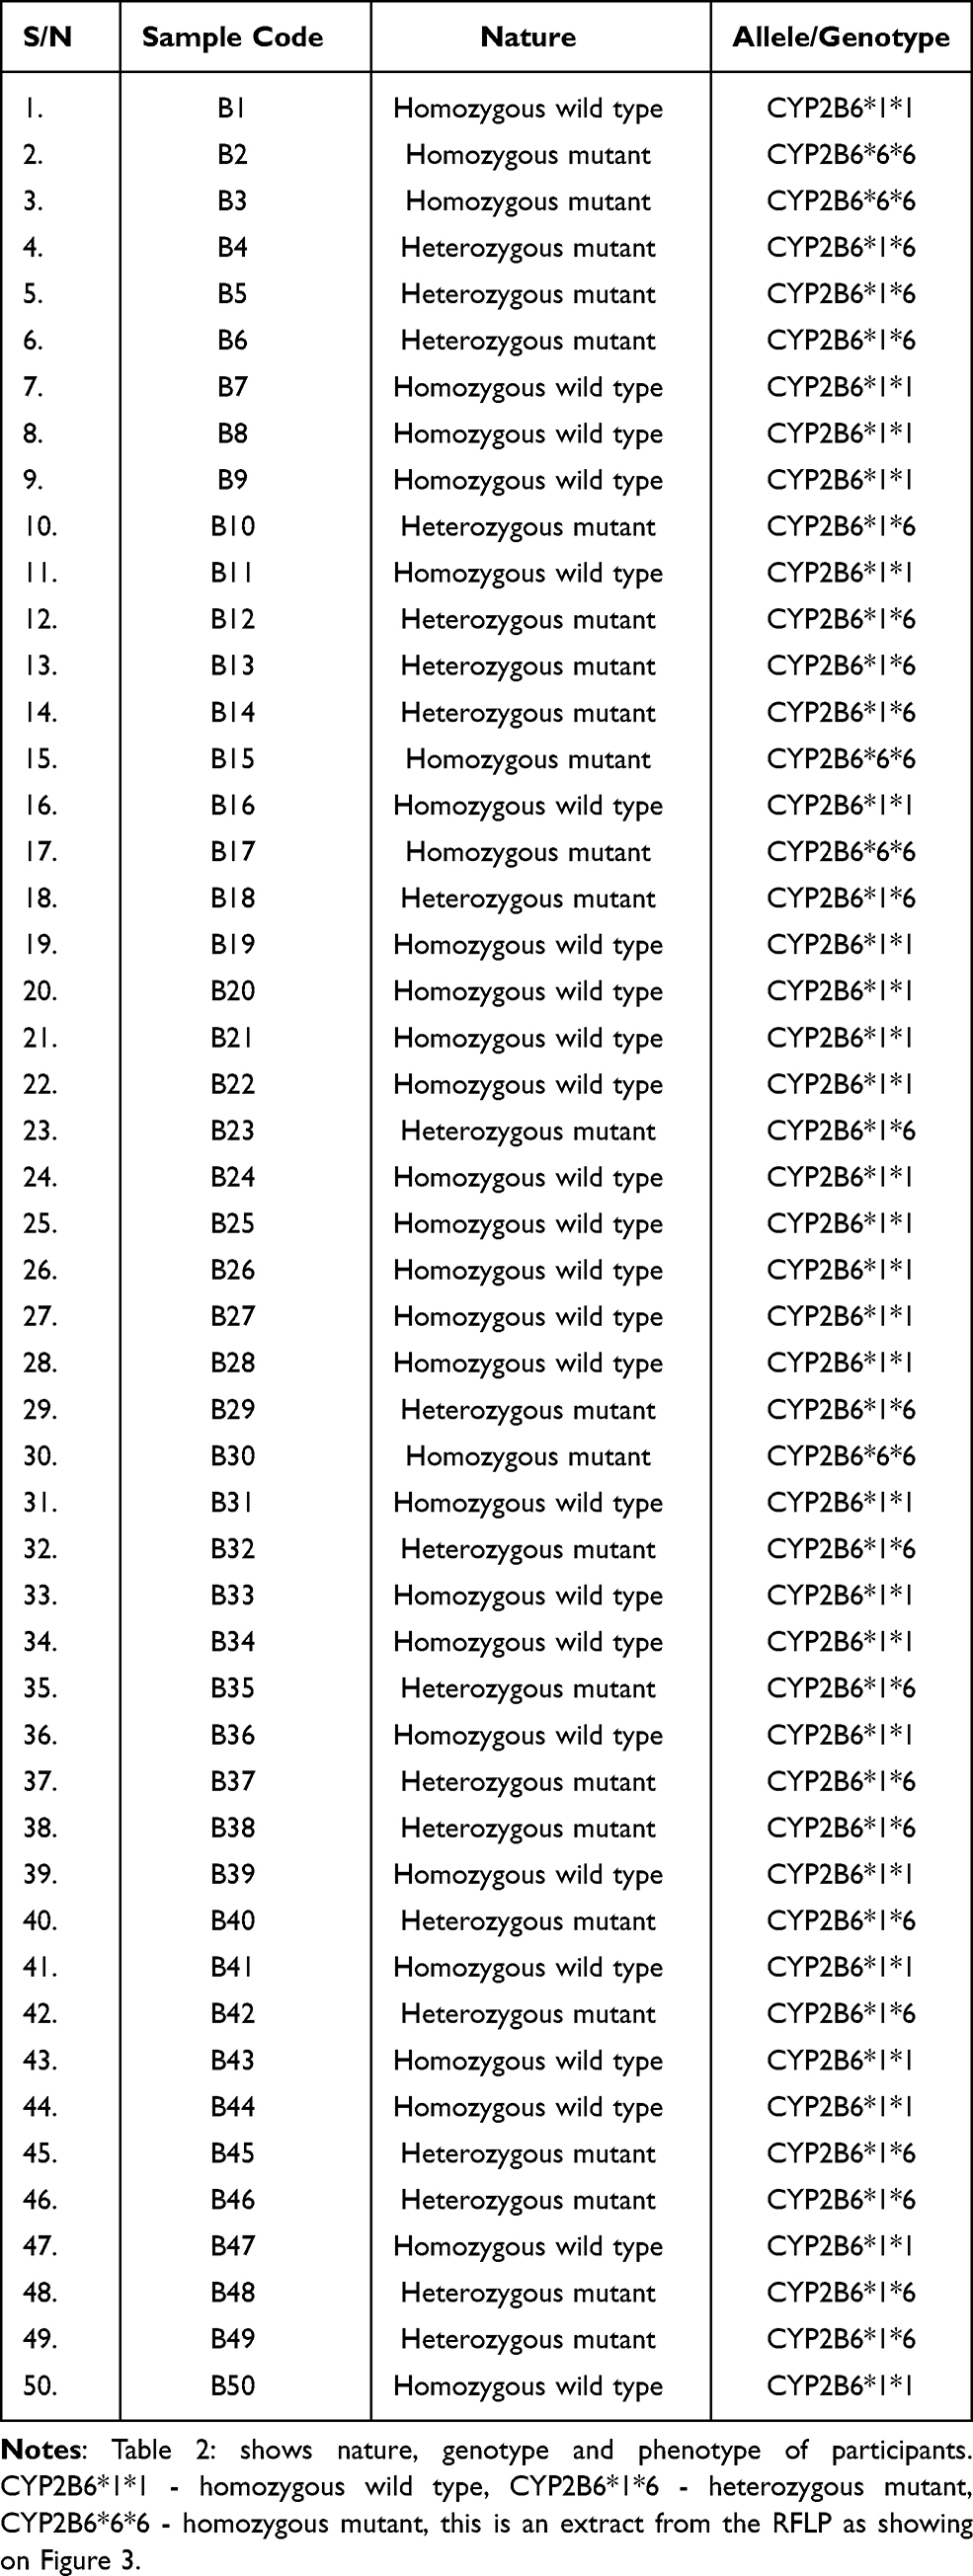 |
Table 2 Restriction Fragment Length Polymorphism Products and Suspected Alleles (516G>T SNP) |
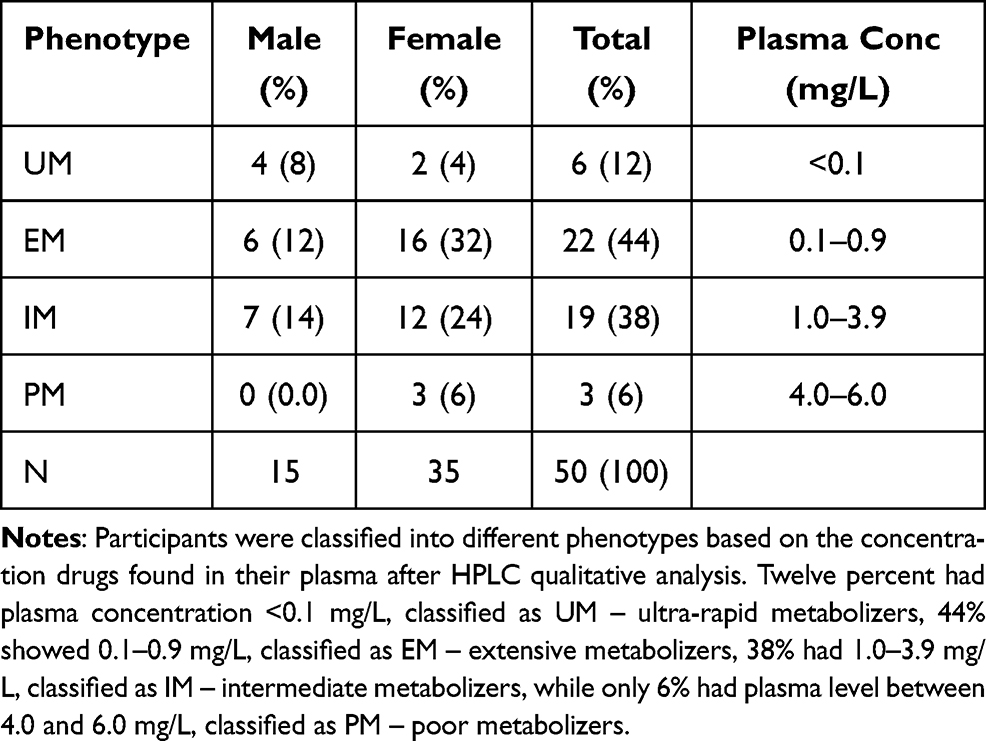 |
Table 3 Gender and Phenotypic Distribution of Polymorphic CYP2B6*6 Allele in Niger Delta Population [n = 50] |
 |
Figure 1 A plot of peak area ratio versus concentration: calibration curve for efavirenz in blank plasma. Standard concentrations of efavirenz, 0.5, 1.0, 2.0, 4.0, 8.0, and 16.0 µg/mL were used to plot the calibration curve, with regression coefficient of 0.995, showing the linearity of the curve. |
All the extracted DNA products showed at 500bp after subjecting them to polymerase chain reaction (PCR) at 94°C, 54°C, and 72°C, for initial denaturation, primer annealing, and extension, respectively, using Taq polymerases enzyme and 100bp DNA molecular ladder as shown in Figures 2 and 3. This indicates that, all the participants had the target gene to encode for the enzyme (CYP2B6) responsible for metabolizing the substrate of choice (efavirenz). The PCR products (amplicons) were digested with restriction endonuclease enzyme (Bsrl) and subjected to restriction fragment length polymorphism (RFLP) on agarose gel electrophoretic medium. After the digestion, the RFLP results showed more than half of the population (56%) with a homozygous wild-type gene with CYP2B6*1*1 allele. Individuals with CYP2B6*1*1 allele are believed to metabolize the drug very extensively or rapidly, therefore may not have serious adverse events as regards to HAART regimen, also 38% were CYP2B6*1*6 (heterozygous mutant) allele (Table 2). These category of patients might not extensively handle the drug (intermediate), thus might have occasional adverse reactions, especially in cases of high concentration >4m g/L. Finally, 6% had homozygous mutant gene (CYP2B6*6*6 allele); these patients are prone to experience frequent adverse drug reactions due to poor metabolism of the drug (Table 4). This is in line with a study conducted by García-González et al23, they reported that individual drug-metabolizing activity for corresponding drug substrates varies from poor, intermediate, and to wild-type activity (extensive metabolizer), and that increased enzyme expression in the case of gene duplication (rapid metabolizer phenotype).
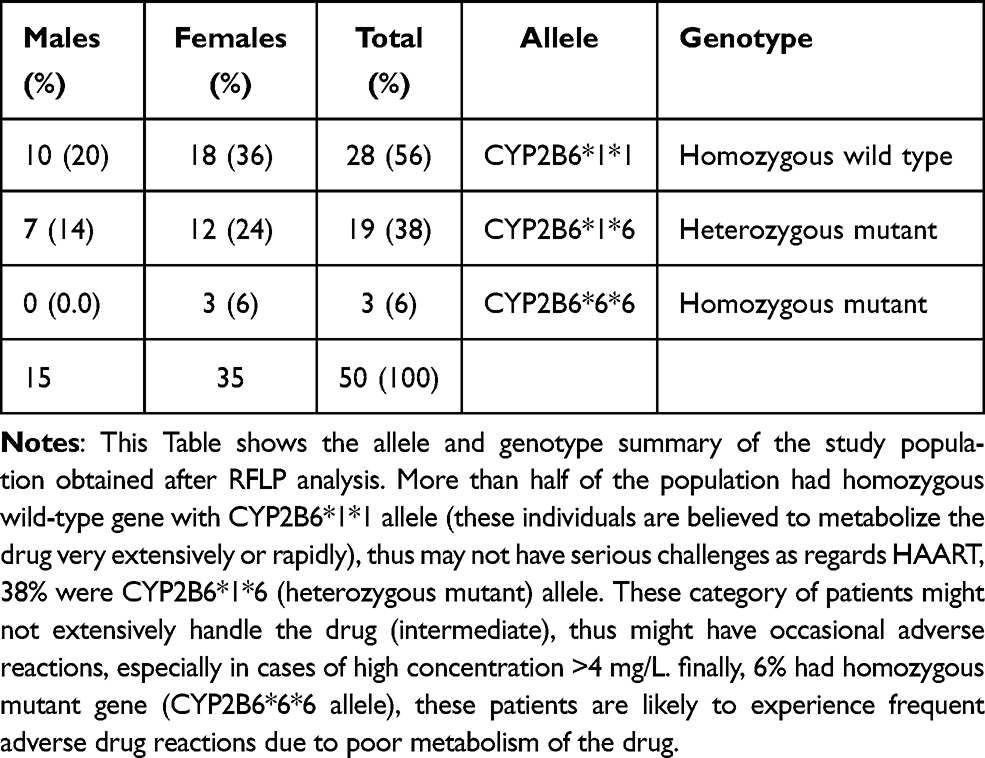 |
Table 4 Genotypes and Alleles Obtained from Restriction Fragment Length Polymorphism Analysis |
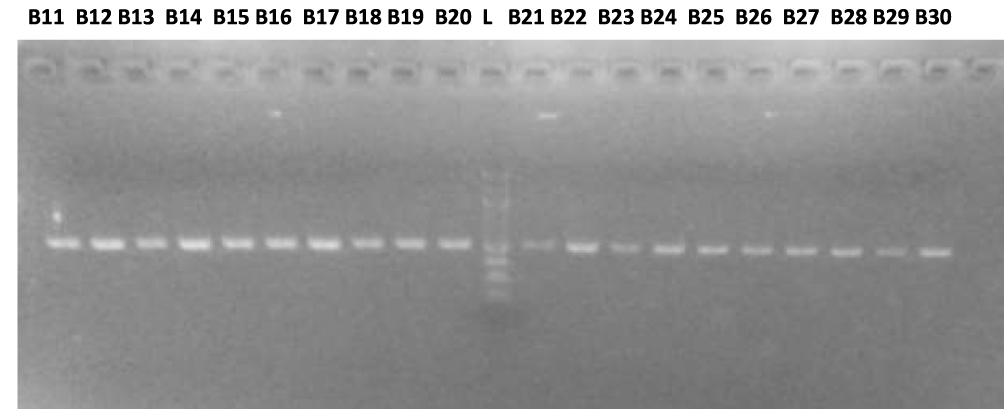 |
Figure 2 Polymerase chain reaction amplicons of Sample B11 – B30: All PCR gene amplicons appeared at 500bp, using a 100bp DNA molecular ladder. |
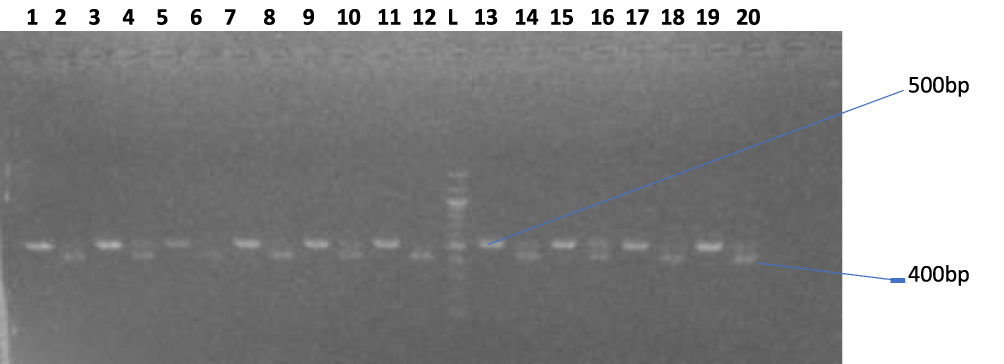 |
Figure 3 (B31–B40): Agarose gel electrophoresis showing the amplified CYP gene bands. Lane 1, 3, 5, 7, 9, 11, 13, 15, 17, and 19 represent the undigested CYP amplicons (Sample code B31 – B40), lane 2, 6, 8, 12, and 18 represents the digested homozygous (wild type) CYP gene, lane 4, 10, 14, 16, and 20 represent the heterozygous CYP gene (wild and mutant allele), while lane L represents the 100bp molecular ladder. |
Several factors can affect the way an individual metabolizes drugs, one of such factors seen in this was gender difference. Out of the 15 male subjects among the 50 patients that participated in the study, 8% were ultra-rapid metabolizers, 12% extensive metabolizers, 14% intermediate metabolizers while no poor metabolizer was observed, following the drug concentration quantified from their plasma. On the contrary, out of the 35 females that participated in the study, from the pool of 50 patients, 4% were observed as ultra-rapid metabolizers, 32% extensive, 24% intermediate metabolizers, while 6% were poor metabolizers (Figure 4). This indicates that the drug was more poorly metabolized by the female population than that of their male counterparts, comparing the number of participants (35:15). Hence, this calls for individualization of therapy based on gender differences when prescribing medication, especially genotypic individualized-based dosage prescription as regards to HAART regimen, etc. Poor metabolizers (PMs) may need down regulation of dosage strength, as the drug is likely to accumulate in the system, the intermediate metabolizers (IMs) need no adjustment in the dose but extensive (EMs) and ultra-rapid metabolizers may require the usual or higher dose, as the normal therapeutic level of the drug will be rapidly cleared off the system, this form the basis of pharmacogenomics (modern precision or individualized medicine). This was also reported by Nemaura et al24, that gender, weight, and 516G>T genotypes are important determinants on whether a patient will have efavirenz concentrations within the therapeutic range or above 4 mμg/L. This will definitely enhance and enable the healthcare team to manage these patients by conducting pharmacogenetic testing and provide modern precision medicine (personalized, individualized treatment regimens based on their genetic variations), to optimize medication (antiretrovirals) regimens and thereby improving the quality of life, as well reducing unprecedented adverse drug reactions and expenditures.3,25
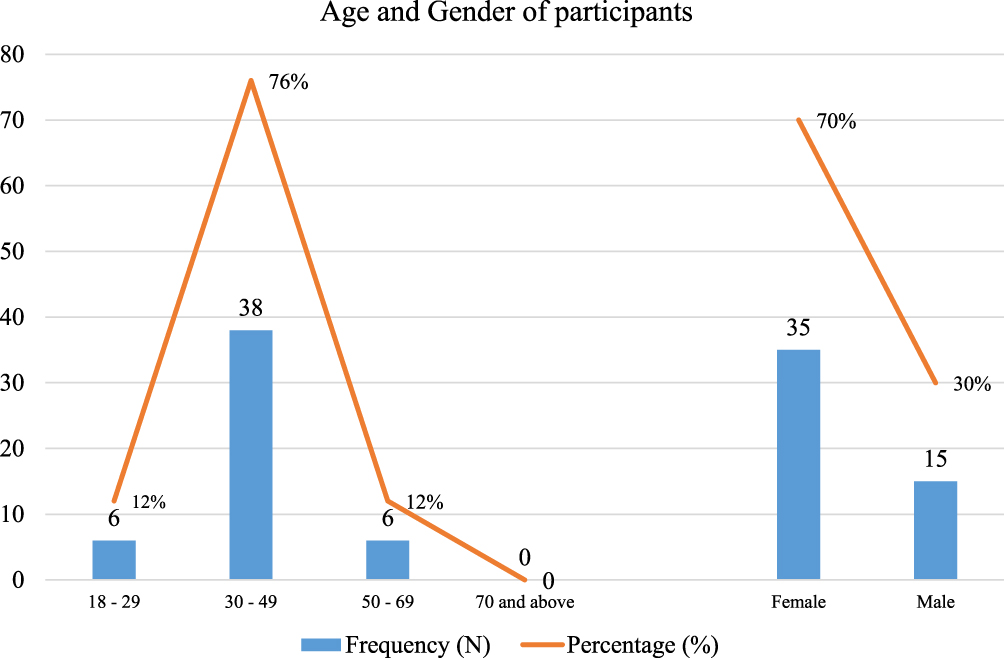 |
Figure 4 Demography of study population. This figure depicts the participant’s age group and gender that were enrolled in the study. It was observed that majority of the participants were female (70%) and were between the age of 30–49 years (76%). |
One of the major limitation of the study was the inability to conduct DNA sequencing in a bid to ascertain the actual strand or mutation of the amino acid sequence from the patients. However, Mehlotra et al26 reported the CYP2B6 983T>C polymorphism in West African countries and found a high prevalence of CYP2B6 functional polymorphism of 983T>C in Papua New Guinea, where HIV/AIDS is a significant health problem. This is very similar to the findings of the current study on the prevalence of CYP2B6 polymorphism in the Niger Delta, South of Nigeria.
Conclusion
There was no significant difference (p ≤ 0.05) between genotype and phenotype data for CYP2B6 polymorphism, among the HIV/AIDS patients that participated in this study. Based on genotype data, there was more (58%) homozygous wild-type gene (CYP2B6*1*6 alleles), while the other participants (38%) exhibited heterozygous mutant gene (CYP2B6*1*6, 40%) and homozygous mutant gene (CYP2B6*6*6, 6%), respectively. Following the different phenotypes obtained from the phenotypic analysis, genetic polymorphism of the CYP2B6 gene is prevalent among HIV/AIDs patients in the Niger Delta ethnic population undergoing HAART regimen (efavirenz-based HAART treatment), as the population having homozygous mutant gene or PM are >1% (6%). Also, gender differences could affect drug metabolism as no PM was observed among the male participants, whereas 6% of the female participants were PMs.
Ethical Issues
This research was carried out on approval by the research and ethics committee of the Federal Medical Centre Yenagoa, Bayelsa State, Nigeria. The study complies with the Declaration of Helsinki (Adopted by the 18th WMA General Assembly, Helsinki, Finland, June 1964 and amended by the 64th WMA General Assembly, Fortaleza, Brazil, October 2013), in terms of research protocol approval, obtaining of participants informed consent, precautions taken to protect the privacy of subjects and the confidentiality of their personal information, and proper education on the methods to be employed and they were allowed to make independent choices.
Acknowledgment
The authors sincerely acknowledge the staff of the Department of Pharmaceutical and Medicinal Chemistry, Faculty of Pharmacy, Niger Delta University, Wilberforce Island; Federal Medical Centre, Yenagoa, Bayelsa State, for granting ethical approval and provision of facility to conduct the study, and the Department of Medical Laboratory Sciences, Faculty of Basic Medical Sciences, College of Health Sciences, Niger Delta University.
Disclosure
The authors declare no conflicts of interest in this work.
References
1. Oetjens MT, Denny JC, Ritchie MD. Assessment of a pharmacogenomics marker panel in a polypharmacy population identified from electronic medical records. Pharmacogenomics. 2013;14(7):735–744. doi:10.2217/pgs.13.64
2. Leeder JS. Pharmacogenetics and pharmacogenomics. Pediatr Clin North Am. 2001;48(3):765–781. doi:10.1016/S0031-3955(05)70338-2
3. Li J, Bluth MH. Pharmacogenomics of drug-metabolizing enzymes and transporters: implications for cancer therapy. Pharmgenomics Pers Med. 2011;4:11–33. doi:10.2147/PGPM.S18861
4. Wijnen PA, Op den Buijsch RA, Drent M. Review article: the prevalence and clinical relevance of cytochrome P450 polymorphisms. Aliment Pharmacol Ther. 2007;26(Suppl 2):211–219. doi:10.1111/j.1365-2036.2007.03490.x
5. Smith BT, editor. Concepts in Immunology and Immunotherapeutics.
6. Barret J, Joshi AS, Chai M, Ludden TM, Fiske WD, Pieniaszek HJ. Population pharmacokinetic meta-analysis with efavirenz. Int J Clin Pharmacol Ther. 2002;40:507–519. doi:10.5414/CPP40507
7. Marzolini C, Telenti A, Descosterd LA, Grueb G, Biolazz J, Buclin T. Efavirenz plasma level can predict treatment failure and central nervous system side effects in HIV-1 infected patients. AIDS. 2001;5:71–75. doi:10.1097/00002030-200101050-00011
8. Klein K, Lang T, Saussele T, et al. Genetic variability of CYP2B6 in populations of Africa and Asian origin: Allele frequencies, novel functional variations and possible implications for anti-HIV therapy with efavirenz. Pharmacogent Genomics. 2005;15:861–873. doi:10.1097/01213011-200512000-00004
9. Ebeshi BU, Bolaji OO, Masimirembwa CM. Cytochrome P450 2D6 (CYP2D6) genotype and phenotype determination in the Nigeria population. Asian J Pharm Health Sci. 2011;1(2):47–54.
10. Padh H. Pharmacogenetics: polymorphism and genotype-phenotype correlation of drug response in Indian population. Mol Cytogenet. 2014;7:I52. doi:10.1186/1755-8166-7-S1-I52
11. UNAIDS. Fact sheet; Latest statistics on the status of AIDS epidemic [UNAIDS]. Available from: www.unaids.org.
12. WHO. Guideline on when to start antiretroviral therapy and on pre-exposure prophylaxis for HIV. Geneva: World Health Organization; 2015. Available from: http://www.who.int/hiv/pub/guidelines/earlyrelease-arv/en.
13. Csajka C, Marzolini C, Fattinger K, Decosterd LA, Fellay J, Telenti A. Population pharmacokinetics and effects of efavirenz in patients with human immunodeficiency virus infection. Clin Pharmacol Ther. 2003;73:20–30. doi:10.1067/mcp.2003.22
14. Saiki R, Scharf S, Faloona F, et al. Enzymatic amplification of beta-globin genomic sequences and restriction site analysis for diagnosis of sickle cell anemia. Science. 1985;230(4732):1350–1354. doi:10.1126/science.2999980
15. National Centre for Biotechnology Information (NCBI). Polymorphism, Restriction Fragment Length [MAJR] in PubMed. 8600 Rockville Pike, Bethesda MD, 20894 USA: U.S. National Library of Medicine; 2017.
16. Clark J. High-Performance Liquid Chromatography - HPLC. Available from: https://www.chemguide.co.uk/analysis/chromatography/hplc.html.
17. Bunu SJ, Otele D, Alade T, Dodoru RT. Determination of serum DNA purity among patients undergoing antiretroviral therapy using NanoDrop-1000 spectrophotometer and polymerase chain reaction. Biomed Biotechnol Res J. 2020;4:214–219. doi:10.4103/bbrj.bbrj_68_20
18. Rotger M, Colombo S, Furrer H, Bleiber G, Buclin T, Lee BL. Influence of CYP2B6 polymorphism on plasma and intracellular concentrations and toxicity of efavirenz and nevirapine in HIV-infected patients. Pharmacogenet Genomics. 2005;15:1–5. doi:10.1097/01213011-200501000-00001
19. National Centre for Biotechnology Information (NCBI) databases. Available from: http://blast.ncbi.nlm.nih.gov/Blast.cgi.
20. Aryal S. Polymerase chain reaction (PCR), principle, procedure, types, applications, and animation. Microbiology info.com; [updated July 6, 2018].
21. Ebeshi BU, Bolaji OO, Oluka M, Edebi VN, Soyinka JO, Guantai A. Simple reversed-phase high-performance liquid chromatographic estimation of the antiretroviral agent Efavirenz from human plasma. Br J Pharm Res. 2014;4(1):145–157. doi:10.9734/BJPR/2014/4123
22. Deshpande N, Sharanya V, Murthy HV, et al. Rapid and ultra-rapid metabolizers with CYP2C19*17 polymorphism do not respond to standard therapy with proton pump inhibitors. Meta Gene. 2016;9:159–164. doi:10.1016/j.mgene.2016.06.004
23. García-González X, Cabaleiro T, Herrero MJ, McLeod H, López-Fernández LA. Clinical implementation of pharmacogenetics. Drug Metab Pers Ther. 2016;31(1):9–16. doi:10.1515/dmpt-2015-0031
24. Nemaura T, Nhachi C, Masimirembwa C. Impact of gender, weight and CYP2B6 genotype on efavirenz exposure in patients on HIV/AIDS and TB treatment: implications for individualizing therapy. Afr J Pharm Pharmacol. 2012;6(29):2188–2193.
25. Thelma A, Samuel BJ. Genetic testing and non-chemotherapeutic management of prostate cancer. Int J Pharm Sci Drug Anal. 2021;1(1):12–17.
26. Mehlotra RK, Bockarie MJ, Zimmerman PA. CYP2B6 983T>C polymorphism is prevalent in West Africa but absent in Papua New Guinea: implications for HIV/AIDS treatment. Br J Clin Pharmacol. 2007;64(3):391–395. doi:10.1111/j.1365-2125.2007.02884.x
 © 2022 The Author(s). This work is published and licensed by Dove Medical Press Limited. The
full terms of this license are available at https://www.dovepress.com/terms
and incorporate the Creative Commons Attribution
- Non Commercial (unported, 3.0) License.
By accessing the work you hereby accept the Terms. Non-commercial uses of the work are permitted
without any further permission from Dove Medical Press Limited, provided the work is properly
attributed. For permission for commercial use of this work, please see paragraphs 4.2 and 5 of our Terms.
© 2022 The Author(s). This work is published and licensed by Dove Medical Press Limited. The
full terms of this license are available at https://www.dovepress.com/terms
and incorporate the Creative Commons Attribution
- Non Commercial (unported, 3.0) License.
By accessing the work you hereby accept the Terms. Non-commercial uses of the work are permitted
without any further permission from Dove Medical Press Limited, provided the work is properly
attributed. For permission for commercial use of this work, please see paragraphs 4.2 and 5 of our Terms.