Back to Journals » Risk Management and Healthcare Policy » Volume 14
The Clinicians’ Satisfaction with Clinical Pathway Implementation: Preliminary Development of an Assessment Scale in China
Authors Li J, Shen K, Hu J, Li X, Liu J, Du Y, Huang K
Received 9 November 2020
Accepted for publication 18 December 2020
Published 26 January 2021 Volume 2021:14 Pages 303—313
DOI https://doi.org/10.2147/RMHP.S290565
Checked for plagiarism Yes
Review by Single anonymous peer review
Peer reviewer comments 2
Editor who approved publication: Professor Marco Carotenuto
Junlong Li,1,* Kui Shen,1,* Jun Hu,2 Xinyue Li,3 Jie Liu,1 Yonghong Du,1 Kang Huang4
1Sichuan Vocational College of Health and Rehabilitation, Zigong, Sichuan, People’s Republic of China; 2Health Information Center of Zigong, Sichuan, People’s Republic of China; 3Finance Department, Zigong Fourth People’s Hospital, Zigong, Sichuan, People’s Republic of China; 4Health Commission of Zigong, Zigong, Sichuan, People’s Republic of China
*These authors contributed equally to this work
Correspondence: Kang Huang
Health Commission of Zigong, Hua Yuan Street 66, Zigong 643000, People’s Republic of China
Tel +86 13990043323
Email [email protected]
Purpose: To develop a satisfaction scale of Chinese clinicians with Clinical Pathway (CP) implementation and evaluate its validity, reliability and item discrimination.
Materials and Methods: Literature review, in-person interviews, and Delphi were used to design the scale. Data were collected in two phases using random sampling on the spot and an online survey. In the first phase, data from 239 clinicians were investigated in exploratory factor analysis. In the second phase, 513 valid questionnaires were collected and used for confirmatory factor analysis.
Results: The scale developed in this study has three dimensions (organization support, process identity, and effect perception) and a total of 21 items. Cronbach’s alpha of each dimension was higher than 0.9. The 3-factor model had enough fitness (χ 2/df = 5.602, NFI = 0.926, IFI = 0.938, CFI = 0.938, RFI = 0.914, TLI = 0.929, RMSEA = 0.095, RMR = 0.045). The standardized factor loadings of 21 variables were between 0.742 and 0.949. The average variance extracted (AVE) of each dimension was higher than 0.7, and the construct reliability (CR) of the dimensions was higher than 0.9. The Chi-square difference test results showed that the difference value between the unlimited and limited model of each two potential constructs was higher than 3.84 (P < 0.001).
Conclusion: The clinicians’ satisfaction scale developed in this study has good construct validity, convergent validity, discriminant validity, internal consistency, and item discrimination. This suggests its usefulness as a tool to assess the satisfaction of clinicians in the implementation of CP in China.
Keywords: clinicians, clinical pathway, satisfaction, scale development
Introduction
Clinical Pathway (CP) is an interdisciplinary and comprehensive management mode of clinical treatment. It is a standardized service plan designed by a group of multidisciplinary professionals, including clinicians, nurses, pharmacists, medical technicians, and hospital managers for patients with specific diseases. The plan sets the most appropriate and rigorous work order, involving monitoring, treatment, care, recovery, and other links. Each link has the appropriate time required to reduce waste of resources and yet gives patients the best medical care.1–3 CP originated in America in the 1970s.4 In 1985, it was named Critical Pathway and first implemented by the New England Medical Center in Boston. Researchers in the New England Medical Center observed that poor-quality medical service was often related to improper and unconventional clinical practice, and that outcomes significantly improved after implementing CP. Afterwards, the promotion and application of CP gradually started to spread in America. In the 1990s, countries in different regions of the world, such as Spain, New Zealand, and South Africa, began to experiment with CP implementation, followed by Japan, Singapore, and other Asian countries.5
In 2009, China’s Ministry of Health printed and distributed the Notice on Pilot Work of CP Management and the Guiding Principles of CP Management (Trial).6,7 The Chinese government has further strengthened the promotion of CP in the new phase of healthcare system reform. In 2015, the Action Plan for further Improvement of Medical Service, issued by China’s Health and Family Planning Commission, stated that all tertiary referral hospitals and 80% of secondary referral hospitals have to implement CP management.8 From 2009 to 2019, the number of CPs published by the National Health Commission of the People’s Republic of China has reached 1212.9 The promotion and application of CP has a profound and positive effect on promoting medical quality, improving patients’ satisfaction, and enhancing the doctor-patient relationship. However, promotion of CP faces several challenges. Some clinicians believe that standardization of diagnosis and treatment behavior restrain innovative thinking, restrict medical autonomy, and the ability to make decisions. Also, some clinicians believe that lowering medical cost will negatively impact their personal income, and therefore they resist the implementation of CP.10 Given the key role that clinicians play in promoting and applying CP, their attitude towards CP will directly affect its application. Studies have shown that clinicians with a high level of training, recognition, and satisfaction benefit from the CP implementation. As early as 2011, China’s Ministry of Health issued the implementation rules for tertiary general hospitals to improve healthcare delivery, which required hospitals to investigate satisfaction of the clinicians with CP implementation.11 Currently, local research focuses on patients’ satisfaction with CP, and only a few investigate clinicians’ satisfaction. To our knowledge, only Wang et al. conducted a single factor analysis of factors influencing satisfaction of medical staff with CP implementation.10 Therefore, there is a need to study the satisfaction of clinicians with the implementation of CP and the influencing factors, especially in China, where information on this topic is lacking.
In view of this, this study aims to develop a satisfaction scale of Chinese clinicians with CP implementation and evaluate its validity, reliability, and item discrimination. The ultimate goal is to provide a theoretical basis for research on the influencing factors of clinicians’ satisfaction with CP implementation and offer practical reference to CP management for hospitals in China.
Materials and Methods
Scale Compilation
We initially interviewed clinicians who participated in CP implementation and collected their views on CP implementation and its structural features. These interviews were guided by a literature review of influencing factors of clinicians’ satisfaction with CP implementation. After this step, specific items for measuring clinicians’ satisfaction with CP implementation were created. In creating these items, we considered the health administration institutions’ and hospitals’ organizational structure, operating mechanism, and regulations. Four experts were invited to modify and improve the designed items: a medical doctor (attending physician or above, who had participated in the implementation of CP for more than five years), a public health professor (research focus on quality management in healthcare), a quality management in healthcare specialist (head of quality management in healthcare department), and a health administration official (with expertise in CP management). Finally, a 24-item scale was developed, and the Likert five-point scoring method was employed (Table 1). Scores of 1, 2, 3, 4, and 5 represented strongly dissatisfied, dissatisfied, not sure, satisfied, and strongly satisfied, respectively.
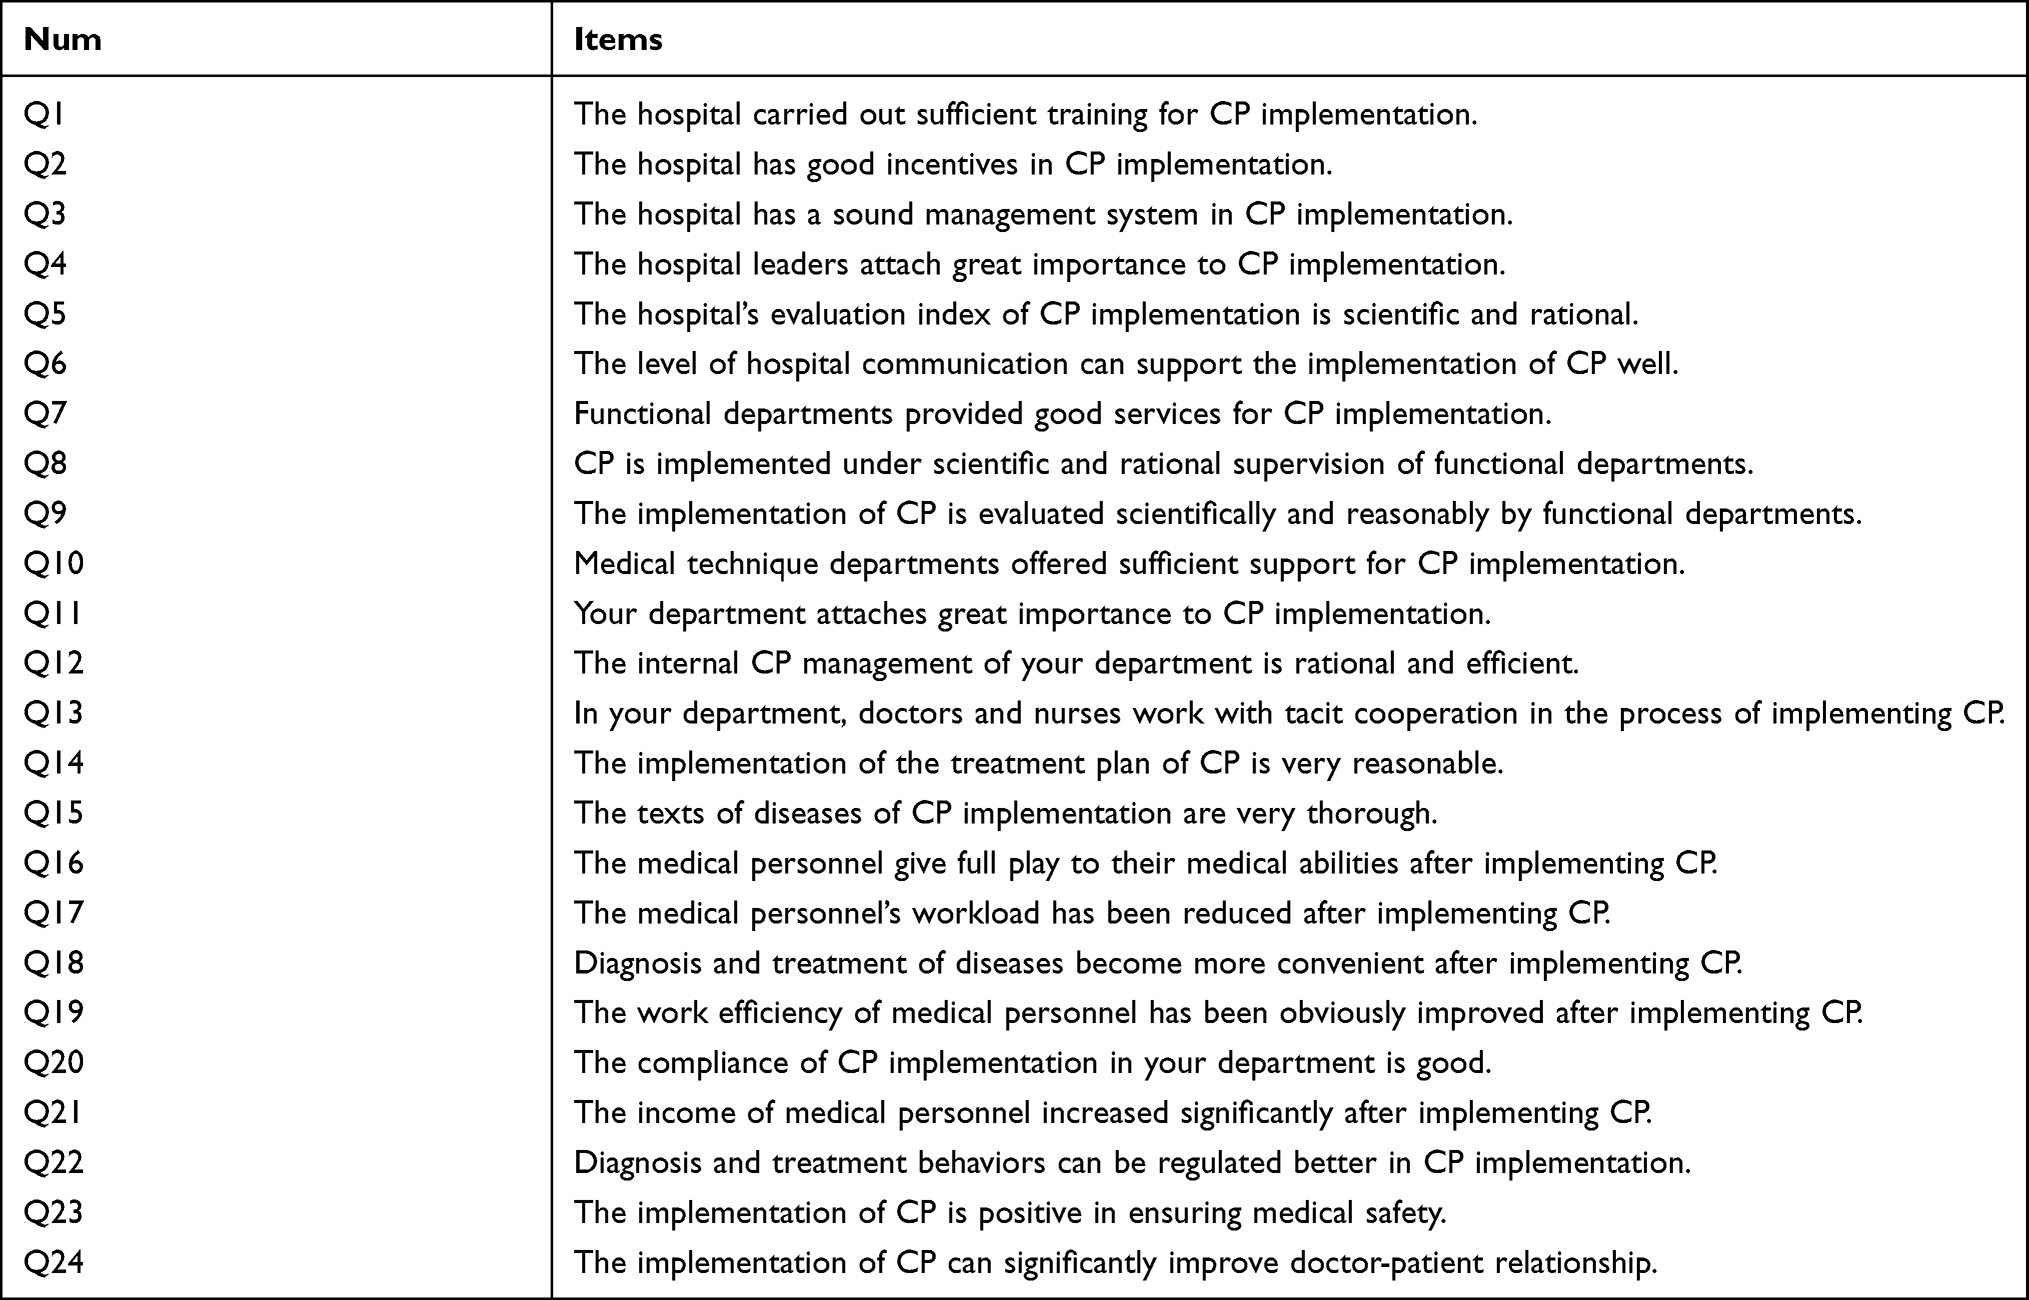 |
Table 1 Initial Scale of Clinicians’ Satisfaction with CP Implementation |
Data Collection
Data collection consisted of two phases. Data acquired in the first phase was used for Exploratory Factor Analysis (EFA) of the initial scale. In this phase, a random sample of 239 valid questionnaires was collected from a public tertiary hospital in Sichuan Province. In the second phase, 513 valid questionnaires were collected using the online network questionnaire platform “Sojump” for Confirmatory Factor Analysis (CFA) of the scale. The descriptive statistics for the two phases are shown in Table 2.
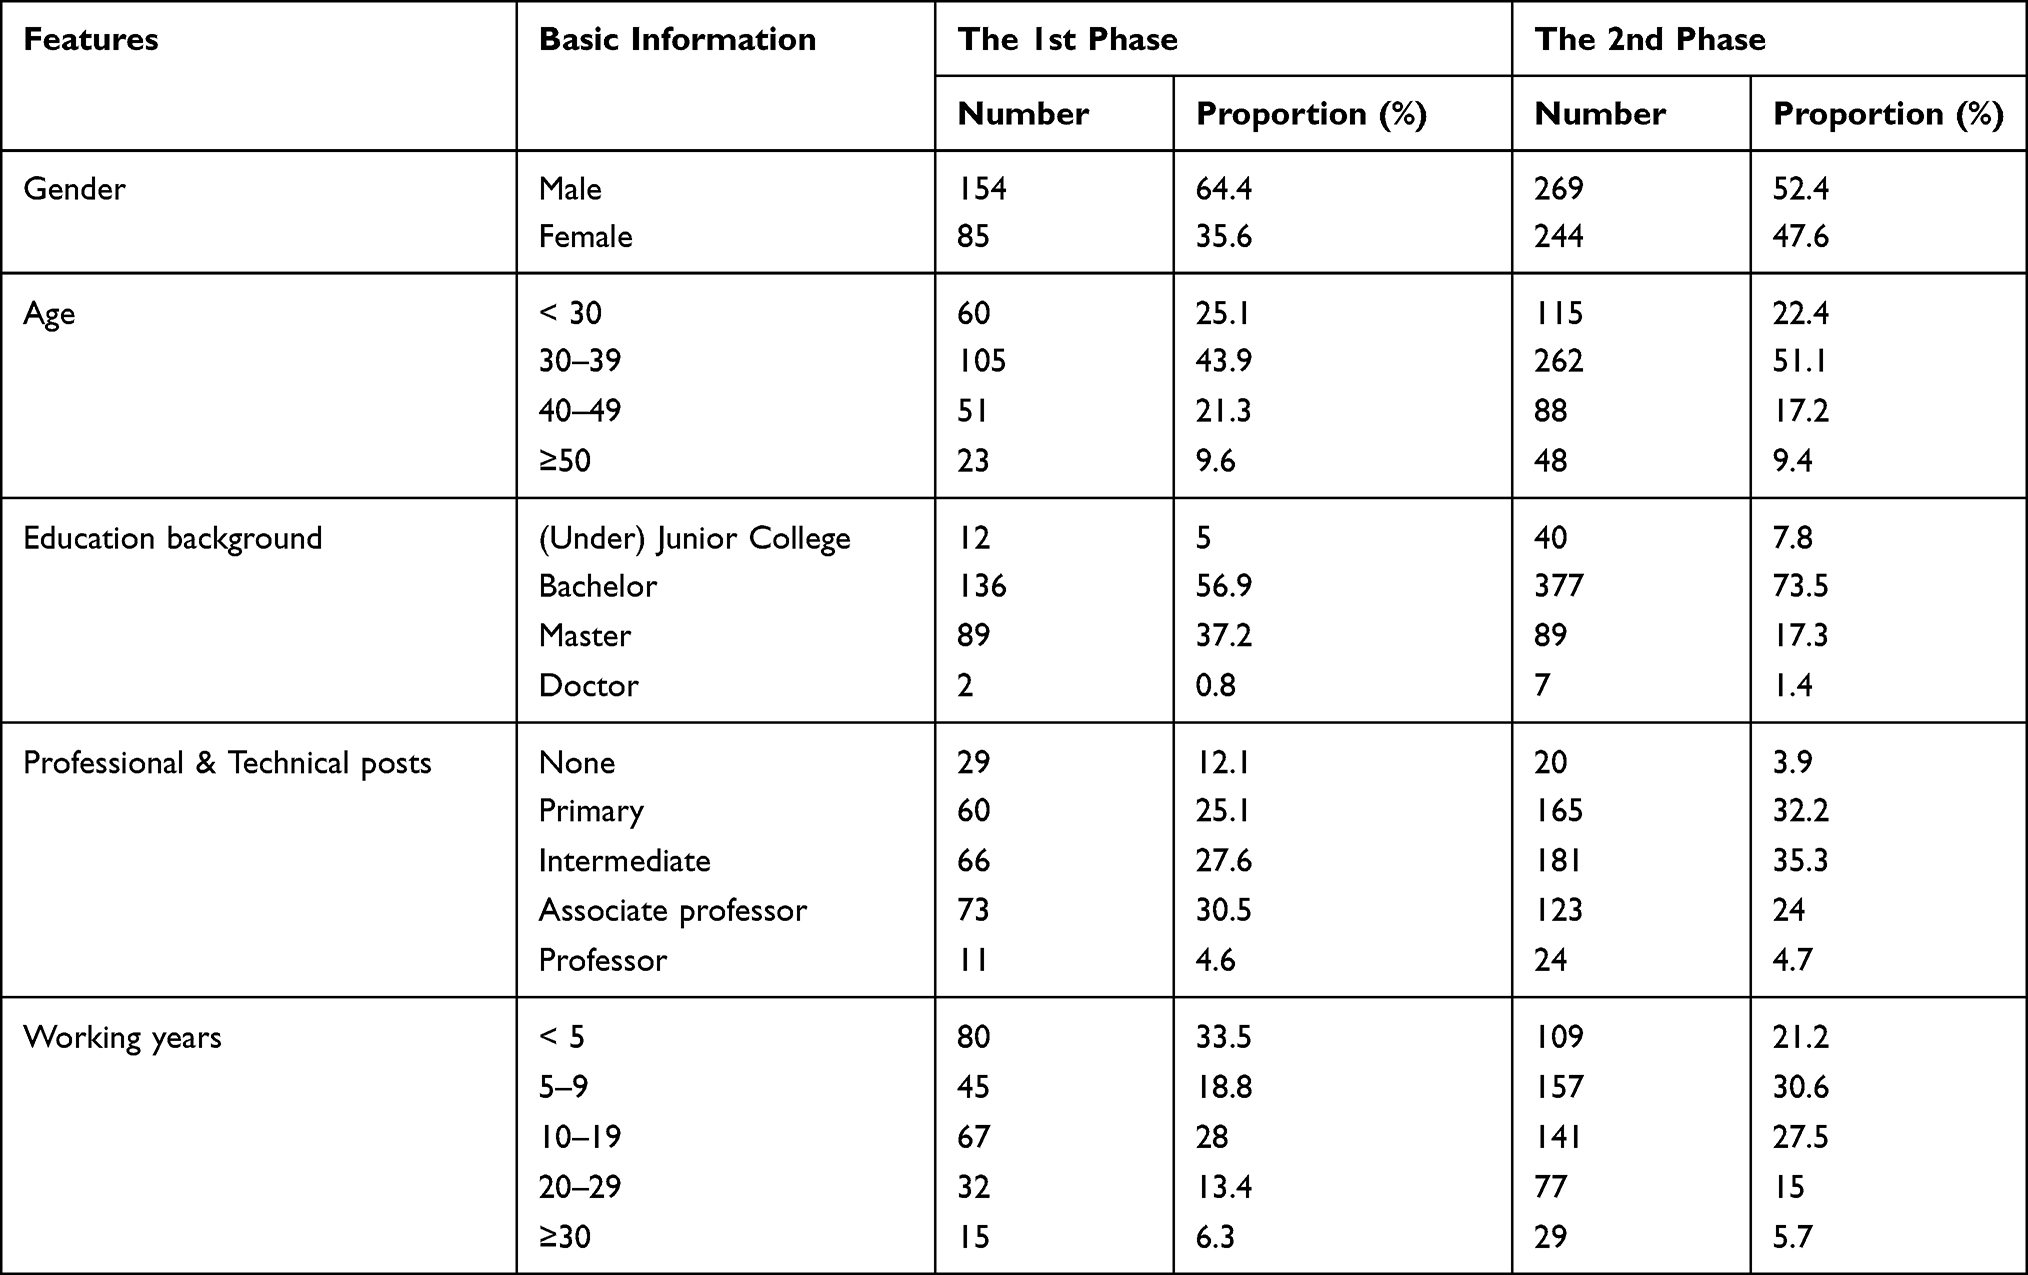 |
Table 2 Descriptive Statistics for Two-Phases Data Collection |
Statistical Analysis
All analyses were processed using SPSS19.0 and AMOS17.0. Item discrimination was tested using the index of Discrimination (D), critical ratio, and Corrected Item-Total Correlation (CITC). Factor analysis was used for EFA to select items and reduce dimensionality. Structural equation model (SEM) was used for CFA to verify the construct validity, convergent validity, and discriminant validity of the scale. Cronbach’s Alpha was used to test the reliability of the scale. The results were statistically significant if P < 0.05 (two-tailed).
Results
Item Analysis
Before carrying out EFA, item analysis was employed. Participants who ranked at the top 27th percentile among those who participated in the first phase of the survey constituted the high-score group, while those who ranked in the bottom 27th percentile constituted the low-score group. The discrimination index was defined as the difference between the scoring rate of the high-score group and the low-score group. The critical ratio was obtained by examining the difference in each item’s average score between higher and lower groups with independent-samples t-test. Additionally, CITC was also investigated (Table 3). As shown in Table 3, each item displayed strong discrimination and, hence, should not be deleted (D > 0.2, CITC > 0.3, critical ratio was significant).12–14
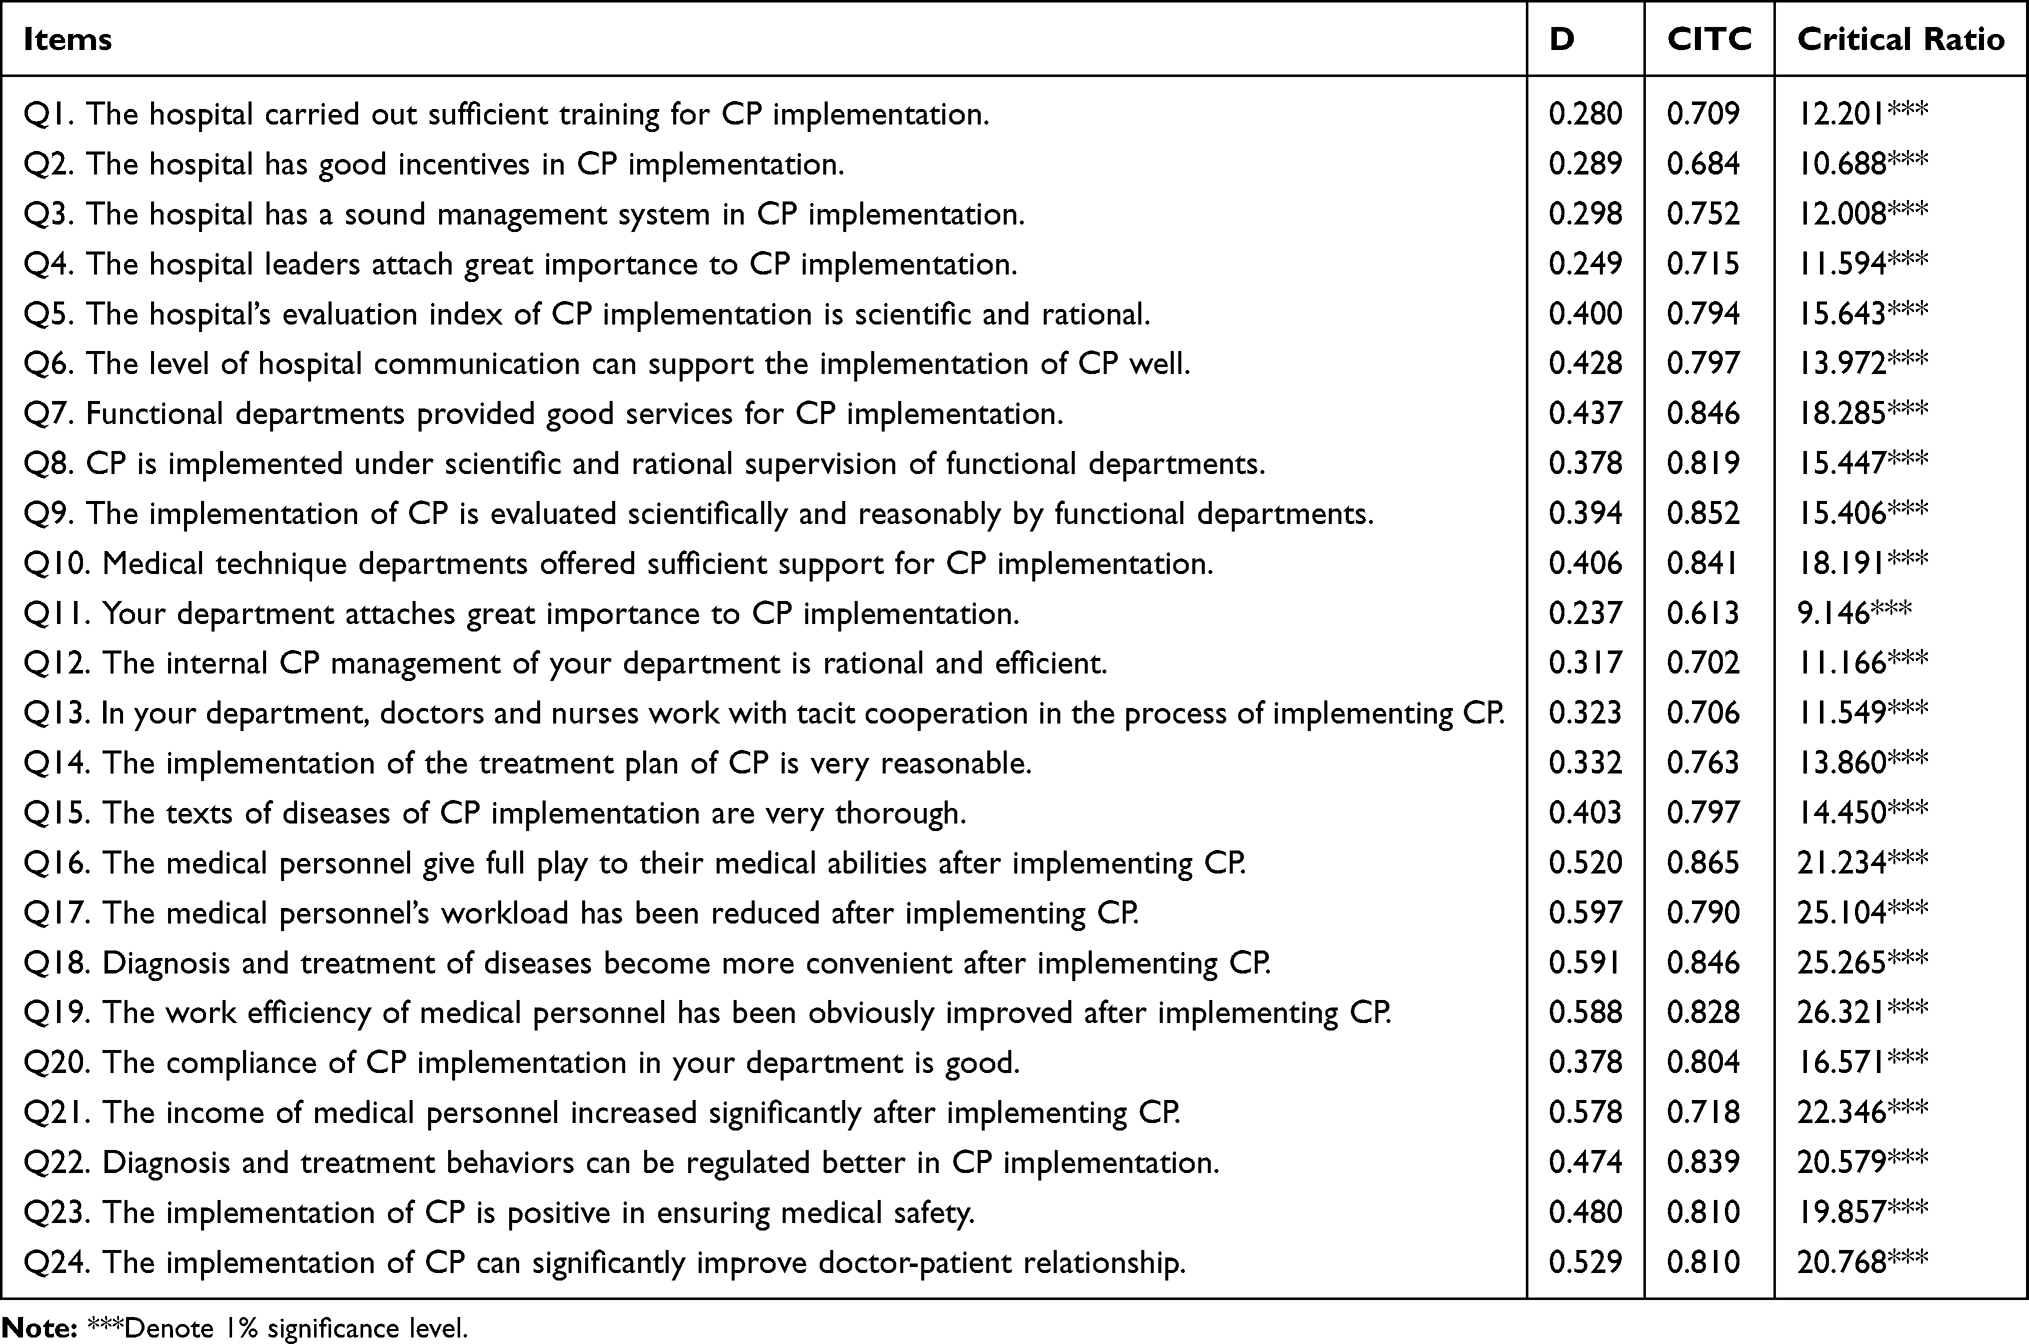 |
Table 3 Results of Discrimination Analysis of the Scale |
Exploratory Factor Analysis
Factor analysis is adopted to evaluate the structure of a set of variables, especially in developing a scale. This gives insights into the relationship between the developed scale and its potential variables.15 EFA is usually carried out in the early stage of research, providing tools for integrating variables and generating hypotheses about the underlying processes.16
The Kaiser-Meyer-Olkin (KMO) test and Bartlett’s test of sphericitywere initially utilized to test the correlation among the 24 items. The results demonstrated that KMO was 0.955, which was higher than 0.9. According to the Kaiser-Guttman rule, this means a strong correlation existed among those 24 items.17 Moreover, this means that the sample size of our study was sufficient for the items of the scale.18 Bartlett’s test of sphericityrevealed that the correlation matrix of variables was not a unit matrix (χ2 = 7128.431, P = 0.000). That is, items in the scale were correlated with each other.19 These results indicate the appropriateness to further conduct factor analysis.
First EFA
The first EFA was used to screen out the items. Principal component analysis was used to conduct factor analysis of the scale. Based on the Kaiser-Guttman rule, factors whose eigenvalue was higher than 1 were extracted, and three common factors were obtained. The varimax rotation showed that the total variation of accumulative explained variance was 79.76% (Table 4). In light of item deletion criteria that communality was less than 0.3 and the factor loadings were less than 0.4, or the same loadings exist between two or more factors (differences between them should be less than 0.2),20 items Q10, Q15, and Q20 were removed. Then, a scale containing 3 common factors and 21 items was constructed.
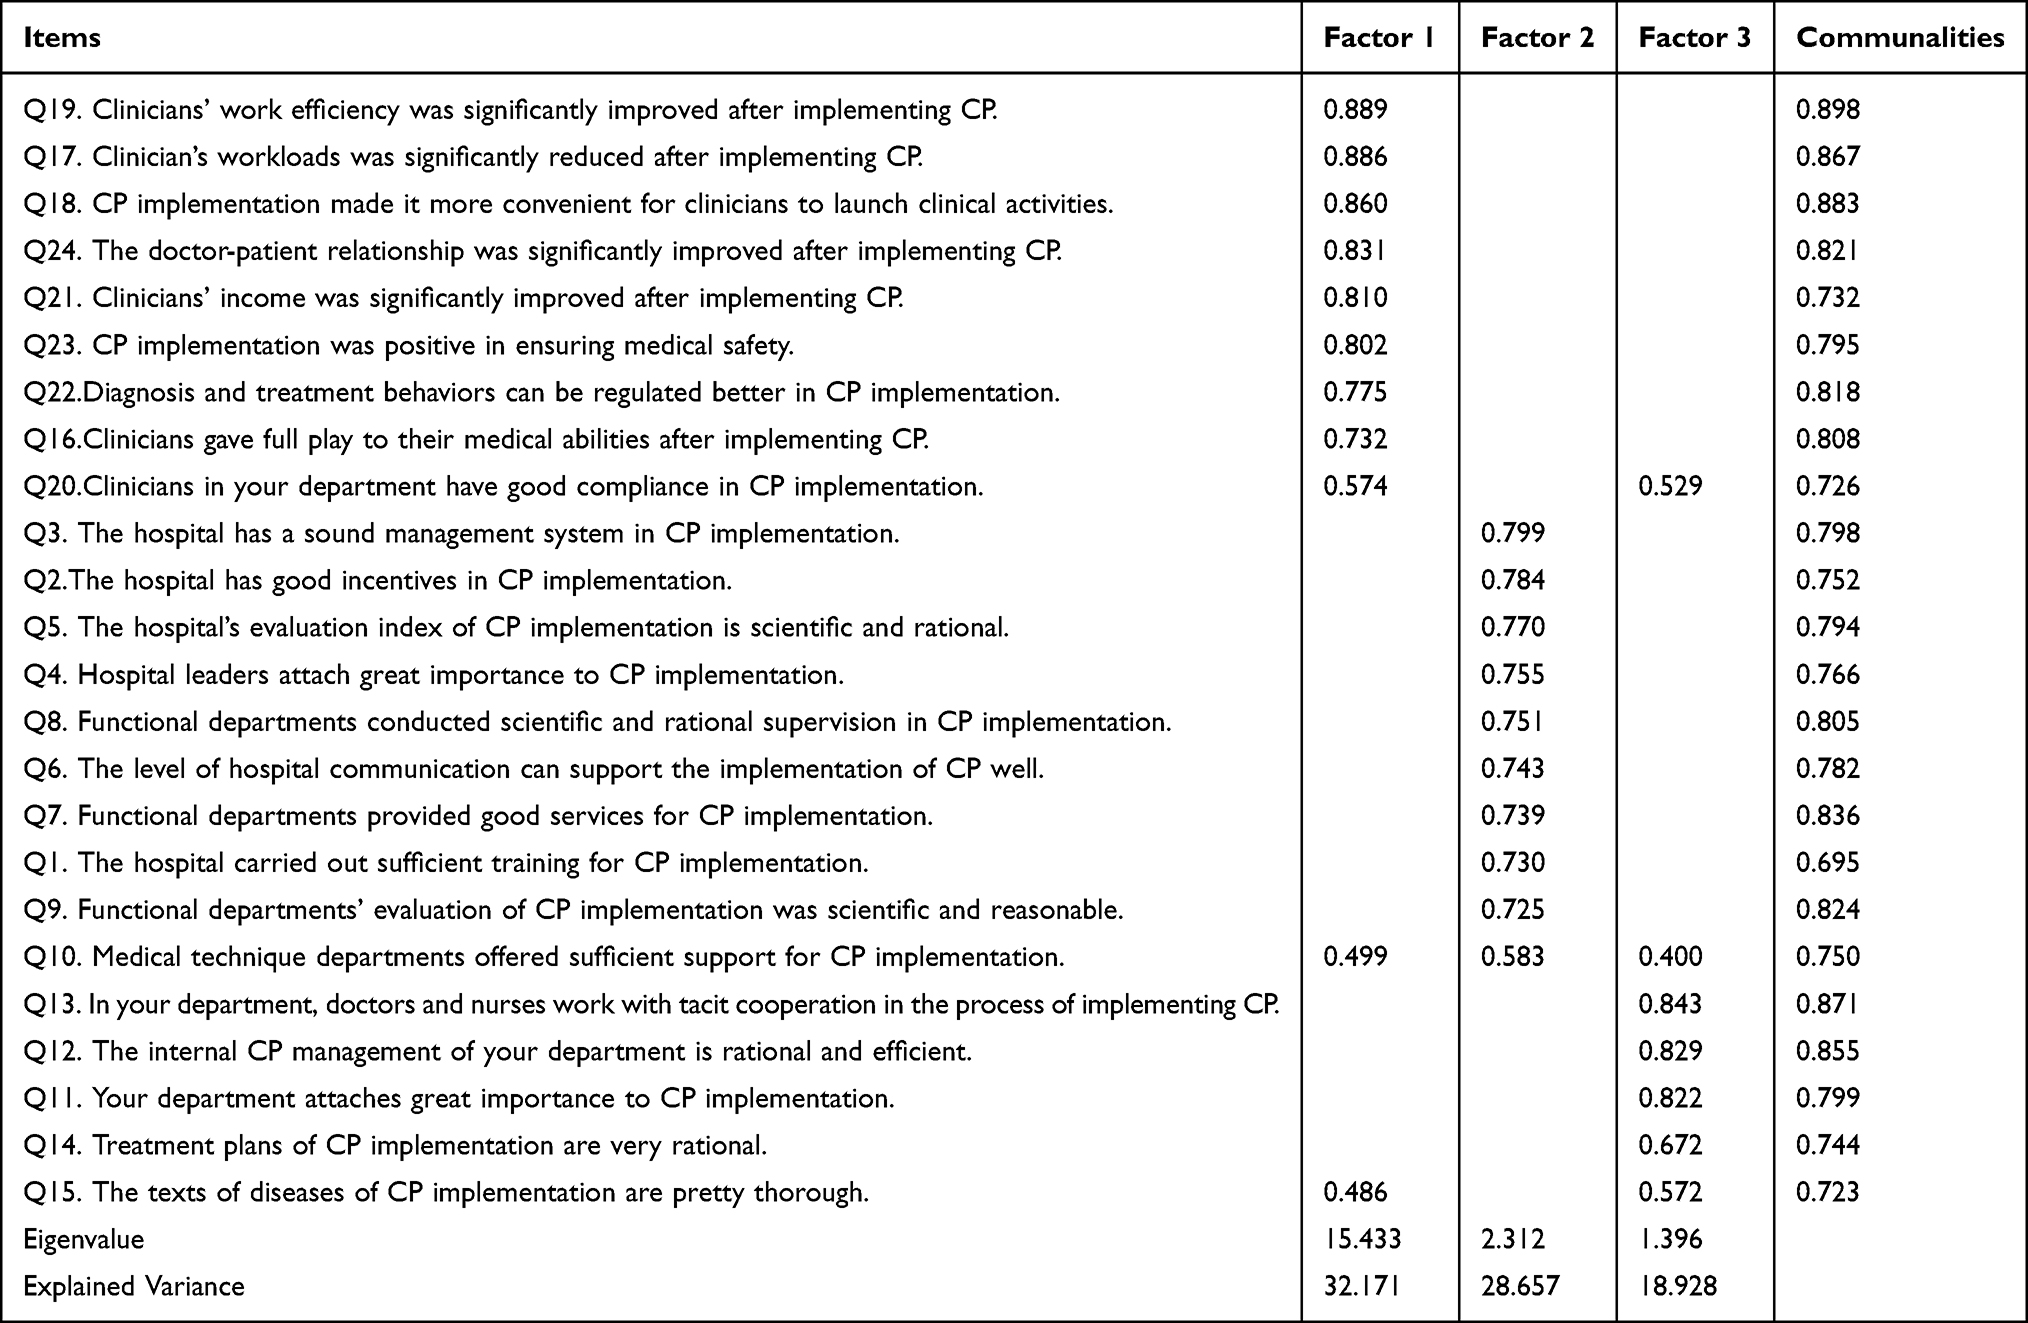 |
Table 4 EFA of the Initial Scale |
Second EFA
The second phase of EFA was used for dimensionality reduction. As shown in Table 5, KMO was 0.950, Bartlett’s test of sphericity was significant (P < 0.001), the factor loading of each item on its corresponding dimension ranged from 0.652 to 0.894, communality was greater than 0.3, the total variance of accumulative interpretation was 80.95%, and Cronbach’s alpha of each dimension was higher than 0.9.
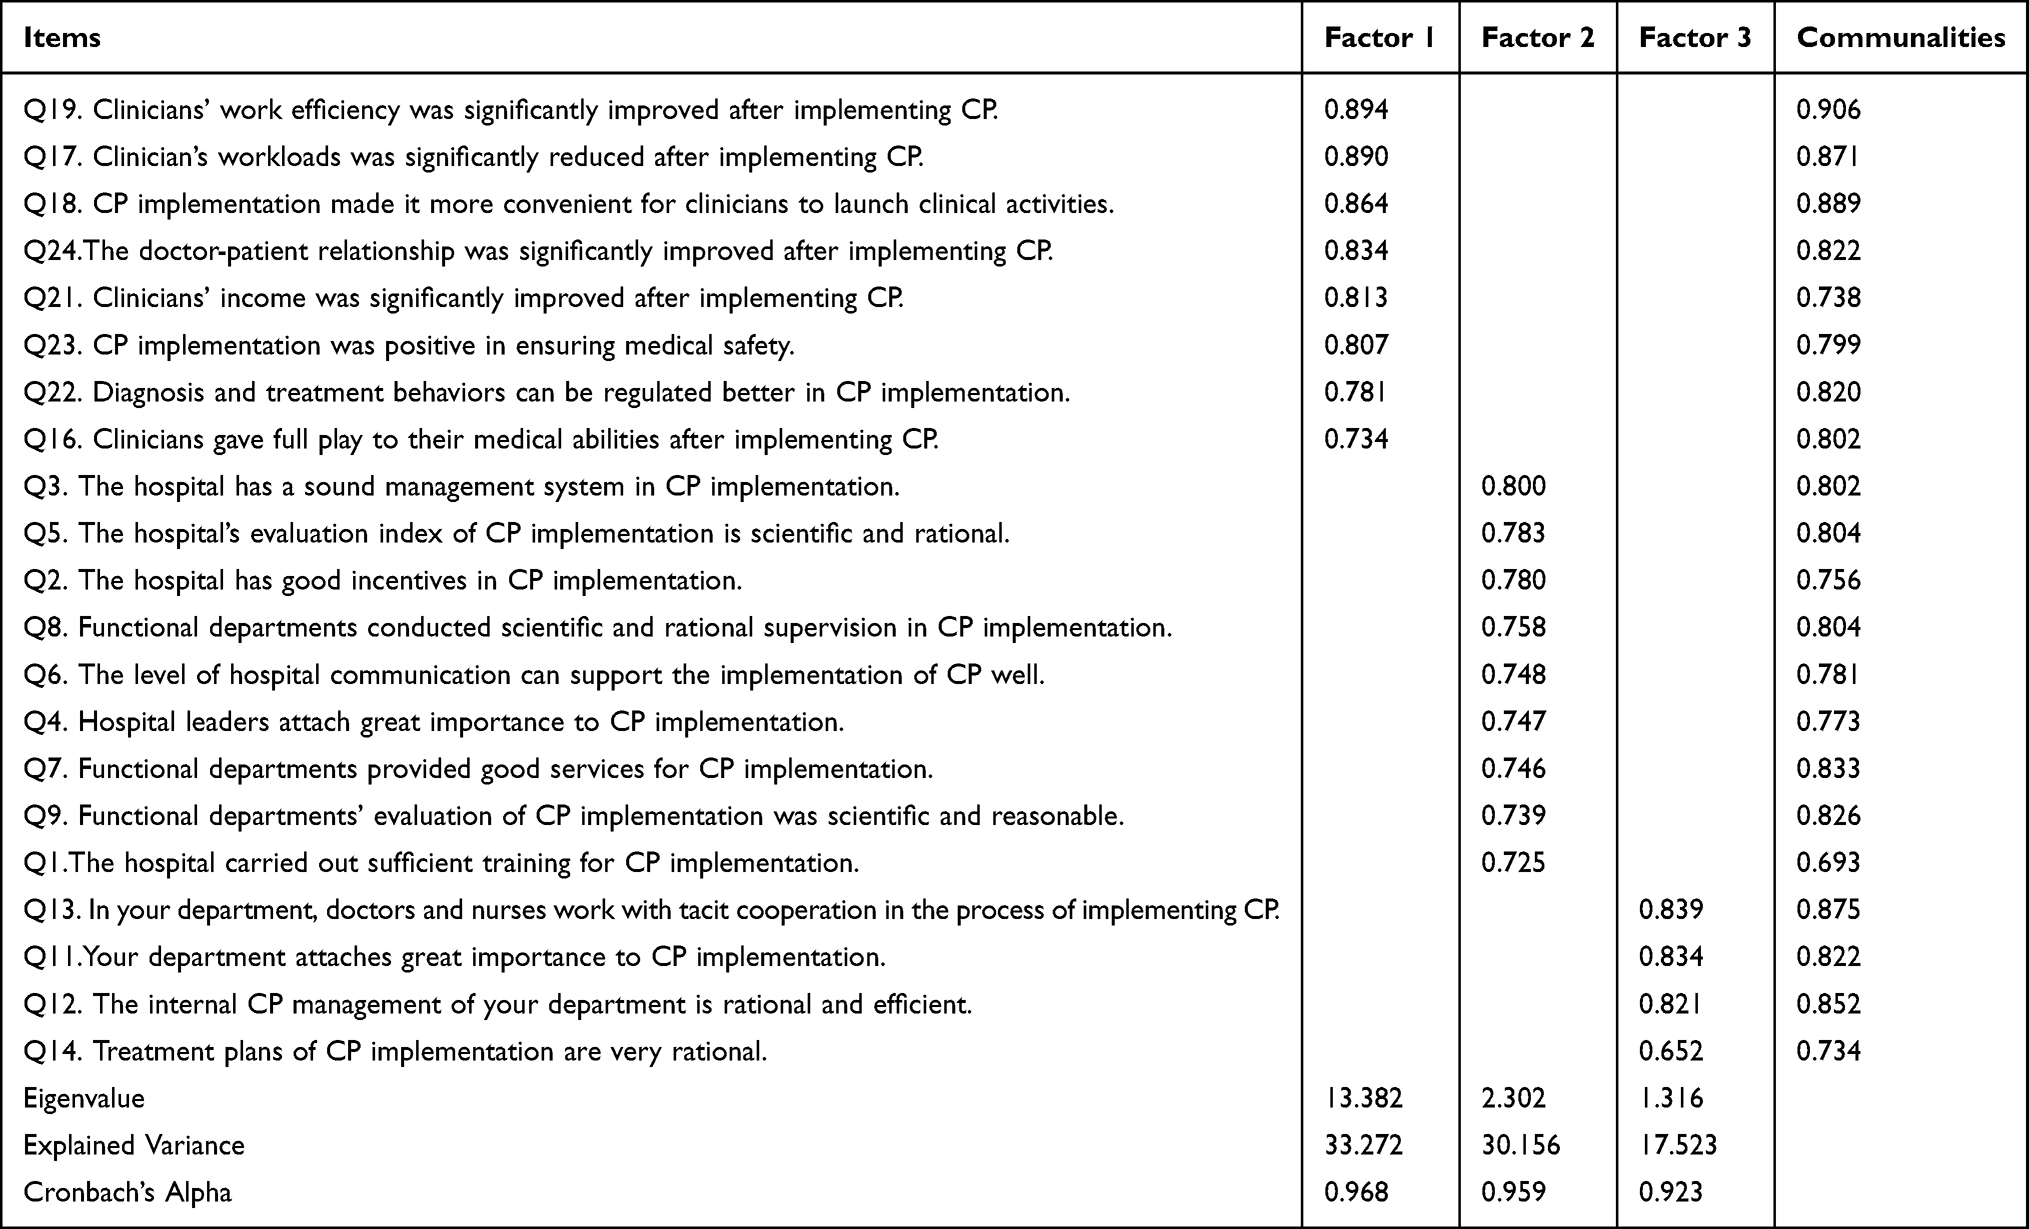 |
Table 5 EFA of the Initial Scale After Items Selection |
A scale containing 3 common factors and 21 items was constructed. According to the designed dimensions in the initial scale, three common factors were named. The first common factor was “effect perception,” reflecting the effects of CP implementation, which comprised 8 items (Q16, Q17, Q18, Q19, Q21, Q22, Q23, and Q 24). The second common factor 2, which revealed the level of support from various organizations during CP implementation, was “organization support” and consisted of 9 items (Q1, Q2, Q3, Q4, Q5, Q6, Q7, Q8, Q9). Common factor 3 was regarded as “process identity” and contained 4 items (Q11, Q12, Q13, Q14), displaying the degree of recognition or acceptance of CP implementation.
Confirmatory Factor Analysis
Model Fit Statistics of CFA
Confirmatory Factor Analysis (CFA) was used to explore the fitting degree of the conceptual model and actual data, convergent validity, and discriminant validity of the conceptual model. CFA was conducted by building a structural equation model based on the second-phase survey data. According to the results of EFA, a model involving first order and three factors was established to test clinicians’ satisfaction with CP implementation. The revised model is shown in Figure 1 (χ2/df = 5.602, NFI = 0.926, IFI = 0.938, CFI = 0.938, RFI = 0.914, TLI = 0.929, RMSEA = 0.095, RMR = 0.045).
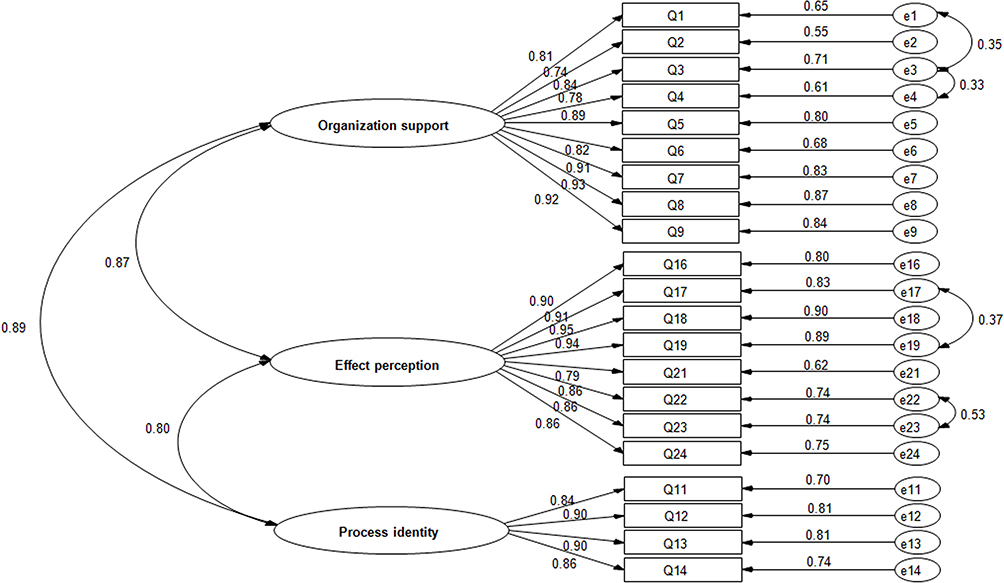 |
Figure 1 One order three factors model of clinicians’ satisfaction with CP implementation. |
The results of the structural equation three-factor model demonstrated that the standard factor loading of each entry on their respective dimensions was between 0.742 and 0.949, and the error variation in the model was positive. It indicated that the basic fit index of the first-order three-factor verification model of clinician’s CP satisfaction met the test standard and did not violate the model identification rules. In the model fit index, NFI, IFI, CFI, RFI, and TLI values were greater than 0.9, RMSEA < 1, RMR < 0.05; all met the reference standard, while χ2/df > 5, slightly higher than the reference standard.21 According to Zhonglin Wen and others, the χ2/df value is affected by the sample size. When the sample size is large, it cannot be used as a criterion to judge whether the model fits.22 The second phase of this study included a larger sample size of 513, and hence, χ2/df could be ruled out as a model fit test index. Therefore, it can be assumed that the first-order three-factor verification factor model of clinician’s CP satisfaction was well adapted to the actual observation data, the overall fit of the model was perfect, and the scale had good construct validity.
Convergent Validity
To evaluate convergent validity of the model, factor loadings, AVE, and CR were calculated (Table 6). As shown in Table 6, the standardized factor loadings of 21 variables were between 0.742 and 0.949. The AVE of effect perception, organization support, and process identity were 0.783, 0.727, and 0.766, respectively, and the CR were 0.960, 0.929, and 0.966, respectively. The model had a strong convergent validity (all standardized factor loadings > 0.7, all AVE > 0.5, all CR > 0.7).23,24
 |
Table 6 Convergent Validity Test |
Discriminant Validity
Discriminant validity among process identity, organization support, and effect perception were assessed by chi-square difference test (Table 7). If the difference value between the unlimited and limited model of each two potential constructs was higher than the test index (3.84) of discriminant validity of critical factor construct, the difference was considered non-significant (P < 0.05). That is to say, the hypothesis that there is a highly positive correlation (ρ = 1) between each two constructs is denied, and a significant difference exists between each two constructs. Thus, the discriminant validity of each two constructs is perfect.25 As shown in Table 7, the model reveals perfect discriminant validity since the difference value between the unlimited and limited model of each two potential constructs was higher than 3.84 (505.550, 42.657, and 77.838, respectively), denoting a significant difference (P < 0.001).
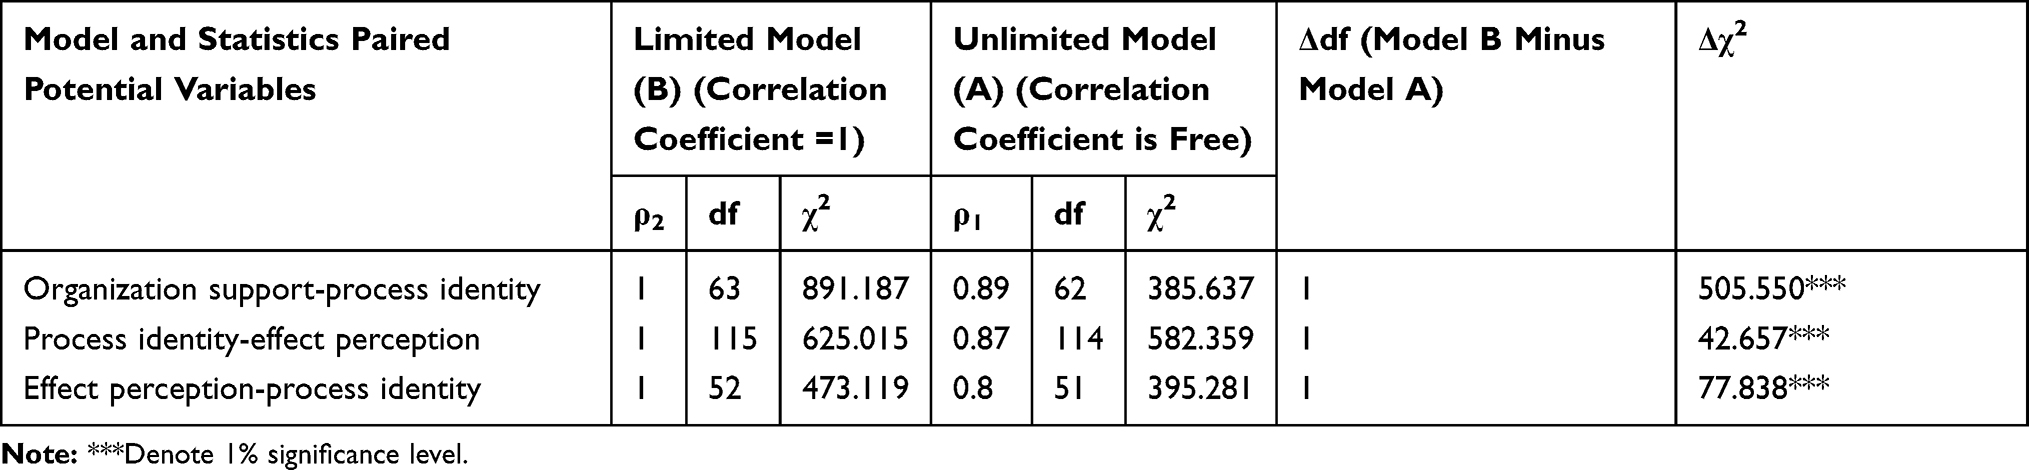 |
Table 7 Discriminant Validity Test |
Reliability and Item Discrimination
The internal consistency and item discrimination of the scale were examined (Table 8). As shown in Table 8, Cronbach’s Alpha of organization support, process identity, and effect perception were higher than 0.9 (0.960, 0.927, and 0.965, respectively). This indicates that the scale possesses excellent internal consistency.26 Additionally, we observed perfect item discrimination of the scale (D > 0.2, CITC > 0.5, critical ratio was significant).
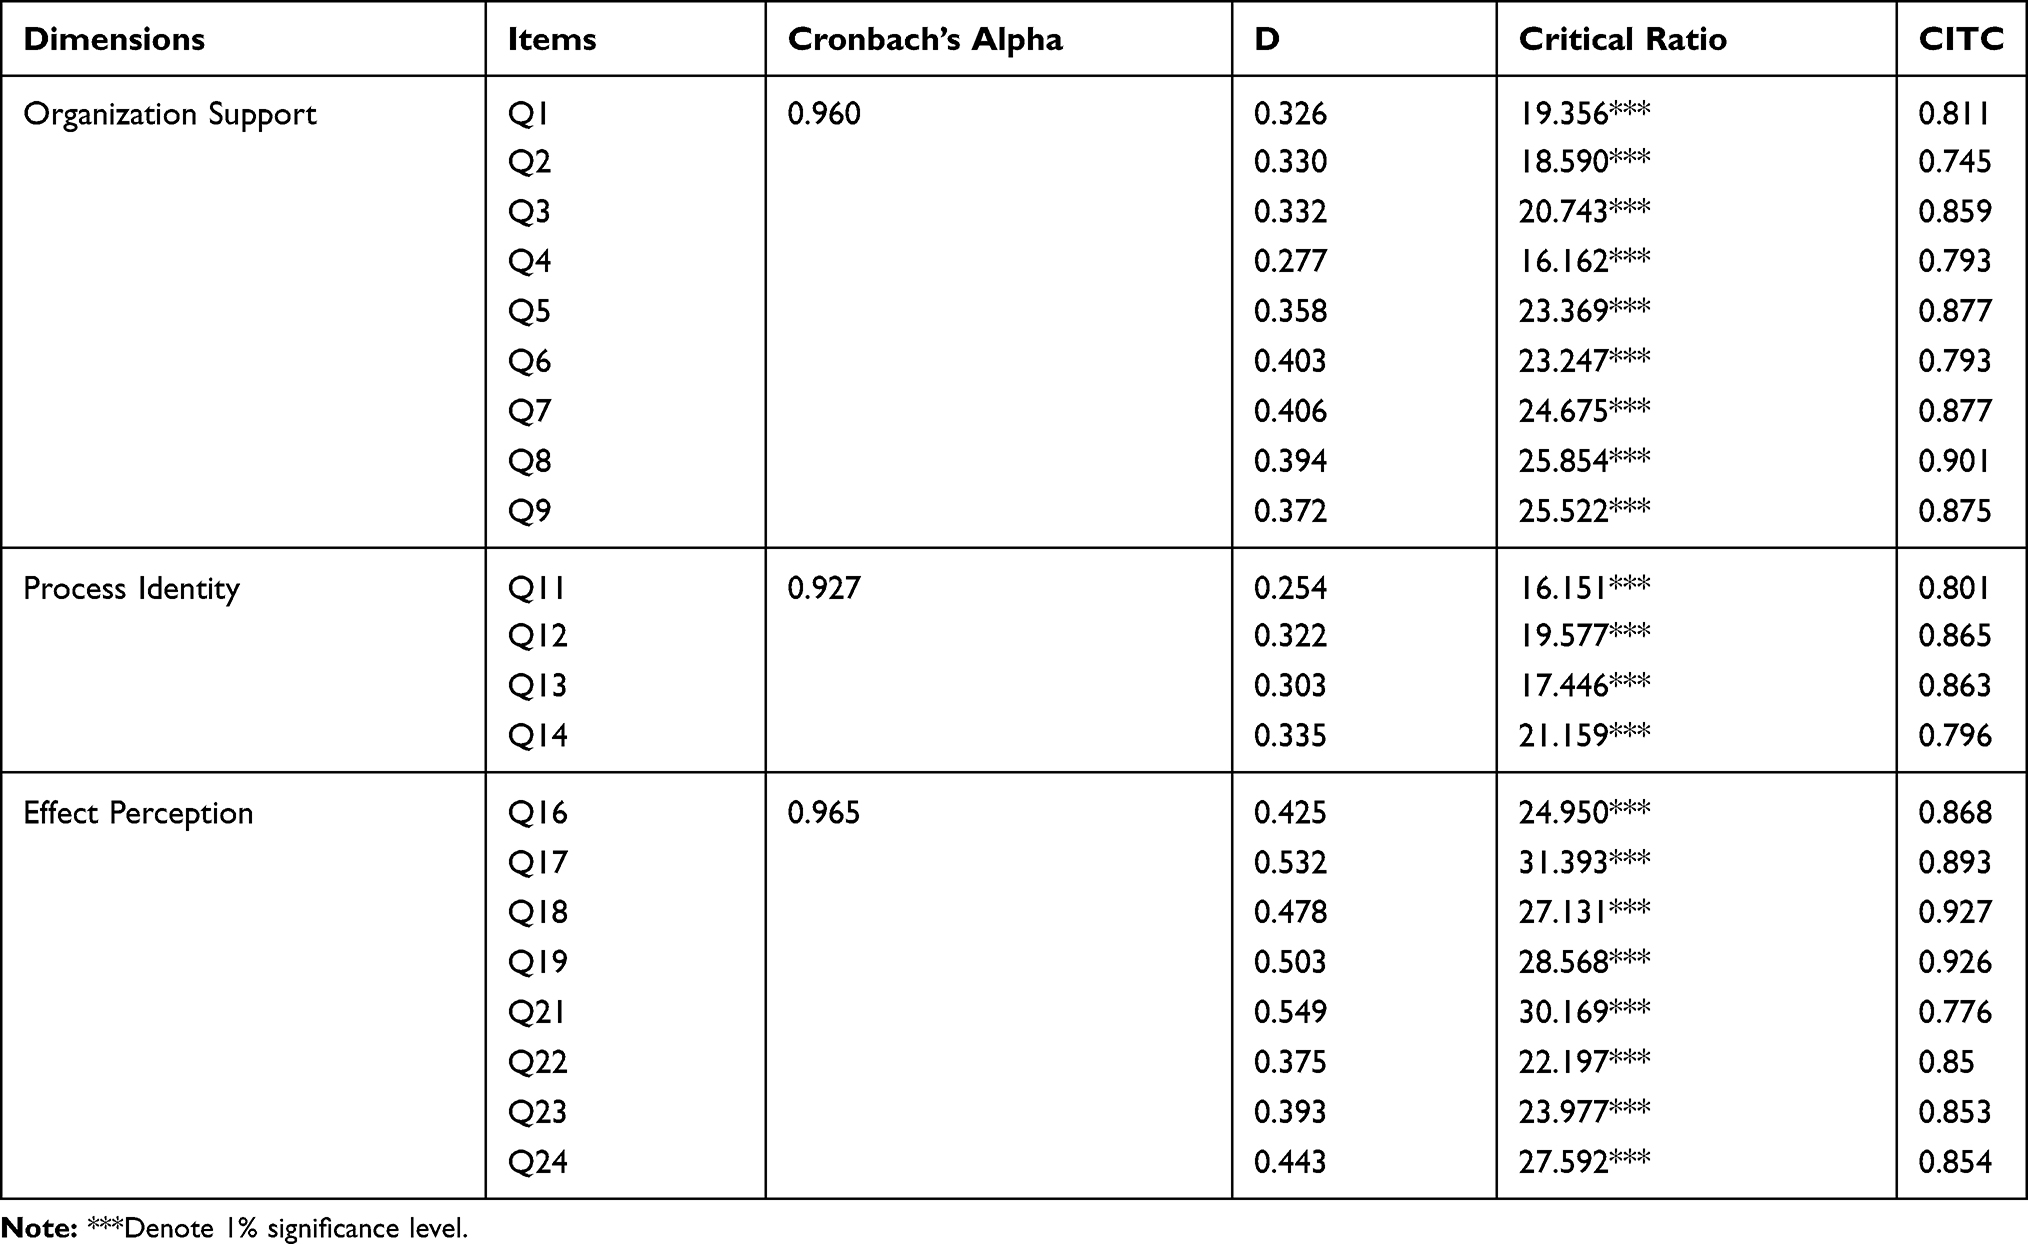 |
Table 8 Reliability and Discrimination Test of the Scale |
Discussion
Based on Kevser Özdemir’s suggestions for scale development,27 literature review and expert consultations are needed to determine the appropriateness of the items when setting up the scale. Also, data should be collected from different sample groups for evaluation required in the set of items. This study was developed and revised following all of these suggestions. We interviewed clinicians individually to improve the accuracy and appropriateness of items. Besides, the scale was evaluated by EFA and CFA. Thus, we believe that our research design is robust. We decided to use factor analysis to select items and reduce dimensionality. Factor analysis makes factor variables more interpretable and has high naming clarity through rotation. Multiple correspondence analysis is mostly used to process the rows and columns of contingency table data, and represents the relationship between rows and columns in the data table with low-dimensional graphics. Factor analysis is more used in scale development. SEM is widely used in validity tests and is recognized by many scholars. Therefore, the methods used in the statistical analysis of this study are appropriate and fit the purpose.
Validity and Reliability
Based on literature review, individual interviews, and expert consultation, the present study developed a 24-item scale to measure clinicians’ satisfaction with CP implementation in China. Through the first phase of data collection, 21 items in the initial scale were selected and divided into three dimensions based on item analysis and EFA. In the second phase, CFA was adopted to determine the construct validity, convergent validity, discriminant validity, and scale reliability. The results demonstrated perfect internal consistency, construct validity, convergent validity, and discriminant validity, indicating that the scale possessed good internal quality and stable measurement structure.
Structure of Scale
The developed scale comprised three dimensions: organization support, process identity, and effect perception.
The dimension of organizational support reflects clinicians’ perception of hardware support (such as technology, environment, software, and policy), emotion, software support by hospital leadership, and functional management during the implementation of CP management. These perceptions reflect whether the organizational structure and operational structure of the hospital to implement the CP are reasonable, and whether the hospital attaches importance to and pays attention to the attitude of clinicians in the process of implementing the CP. According to the theory of social exchange, the relationship between employees and organizations follows the principle of reciprocity. That is to say, when employees perceive support, care, and help from the organization, employees will respond positively to the organization. They will show better satisfaction in their work and more actively participate in organizational work. There is also evidence from current research indicating that employees with a high sense of organizational support have a positive work attitude and higher satisfaction. Therefore, doctors’ perception of organizational support is an important factor in evaluating the satisfaction of CP implementation.
The dimension of process identity mainly reflects the clinicians’ recognition of the internal management and operation of the department and the treatment plan of the CP in the process of implementing the CP. It is the clinicians’ perception of the practicability, rationality, and fluency of the implementation of the CP, whether the internal operation mechanism of the department is efficient, whether the cooperation between doctors and nurses is tacit, and whether the path scheme is reasonable and other process factors can affect the smooth implementation of CP. If there are challenges in the implementation process of CP, the clinicians’ perception of the implementation process will be transformed into tension and pressure. According to the theory of burnout, when employees cannot effectively deal with the stress and tension at work, they will produce a comprehensive symptom of emotional exhaustion, personality disintegration, and a low sense of achievement, all of which lead to the rapid consumption of emotional resources and a huge psychological gap. This will result in the phenomenon of lack of enthusiasm, job satisfaction decline, and work inefficiency, which will affect the development of CP work.
The dimension of effect perception mainly reflects the clinicians’ perception of their own work efficiency, diagnosis and treatment behavior, economic benefits, and the levels of change in the quality of care and doctor-patient relationship after implementing CP. It evaluates CP implementation results by clinicians from the doctors’ perspective and the evaluation of doctors’ returns. According to Dunn & Stephens on job satisfaction, employee job satisfaction is determined by the gap between the employee’s reward and the expected return. The smaller the gap is, the higher the level of job satisfaction is. This equates to what the implementation of CP brings to doctors, whether it improves doctors’ work efficiency, increases doctors’ income, or improves the doctor-patient relationship. These perceptions directly affect doctors’ job satisfaction, which then affects their attitude toward the implementation of CP.
Limitations and Implications
The results of our study should be read in the context of certain limitations. First, the sample size was relatively small. Second, a network survey was used in the sample data collection, and the quality control of the investigation process did not have enough granularity. This might have impacted data authenticity. Third, while the scale was constructed with extensive input, it is yet to be shown conclusively that it accurately captures the clinicians’ views of CP implementation. Finally, the scale applies only to clinicians, and it is not a comprehensive tool to assess CP, nor does it apply to patients or other stakeholders involved in CP. Therefore, future studies are needed to examine the generalizability of the scale, the repeatability of participants’ views on CP implementation, and the extent to which a participant’s rating on the scale might change over time.
Despite these limitations, this is the first scale of its kind in China. It lays the foundation for related research and paves the way for more detailed research work in the future.
Conclusion
We developed a satisfaction scale of Chinese clinicians for CP implementation. The scale included three dimensions: organizational support, process identification, and effect perception. It comprehensively reflects clinicians’ satisfaction perception of the organization structure, guarantee mechanism, process operation, and result evaluation of CP implementation from the aspects of structure, process, and results of doctors’ implementation of CP. The scale has good validity, internal consistency, and item discrimination, and it can be used to evaluate clinicians’ satisfaction in the implementation of CP. The scale can help medical institutions and health administrative agencies understand clinicians’ job satisfaction in the implementation of CP. It can provide a reference for medical institutions to carry out CP management.
Ethics Statement
The study complied with the Declaration of Helsinki and was approved by the Ethics Committee Review Board of Sichuan Vocational College of Health and Rehabilitation. In the implementation process of this study, each questionnaire survey was conducted after obtaining the informed consent of the respondents who agreed to have their data used in our study. All the data analyzed is anonymous.
Acknowledgments
We thank the Technological Innovation Miao Zi Project Management Office of Sichuan Province (Grant No. 2020113), Zigong Municipal Science and Technology Bureau (Grant No. 2019rkx08), Health Commission of Zigong (Grant No. 19yb032) for their financial support. We would also thank Jay Pan, Xiaojun Lin and Mengrong Zhu for their assistance. Lastly, we would like to express gratitude to EditSprings for the expert linguistic services provided. These authors are co-first authors as they contributed equally to this work: Junlong Li and Kui Shen.
Disclosure
The authors report no conflicts of interest in this work.
References
1. Rotter T, Kinsman L, James E, et al. The effects of clinical pathways on professional practice, patient outcomes, length of stay, and hospital costs: cochrane systematic review and meta-analysis. Eval Health Prof. 2012;35:3–27. doi:10.1177/0163278711407313
2. Sylvester AM, George M. Effect of a clinical pathway on length of stay and cost of pediatric inpatient asthma admissions: an integrative review. Clin Nurs Res. 2014;23:384–401. doi:10.1177/1054773813487373
3. Kalmet PHS, Koc BB, Hemmes B, et al. Effectiveness of a multidisciplinary clinical pathway for elderly patients with hip fracture: a multicenter comparative cohort study. Geriatr Orthop Surg Rehabil. 2016;7:81–85. doi:10.1177/2151458516645633
4. Nicola D. Integrated Care Pathways: A Guide to Good Practice. UK: National Leadership & Innovation Agency for Healthcare; 2005.
5. Cheah TS. The impact of clinical guidelines and clinical pathways on medical practice: effectiveness and medico-legal aspects. Ann Acad Med Singap. 1998;27:533.
6. Chinese Ministry of Health. [Notice on pilot work of clinical pathway management]; 2009. Chinese.
7. Chinese Ministry of Health. [Guiding principles of clinical pathway management (Trial)]; 2009. Chinese.
8. Chinese National Health and Family Planning Commission. [Action plan for further improvement of medical services]; 2015. Chinese.
9. National Health Commission of the People’s Republic of China. [Notice on printing and distributing clinical pathway of diseases (2019 Edition)]; 2020. Chinese.
10. Wang D, Chen Z, Zhang L. Analysis of medical workers’ satisfaction and influencing factors with the implementation of clinical pathway. Chin Hosp Manag. 2014;34:31–33.
11. Chinese Ministry of Health. [Implementation rules of evaluation standards for tertiary general hospitals (2011 Edition)]; 2011. Chinese.
12. Shi K, Guo H, Liu J. The structural dimension and scale development of enterprise employees’ work well-being. J Sichuan Univ Sci Eng. 2020;35:1–17.
13. Liu Y, Zhang D, Xu Y, et al. Reliability and validity of the Chinese Version of Relational Self-esteem Scale (RSES) in Chinese Middle School Students. Chin J Clin Psychol. 2019;27:1187–1191.
14. Munro BH. Statistical Methods for Health Care Research. Lippincott; 1995.
15. Polito`hara D. Data Analysis & Statistics for Nursing Research. Appleton & Lange; 1996.
16. Tabachnick BG, Fidell LS. Using Multivariate Statistics (6th Ed.). Essex, England: Pearson Education Limited; 2014.
17. Kaiser HF. An index of factorial simplicity. Psychometrika. 1974;39:32–36. doi:10.1007/BF02291575
18. Pett MA, Lackey NR, Sullivan JJ. Making Sense of Factor Analysis. Thousand Oaks, CA: SAGE Publication; 2003.
19. Hobart JC, Riazi A, D L L, et al. Improving the evaluation of therapeutic interventions in multiple sclerosis: development of a patient-based measure of outcome. Health Technol Assess. 2004;8:1–60.
20. Zhang K, Wang A, Huang X, et al. Research and development of self-management rating scales for patients with heart failure. J Qingdao Univ. 2014;50:262–265.
21. Wu M. Structural Equation Modeling-Operation and Application of Amos (2nd Edition). Chongqing: Chongqing University Press; 2010.
22. Wen Z, Hou T, Herbert WM. Structural equation model testing: cutoff criteria for goodness of fit indices and chi-square test. Acta Psychol Sin. 2004;36:186–194.
23. Fornell C, Larcker DF. Evaluating structural equation models with unobservable variables and measurement error: a comment. J Mark Res. 1981;18:375–381. doi:10.1177/002224378101800313
24. Bentler PM, Bonett DG. Significance tests and goodness of fit in the analysis of covariance structures. Psychol Bull. 1980;88:588–606. doi:10.1037/0033-2909.88.3.588
25. Wu M. Structural Equation Model - Advanced Amos Practice. Chongqing: Chongqing University Press; 2013.
26. Devellis RF. Scale Development: Theory and Applications (Applied Social Research Methods Series, Vol. 26). Newbury Park: Sage; 1991.
27. Özdemir K, Menekşe D, Çınar N. Development of obsessive and compulsive behaviors scale of mothers in postpartum period regarding baby care: validity and reliability. Perspect Psychiatr Care. 2020;56:379–385. doi:10.1111/ppc.12445
 © 2021 The Author(s). This work is published and licensed by Dove Medical Press Limited. The
full terms of this license are available at https://www.dovepress.com/terms
and incorporate the Creative Commons Attribution
- Non Commercial (unported, 3.0) License.
By accessing the work you hereby accept the Terms. Non-commercial uses of the work are permitted
without any further permission from Dove Medical Press Limited, provided the work is properly
attributed. For permission for commercial use of this work, please see paragraphs 4.2 and 5 of our Terms.
© 2021 The Author(s). This work is published and licensed by Dove Medical Press Limited. The
full terms of this license are available at https://www.dovepress.com/terms
and incorporate the Creative Commons Attribution
- Non Commercial (unported, 3.0) License.
By accessing the work you hereby accept the Terms. Non-commercial uses of the work are permitted
without any further permission from Dove Medical Press Limited, provided the work is properly
attributed. For permission for commercial use of this work, please see paragraphs 4.2 and 5 of our Terms.