Back to Journals » Diabetes, Metabolic Syndrome and Obesity » Volume 13
The Association Between Hemoglobin HbA1c with Serum Inorganic Phosphate in Children with Type 1 Diabetes
Authors Dalili S, Koohmanaee S, Nemati SAR, Hoseini Nouri SA, Hassanzadeh Rad A, Kooti W ![]()
Received 25 September 2019
Accepted for publication 4 August 2020
Published 29 September 2020 Volume 2020:13 Pages 3405—3409
DOI https://doi.org/10.2147/DMSO.S232400
Checked for plagiarism Yes
Review by Single anonymous peer review
Peer reviewer comments 2
Editor who approved publication: Professor Ming-Hui Zou
Setila Dalili,1 Shahin Koohmanaee,1 Seyyed Amir Reza Nemati,1 Seyyedeh Azade Hoseini Nouri,1 Afagh Hassanzadeh Rad,1 Wesam Kooti2
1Pediatric Diseases Research Center, Guilan University of Medical Sciences, Rasht, Iran; 2Lung Diseases & Allergy Research Center, Research Institute for Health Development, Kurdistan University of Medical Sciences, Sanandaj, Iran
Correspondence: Wesam Kooti; Shahin Koohmanaee Tel +989336583929
Email [email protected]; [email protected]
Background: Diabetes mellitus is one of the most common chronic metabolic diseases in children and adolescents, which changes the cellular metabolism. Phosphorus is an essential element for metabolism. Early in the progression of diabetes, a paradoxical metabolic imbalance in inorganic phosphate (Pi) occurs that may lead to reduced high energy phosphate and tissue hypoxia. While low and high uncontrolled blood sugars can be easily recognized by clinical symptoms, low and high plasma inorganic phosphate remain unrecognizable. Therefore, we aimed to assess the association between hemoglobin A1c (HbA1c) with serum inorganic phosphate in children with type 1 diabetes.
Materials and Methods: This cross-sectional study was conducted on 102 patients selected from a pediatric ward in 17th Shahrivar hospital in Rasht, North of Iran. Clinical data including age, sex, height, weight, BMI, duration of diabetes, the level of HbA1c, and phosphorus were gathered. The level of HbA1c was adjusted by age in the final analysis.
Results: The mean age of samples was 9.98± 3.91 years old and 46 participants (45.1%) were male. It was found that HbA1c had a reversed and significant relationship with BMI (r=− 0.215 and P=0.03), but there was no correlation between phosphate, age, height and weight, duration of diabetes mellitus, or rate of insulin consumption with HbA1c (P> 0.05).
Conclusion: The finding showed that HbA1c had a reversed relationship with BMI but there was no correlation between phosphate and HbA1c.
Keywords: phosphate, diabetes mellitus, child, glycated hemoglobin A, Iran
Introduction
Diabetes mellitus (DM) is one of the most common chronic metabolic diseases in children and adolescents.1 Hyperglycemia due to absolute insulin deficiency, or a reduction in the biologic effectiveness of insulin or both, causes secondary pathophysiological alterations in multiple organ systems and high mortality and morbidity.2 HbA1c assay is the most commonly used measurement of chronic hyperglycemia in epidemiological studies.3 Achieving near-normal HbA1c levels has been shown to reduce long-term complications and HbA1c assay is recommended to determine the suitability of the treatment.4 DM causes secondary complications such as blindness, kidney damage, cardiovascular disease, and lower-limb amputations.5 These complications are directly due to insulin deficiency, but rather suggest that the changes are related to indirect effects of insulin, like lowering of plasma inorganic phosphate.6
Studies showed that disturbances in the metabolism of inorganic phosphate (Pi) in diabetes leads to early functional microvascular changes in the retina and kidneys.7 Phosphorus is an essential element for metabolism, because containing compounds have important roles in cell structure (cell membrane and nucleic acids), cellular metabolism (generation of ATP), regulation of subcellular processes (phosphorylation of key enzymes), and maintenance of acid–base homeostasis (urinary buffering).8 Plasma contains both inorganic and organic phosphates, but only inorganic phosphate is measurable. Pi concentration is an important factor in metabolism and the function of enterocytes, kidney tubular cells, mitochondrial function, muscle function, and oxygen consumption rate.7,8 When sufficient phosphate and oxygen are not available for adenosine triphosphate (ATP) synthesis, cell homeostasis cannot be maintained and may result in cell lysis.7
During diabetes progression, a paradoxical metabolic imbalance in Pi occurs that may lead to reduced high energy phosphate and tissue hypoxia.7,9 In diabetes, elevated blood glucose concentrations depolarize the brush border membrane for Pi reabsorption which leads to hyperphosphaturia. While low and high uncontrolled blood glucose can be easily recognized by clinical symptoms, low and high plasma inorganic phosphate remains unrecognizable. Instead, it may be presented by vague and non-specific symptoms such as tissue hypoxia, muscular weakness, neurological problems, erythrocyte and leukocyte dysfunction, and impaired myocardial performance.10–12 There is limited research in this regard evaluating Pi status among patients with type 1 diabetes (T1DM). Therefore, this study aimed to evaluate the association between HbA1c with serum inorganic phosphate in children with type 1 diabetes, because early screening and treatment can save the patients from complications associated with phosphate imbalance.
Materials and Methods
Studied Population
This cross-sectional study was conducted on 102 patients selected from a pediatric ward in 17th Shahrivar hospital in Rasht, North of Iran. The samples were selected randomly.
Ethical Consideration
Ethical approval was obtained from Guilan University of Medical Sciences (No=IR.GUMS.REC.1396.219, 6 SEP 2017), and informed consent were obtained from parents. This study was conducted in accordance with the Declaration of Helsinki.
Inclusion and Exclusion Criteria
The inclusion criteria were the existence of type 1 diabetes mellitus, age under 16 years old, and at least 6 months’ duration of disease. Patients were excluded from the study if they had any history or document of rickets, mal-absorption, and parathyroid, renal and liver diseases, Fanconi syndrome, and supplement therapy with calcium and phosphate, and others who have used diuretics and glucocorticoids.
Gathering Data
Data were gathered by researchers consisting of age, sex, height, weight, BMI, duration of diabetes, the level of HbA1c, and phosphorus. The level of HbA1c was adjusted by age. The measurement of normal phosphorus and HBA1C at different ages are summarized in Table 1.
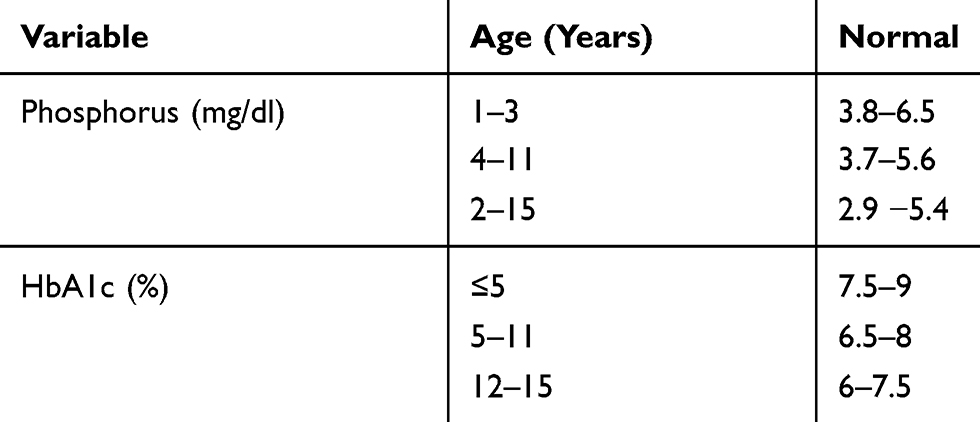 |
Table 1 Normal Phosphorus and HBA1C at Different Ages |
All blood samples were obtained between 8:00 and 10:00 a.m. The sampled blood was approximately 4cc (2cc for phosphate and calcium, 2cc for HbA1c). The sample was measured by laboratory expert. HbA1c, phosphate, and calcium were measured by immunoturbidimetric, UV – TEST, and Arsenazo III, respectively (Pars Azmun Co., Iran).
Statistical Analysis
Data analysis was done by SPSS 21. For descriptive quantitative variables such as HbA1c and phosphorus, mean and standard deviation were assessed. For qualitative variables such as hypophosphatemia and HbA1c control, investigators measured frequency and percentage. To assess the correlation of HbA1c and phosphorus, Pearson Correlation Coefficient was performed if the distribution of HbA1c and phosphorus was normal according to Kolmogorov–Smirnov test. For determining the association between hypophosphatemia and HbA1c control, investigators used the chi-square test and for determining the AUC for predicting phosphatemia by HbA1c, a ROC curve was applied. P-value <0.05 indicated statistical significance.
Results
Out of 102 patients who were included in the study, 46 (45.1%) were male and 56 (54.9%) were female, with a mean age of 9.98±3.91 years old. Most of the patients were aged 4–11 years (51%). Other clinical information is presented in Table 2.
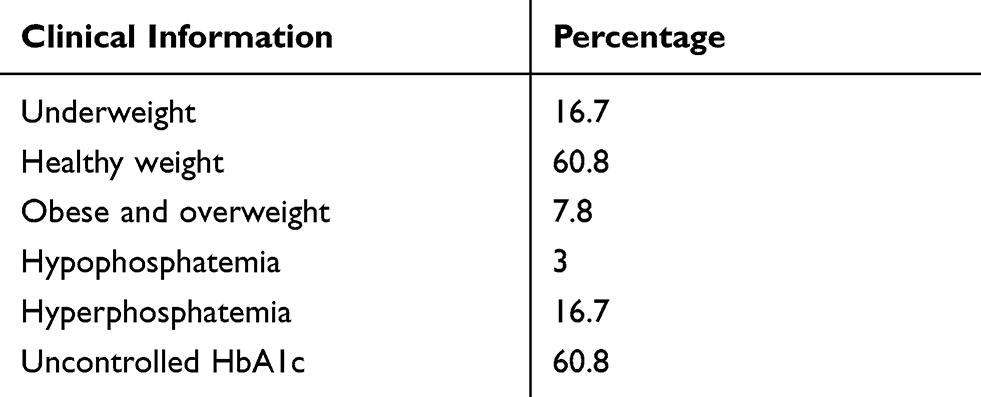 |
Table 2 Clinical Information of the Studied Samples |
The mean of BMI, HbA1c, duration of diabetes mellitus, and rate of insulin consumption were 18.13, 9.55 mg/dL, 4.74 mg/dL, 8.27%, 33.35 months, and 35.23 units/day, respectively. Phosphate had a reversed and significant relationship only with age (r=−0.287 and P=0.003), and height (r=0.2331 and P=0.02). However, it was found that hemoglobin A1C had a reversed and significant relationship with BMI (r=−0.215 and P=0.03), but there was no significant correlation between phosphate, age, height and weight, duration of diabetes mellitus, or rate of insulin consumption with HbA1c. Although there was no significant correlation between duration of diabetes mellitus with HbA1c (r=0.173 and P=0.083), this correlation was slightly significant (Table 3).
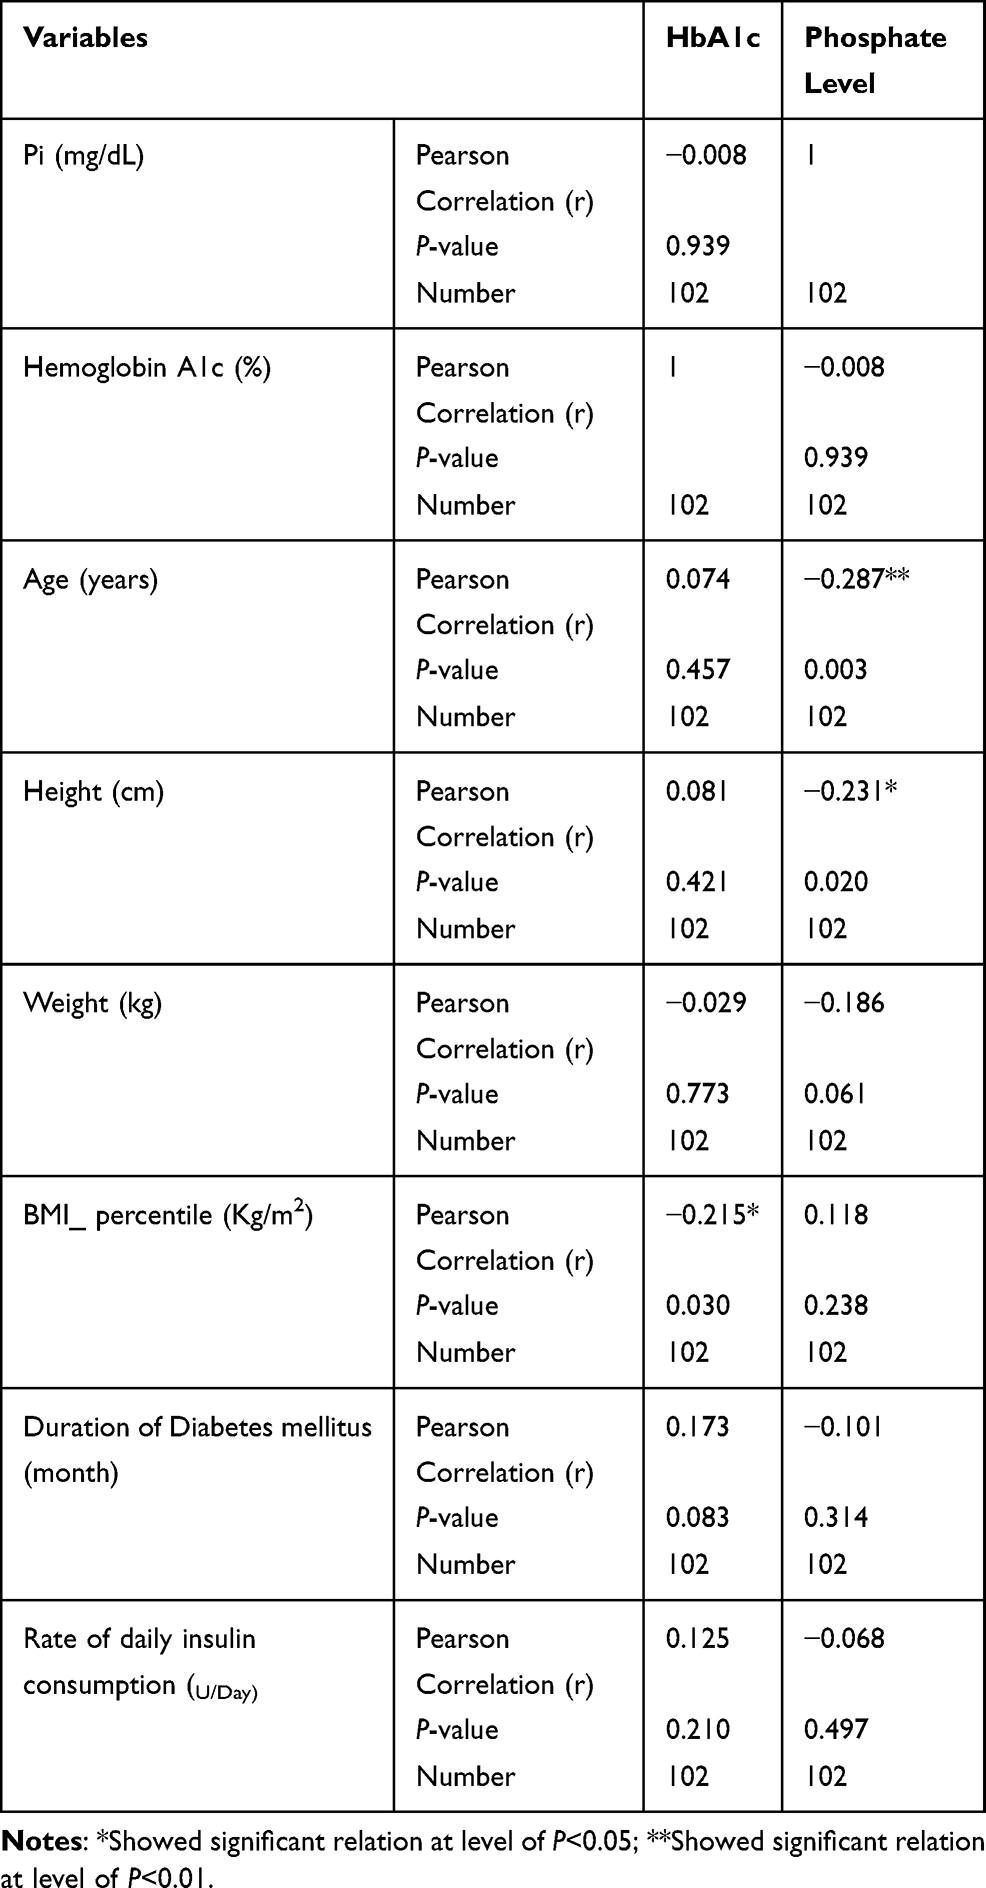 |
Table 3 Pearson Correlation Among the Studied Variables |
Discussion
Diabetes eventually causes secondary pathologies, hence exploration and finding the pathophysiological pathways of these complications is essential and early detection of disturbances are valuable. The aim of the present study was to evaluate the association between HbA1c with serum inorganic phosphate in children with type 1 diabetes, based on the hypotheses that blood glucose has an effect on intra and extracellular phosphorus and serum inorganic phosphate levels of HbA1c.
In this study, there was no significant difference between Pi level in male and female diabetic children which was consistent with Vorum et al, which assessed it in adult patients with diabetes. However, this is inconsistent with Xu et al,10 which demonstrated higher Pi levels in female than male children. The differences between the finding may be due to samples size or age in these studies.
In this study, there was a negative correlation between height and age with serum Pi. This finding was consistent with Marwaha et al11 and Xu et al's10 studies. In Xu et al.'s study, 2,342 healthy children aged 10–18 years were investigated. It’s probably because they need more of this mineral to help their bones develop. As considered in Table 1, a decrease in normal phosphorous range in older age is a physiologic change.
HbA1c had a significant negative correlation with BMI and this result may indicate better weight gain because of improved glycemic control. Our finding is consistent with Nansel et al,12 who examined cross-sectional and longitudinal associations of BMI with HbA1c in youth with type 1 diabetes. However, this is inconsistent with Babikr et al,13 who reported a positive correlation between HbA1c in diabetic patients with BMI. Supposedly in T2DM, the HbA1c will be increased by increasing BMI, because of the poorly controlled regime, but in T1DM, the increased BMI percentile may indicate better weight gain because of improved glycemic control, which leads to lower HbA1c.
In our study, the mean of phosphate was 4.74±0.78, which was higher than Vorum et al's (2.68±0.56) study, also the rate of hypophosphatemia was lower than in Vorum et al's study. This might have occurred as a result of different sampling, short duration, and relative good control of diabetes in Vorum et al's study.9
Since our study was performed on T1DM with a mean duration of less than 3 years (33.35 months) and commonly complications of T1DM occur after 3–5 years, therefore, the decreased level of Pi is rational.
It was also observed in the present study that there was no significant correlation between serum inorganic phosphate and HbA1c, although four patients had hypophosphatemia, most of them had uncontrolled diabetes and high HbA1c. In this study, there was no significant correlation between hypophosphatemia and HbA1c, which was inconsistent with Vorum et al9, and Fang et al's14 studies. However, our finding was in line with Galli-Tsinopoulou et al,15 who showed no correlation between Pi and HbA1c. In Vorum et al,9 at the HbA1c of 6–7.5, the maximum Pi level was seen (3.26±0.45) and at HbA1c>10.5, there was the minimum Pi level (2.06±0.15).
Small sample size, short follow-up period, and lack of biochemical and molecular tests are among the limitations of this study.
Conclusion
The finding showed that HbA1c had a reversed relationship with BMI but there was no correlation between phosphate and HbA1c. Therefore, prospective multi-center studies with more detailed biochemical and molecular tests to check phosphate intracellular metabolism, with larger sample and longer follow-up (at least 3−5 years) could be recommended. In addition, simultaneous blood glucose check can be valuable to find out the association with serum inorganic phosphate. As we find out, most studies are performed on adults and type 2 diabetes so we are optimistic that our study clarifies the path for further investigations.
Acknowledgments
This investigation was based on the thesis submitted by the second author (Amir Reza Nemati) to the Guilan University of Medical Sciences. This study was done with financial support provided by Vice Chancellor of Research, Guilan University of Medical Sciences.
Disclosure
The authors report no conflicts of interest in this work.
References
1. Atkinson MA, Eisenbarth GS, Michels AW. Type 1 diabetes. Lancet. 2014;383(9911):69–82. doi:10.1016/S0140-6736(13)60591-7
2. Goyal R, Jialal I. Diabetes Mellitus Type 2: StatPearls [Internet]. Treasure Island (FL): StatPearls Publishing; 2020.
3. Saudek CD, Derr RL, Kalyani RR. Assessing glycemia in diabetes using self-monitoring blood glucose and hemoglobin A1c. JAMA. 2006;295(14):1688–1697. doi:10.1001/jama.295.14.1688
4. Nathan DM, Turgeon H, Regan S. Relationship between glycated haemoglobin levels and mean glucose levels over time. Diabetologia. 2007;50(11):2239–2244. doi:10.1007/s00125-007-0803-0
5. Prabhakar PK. Pathophysiology of secondary complications of diabetes mellitus. Pathophysiology. 2016;9(1).
6. Ditzel J. The problems of tissue oxygenation in diabetes mellitus. III. The “three-in-one concept” for the development of diabetic microangiopathy and a rational approach to its prophylaxis. Acta Med Scand Suppl. 1975;578:69–83.
7. Ditzel J, Lervang H-H. Disturbance of inorganic phosphate metabolism in diabetes mellitus: clinical manifestations of phosphorus-depletion syndrome during recovery from diabetic ketoacidosis. Diabetes Metab Syndr Obes. 2010;3:319–324. doi:10.2147/DMSO.S13476
8. Amanzadeh J, Reilly RF. Hypophosphatemia: an evidence-based approach to its clinical consequences and management. Nat Clin Pract Nephrol. 2006;2(3):136–148. doi:10.1038/ncpneph0124
9. Vorum H, Ditzel J. Disturbance of inorganic phosphate metabolism in diabetes mellitus: its relevance to the pathogenesis of diabetic retinopathy. J Ophthalmol. 2014;2014:135287. doi:10.1155/2014/135287
10. Xu CL, Yan SK, Zu SY, et al. [Analysis of the levels of serum total calcium and inorganic phosphate of 2,342 children in Beijing]. Zhongguo Yi Xue Ke Xue Yuan Xue Bao. 2004;26(4):455–459.
11. Marwaha RK, Khadgawat R, Tandon N, et al. Reference intervals of serum calcium, ionized calcium, phosphate and alkaline phosphatase in healthy Indian school children and adolescents. Clin Biochem. 2010;43(15):1216–1219. doi:10.1016/j.clinbiochem.2010.07.014
12. Nansel TR, Lipsky LM, Iannotti RJ. Cross-sectional and longitudinal relationships of body mass index with glycemic control in children and adolescents with type 1 diabetes mellitus. Diabetes Res Clin Pract. 2013;100(1):126–132. doi:10.1016/j.diabres.2012.12.025
13. Babikr WG, Alshahrani ASA, Hamid HGM, Abdelraheem AHMK, Shalayel MHF. The correlation of HbA1c with body mass index and HDL-cholesterol in type 2 diabetic patients. Biomed Res. 2016;24(7):1280–1283.
14. Fang L, Li X. [Level of serum phosphorus and adult type 2 diabetes mellitus]. Zhong Nan Da Xue Xue Bao Yi Xue Ban. 2016;41(5):502–506. doi:10.11817/j.issn.1672-7347.2016.05.009
15. Galli-Tsinopoulou A, Maggana I, Kyrgios I, et al. Association between magnesium concentration and HbA1c in children and adolescents with type 1 diabetes mellitus. J Diabetes. 2014;6(4):369–377. doi:10.1111/1753-0407.12118
 © 2020 The Author(s). This work is published and licensed by Dove Medical Press Limited. The
full terms of this license are available at https://www.dovepress.com/terms
and incorporate the Creative Commons Attribution
- Non Commercial (unported, 3.0) License.
By accessing the work you hereby accept the Terms. Non-commercial uses of the work are permitted
without any further permission from Dove Medical Press Limited, provided the work is properly
attributed. For permission for commercial use of this work, please see paragraphs 4.2 and 5 of our Terms.
© 2020 The Author(s). This work is published and licensed by Dove Medical Press Limited. The
full terms of this license are available at https://www.dovepress.com/terms
and incorporate the Creative Commons Attribution
- Non Commercial (unported, 3.0) License.
By accessing the work you hereby accept the Terms. Non-commercial uses of the work are permitted
without any further permission from Dove Medical Press Limited, provided the work is properly
attributed. For permission for commercial use of this work, please see paragraphs 4.2 and 5 of our Terms.