Back to Journals » International Journal of Nanomedicine » Volume 20
Tetrahedral DNA Nanostructures as a Multifactorial Nanotherapeutic Platform for Deep Vein Thrombosis: Targeting Necroptosis, Oxidative Stress, and Inflammation
Authors Li Y, Cao W, Lv Y, Yang H, Xu L, Lu Y
Received 14 April 2025
Accepted for publication 21 October 2025
Published 18 November 2025 Volume 2025:20 Pages 13837—13855
DOI https://doi.org/10.2147/IJN.S534411
Checked for plagiarism Yes
Review by Single anonymous peer review
Peer reviewer comments 2
Editor who approved publication: Dr Sachin Mali
Yunyan Li,1,* Wenqi Cao,2,* Yixia Lv,3 Hanning Yang,1 Lirong Xu,1 Yongping Lu1
1Department of Ultrasonography, The Affiliated Hospital of Yunnan University, Kunming, Yunnan, People’s Republic of China; 2Graduate school, Kunming Medical University, Kunming, Yunnan, People’s Republic of China; 3Graduate School, Dali University, Dali, Yunnan, People’s Republic of China
*These authors contributed equally to this work
Correspondence: Yongping Lu, The Affiliated Hospital of Yunnan University, 176 Qingnian Road, Kunming, Yunnan, 650000, People’s Republic of China, Email [email protected]
Purpose: Venous thromboembolism (VTE), comprising deep vein thrombosis (DVT) and pulmonary embolism (PE), remains a major clinical challenge due to the limitations of conventional anticoagulant therapies. This study explores tetrahedral DNA nanostructures (TDNs) as a novel therapeutic strategy for DVT by targeting endothelial cell necroptosis and oxidative stress.
Methods: A mouse DVT model was established via inferior vena cava ligation. TDNs were synthesized from four complementary ssDNA strands and validated via gel electrophoresis and atomic force microscopy. Therapeutic effects were assessed through histopathology, Western blot, qPCR, RNA-seq, and oxidative stress markers (SOD/MDA). Mechanistic insights were explored via transcriptomics, co-immunoprecipitation, and bioinformatics.
Results: In a mouse DVT model, TDNs demonstrated remarkable efficacy in mitigating thrombosis, reducing endothelial damage, and restoring vascular homeostasis. Mechanistically, TDNs downregulated the phosphorylation of RIP3 and MLKL, suppressed necroptosis, and modulated inflammatory signaling, specifically via the interaction between PTPRC and CCR9. Transcriptomic analysis confirmed that TDNs ameliorated the dysregulated expression of immune-inflammatory mediators while promoting antioxidative effects by increasing SOD activity and decreasing MDA levels. Bioinformatics and protein interaction assays further unveiled a direct binding between RIP3 and PTPRC, highlighting their roles as molecular targets of TDNs.
Conclusion: These findings underscore TDNs’ potential as a safe and effective nanotherapeutic platform for managing DVT by simultaneously targeting necroptosis, oxidative stress, and inflammation. Future studies are warranted to optimize dosing strategies and evaluate their long-term safety and synergistic use with established anticoagulants.
Keywords: tetrahedral DNA nanostructures, deep vein thrombosis, DVT, necroptosis, oxidative stress, inflammation
Introduction
Venous thromboembolism (VTE), encompassing deep vein thrombosis (DVT) and pulmonary embolism (PE), is a highly prevalent and life-threatening disorder that poses a substantial burden on global public health.1 Current treatment strategies for VTE primarily rely on anticoagulant drugs such as heparin and warfarin, which act by inhibiting coagulation factor activity to prevent thrombogenesis. However, anticoagulant therapy has notable limitations, including an elevated risk of severe bleeding and its inability to effectively prevent post-thrombotic syndrome (PTS) and chronic thromboembolic pulmonary hypertension (CTEPH) following thrombus resolution.2,3 Moreover, anticoagulants are contraindicated in some patients, highlighting the urgent need to develop safer and more effective alternative therapeutic strategies.
In recent years, the critical role of vascular endothelial cells (VECs) in the pathogenesis of DVT has garnered significant attention.4 As specialized epithelial cells lining the vascular lumen, VECs maintain blood fluidity and vascular homeostasis through their anticoagulant and anti-inflammatory attributes.5 DVT initiation is tightly associated with disorders of inflammation and coagulation, where endothelial cells play a pivotal role in thrombo-inflammation.6 Thrombosis exacerbates endothelial cell injury, leading to a vicious cycle of endothelial dysfunction, inflammatory responses, and thrombogenesis.7 Furthermore, endothelial injury and vascular wall inflammation are key contributors to the development of PTS and CTEPH.8 Consequently, protecting VECs from injury has emerged as a crucial therapeutic target for managing DVT and designing novel antithrombotic drugs.
Evidence suggests that multiple forms of cell death, including necrosis, apoptosis, pyroptosis, necroptosis, and ferroptosis, participate in thrombus formation.9 Among these, necroptosis is a programmed cell death pathway mediated by receptor-interacting protein kinase 1 (RIP1), RIP3, and mixed lineage kinase domain-like pseudokinase (MLKL). The formation of the RIP1/RIP3/MLKL complex triggers MLKL phosphorylation, followed by its insertion into the plasma membrane to create pores, ultimately compromising membrane integrity and resulting in cell death.10 Although studies on the role of necroptosis in venous thrombosis are still in their infancy, mounting evidence suggests that the RIP1/RIP3/MLKL pathway plays a significant role in thrombogenesis.11 In our previous investigations, we demonstrated that necroptosis is intricately involved throughout the DVT formation process. RIP3 and MLKL expression are consistently upregulated in the vascular walls, and their activation is strongly correlated with endothelial injury. Importantly, genetic knockout or pharmacological inhibition of RIP3/MLKL phosphorylation significantly mitigates thrombus formation, reduces circulating inflammatory cytokine levels, and alleviates vascular wall damage.12 These findings underscore the therapeutic potential of targeting necroptosis as a novel strategy for managing thrombotic diseases.
In parallel, structured DNA nanotechnology, particularly tetrahedral DNA nanostructures (TDNs), has shown tremendous promise in biomedical applications, especially for disease diagnosis and therapy.13 TDNs, known for their excellent biocompatibility, programmability, and multifactorial effects, have been exploited in diverse fields such as cancer treatment, wound healing, and tissue regeneration.14 Notably, TDNs can function as drug delivery platforms to improve the stability and cellular uptake of small-molecule drugs (eg, doxorubicin and paclitaxel),15 and exhibit inherent therapeutic properties, including anti-inflammatory, antioxidant, and anti-apoptotic activities.
Recent studies highlight TDNs’ pivotal role in vascular repair and angiogenesis. For example, TDNs have been shown to promote endothelial cell proliferation and migration, enhance neovascularization in ischemic tissues, and accelerate wound healing by modulating growth factor signaling pathways (eg, VEGF and HIF-1α).16 These properties align with their observed efficacy in inflammatory diseases such as myocardial ischemia-reperfusion injury and osteoarthritis.17,18
Given that DVT pathogenesis involves endothelial dysfunction, inflammation, and impaired vascular homeostasis, TDNs’ dual capacity to mitigate oxidative stress while supporting vascular repair raises an intriguing question: Can TDNs attenuate DVT formation by concurrently inhibiting necroptosis, inflammatory damage, and promoting endothelial recovery? This warrants further investigation.
In this study, we aim to elucidate the therapeutic role and underlying mechanisms of TDNs in DVT, with a particular focus on their protective effects on vascular endothelial cells through the modulation of necroptosis pathways. By integrating molecular biology, transcriptomics, and nanotechnology, we intend to unveil the potential application of TDNs in DVT treatment, providing a theoretical framework and experimental evidence for the development of novel antithrombotic therapies.
Experimental Methods
Establishment of the Mouse Deep Vein Thrombosis (DVT) Model
Forty-five male C57BL/6 mice (8 weeks old) were acclimated for 3 days and then anesthetized by intraperitoneal injection of 1% pentobarbital sodium at a dosage of 0.1 mL/10g body weight. Except for the control group, all other mice underwent stenosis-induced inferior vena cava (IVC) thrombosis modeling with ligation of collateral vessels to establish the deep vein thrombosis (DVT) model.19,20 Previous studies have suggested that female mice exhibit lower venous thrombus stability than males, indicating a potentially higher risk of pulmonary embolism (PE). As this study did not directly assess the incidence of PE, male mice were selected; subsequent investigations will include female subjects.21 Thrombus formation in the IVC was monitored using a color Doppler ultrasound system (VINNO 6 LAB, Feiyinuo Co., Suzhou, China) equipped with an X10-23L linear array probe (frequency range: 10–23 MHz). To ensure reproducibility and minimize operator bias, all ultrasound examinations were performed by an experienced operator who was blinded to the experimental group assignments. Under stable anesthesia, the abdominal region was depilated and acoustically coupled with ultrasound gel. The IVC was first identified in B-mode in both transverse and longitudinal views, distinguished from the adjacent abdominal aorta by its thinner wall and lack of pulsatility. Blood flow direction and patency were confirmed using Color Doppler, with the velocity scale appropriately reduced to detect low venous flow (Supplementary Figure 1). Following thrombus induction (eg, by stenosis), serial scans were performed at designated time points. Thrombus progression was assessed in B-mode by measuring the size and echogenicity of intraluminal material and the degree of flow obstruction was evaluated using Color Doppler to visualize filling defects and PW Doppler to quantify changes in flow velocity. Images and cine loops were recorded for subsequent analysis. Imaging was performed at baseline (pre-modeling) and at 1, 3, 7, and 14 days post-modeling.
Starting on the second day post-modeling, mice in the DVT+TDN group received a daily tail vein injection of tetrahedral DNA nanostructures (TDNs, 400 μL, 2mg/kg),22,23 while the control and DVT groups were administered an equivalent volume of normal saline. Injections were conducted daily for 14 days. The progression of thrombosis was monitored regularly using ultrasound imaging. At the end of the experiment, euthanasia was performed via carbon dioxide asphyxiation with a chamber displacement rate of 30–70%. The IVC tissue was then collected from the segment between the left renal vein bifurcation and the iliac vein bifurcation. All animal procedures were conducted in accordance with the 3R principles (Replacement, Reduction, and Refinement) and approved by the Animal Ethics Committee of Yunnan University (Approval No: YNU20210106).
Cell Treatment
ECV304 cells were cultured under standard conditions (37°C, 5% CO2). For oxygen-glucose deprivation (OGD) treatment, cells at 60% confluence were switched to glucose-free medium and placed in a hypoxic incubator (95% N2, 5% CO2) for 12 hours. Proteins were extracted immediately after OGD exposure for subsequent analysis.
Synthesis and Validation of Tetrahedral DNA Nanostructures (TDNs)
The pre-designed single-stranded DNA (ssDNA) sequences were obtained and stored at −20°C. TDNs were synthesized as reported previously.13
Synthesis: Equal molar concentrations of ssDNA strands (S1, S2, S3, and S4) dissolved in TM buffer were mixed thoroughly, heated to 95°C for 10 minutes, and then quickly cooled to 4°C for 20 minutes to form and stabilize the TDN tetrahedral structure.
Validation: a) Gel electrophoresis: An 8% polyacrylamide gel was prepared, and 5 μL of ssDNA was mixed with 1 μL of 6× loading buffer. Samples (ssDNA and DNA ladders) were loaded, and electrophoresis was performed in 1× TAE buffer at 80 V for 60 minutes. The gel was stained with a nucleic acid dye for 30 minutes, and band patterns were analyzed. b) Atomic force microscopy (AFM): TDN was diluted to 1000 nM, and 10 μL of the solution was deposited onto a mica substrate. To immobilize the DNA structure, 1.5 μL of 100 mM NiCl2 solution was added and allowed to stand for 15 minutes. Subsequently, 1 drop of TM buffer was added, and TDN morphology was observed using AFM in tapping mode.
Stability: TDNs dissolved in PBS were incubated at 37°C for 12, 24, and 48 hours, with 10% FBS added to simulate physiological fluid stability. The results showed that the structures remained intact within 24 hours with no significant degradation observed (Supplementary Figure 2).
Toxicity studies: To assess the potential systemic toxicity of tetrahedral DNA nanostructures (TDNs), mice were administered a high dose of 2 mg/kg via tail vein injection, based on established safe and effective dosage protocols from previous in vivo studies. After 14 days of treatment, major organs (heart, spleen, and liver) were collected, fixed in 4% paraformaldehyde, and processed for histological analysis. Tissue sections (5 μm) were stained with hematoxylin and eosin (H&E) following standard procedures (Supplementary Figure 3).
Cell Adhesion Assay: Vascular endothelial cells were labeled with Calcein-AM and subjected to oxygen-glucose deprivation/reperfusion (OGD) for 12 hours. After OGD/R treatment, the endothelial cells were co-cultured with Dil-labeled THP-1 macrophages to evaluate macrophage adhesion. In some experimental groups, TDNs were administered following OGD to assess their effect on macrophage adhesion (Supplementary Figure 4).
Hematoxylin and Eosin (H&E) Staining
Deep vein tissues were fixed in 4% paraformaldehyde overnight, dehydrated through an ethanol gradient, cleared with xylene, and embedded in paraffin. Serial sections (5 μm thick) were prepared, stained with hematoxylin and eosin, mounted with neutral gum, and visualized under a light microscope.
TUNEL Staining
Paraffin-embedded tissue sections were deparaffinized with xylene, rehydrated through an ethanol gradient, and treated with proteinase K at 37°C for 25 minutes. After washing with PBS, membrane permeabilization was performed. TUNEL reaction mix (Beyotime, C1098) was applied and incubated at 37°C for 1 hour, followed by DAB development and hematoxylin counterstaining. The sections were mounted with neutral gum and observed under a microscope.
Immunohistochemistry (IHC) Staining
Deep vein tissues were fixed in 4% paraformaldehyde, dehydrated, and embedded in paraffin. After sectioning (5 μm), slides were incubated with primary antibodies against MLKL (Bioss, 1:50) and RIP3 (Affinity, 1:50), followed by HRP-conjugated secondary antibody. DAB chromogenic substrate was applied, and hematoxylin was used for counterstaining. The slides were mounted with neutral gum and observed under a microscope.
RT-PCR
Total RNA was extracted using TRIzol reagent, and its concentration and purity were determined with a NanoDrop ND-1000 spectrophotometer. cDNA synthesis was performed using the SureScript First-Strand cDNA Synthesis Kit. Quantitative PCR (qPCR) was conducted using 5× BlazeTaq qPCR Mix under the following conditions: 95°C for 1 minute, followed by 40 cycles of 95°C for 20 seconds, 55°C for 20 seconds, and 72°C for 30 seconds. Gene expression levels were calculated using the 2−ΔΔCt method.
Western Blotting
Proteins were extracted from deep vein tissues using RIPA lysis buffer containing protease inhibitors, and protein concentrations were determined using the BCA method. Proteins were separated using 10% SDS-PAGE and transferred onto membranes. After blocking with 5% BSA, the membranes were incubated with primary antibodies against p-MLKL (Affinity, 1:1000), p-RIP3 (Affinity, 1:1000), β-actin (Proteintech, 1:25,000), CCR9 (Affinity, 1:1000), and PTPRC (Abcam, 1:2000). HRP-conjugated secondary antibodies were applied, and protein bands were visualized using ECL reagents. Band intensities were quantified with ImageJ software.
ELISA
Serum levels of malondialdehyde (MDA) and superoxide dismutase (SOD) were measured using commercial ELISA kits according to the manufacturer’s protocols. Absorbance was recorded at 450 nm.
Flow Cytometry for Cell Apoptosis
ECV304 cells were harvested, washed with pre-cooled PBS, and stained with Annexin V-FITC/PI. Apoptosis was analyzed using a BD FACSCalibur flow cytometer and FlowJo software.
RNA Sequencing (RNA-Seq)
Total RNA was extracted from the IVC tissues of the control (A), DVT (B), and DVT+TDN (C) groups. RNA-seq libraries were constructed and sequenced. Differentially expressed genes (DEGs) and pathway enrichment were analyzed using KOBAS.
Immunofluorescence Staining
Cells were fixed in 4% paraformaldehyde, permeabilized, and blocked before incubation with primary antibodies targeting PTPRC (Bioss, 1:100) and RIP3 (Affinity, 1:100). Alexa Fluor-conjugated secondary antibodies were used for visualization, with nuclei counterstained using DAPI. Slides were mounted with antifade reagent and visualized under a fluorescence microscope. Fluorescence intensity was quantified using Image-Pro Plus software.
Co-Immunoprecipitation (Co-IP)
Cell lysates were incubated overnight with RIP3 antibody or IgG as a control at 4°C. Magnetic beads were used to pull down protein complexes, which were analyzed via SDS-PAGE and Western blotting for PTPRC and RIP3 expression.
RNA Extraction and Library Construction
Total RNA was isolated and purified using TRIzol reagent (Invitrogen, Carlsbad, CA, USA) following the manufacturer’s procedure. The RNA amount and purity of each sample was quantified using NanoDrop ND-1000 (NanoDrop, Wilmington, DE, USA). The RNA integrity was assessed by Bioanalyzer 2100 (Agilent, CA, USA) with RIN number >7.0, and confirmed by electrophoresis with denaturing agarose gel. Poly (A) RNA is purified from 1μg total RNA using Dynabeads Oligo (dT)25–61005 (Thermo Fisher, CA, USA) using two rounds of purification. Then the poly(A) RNA was fragmented into small pieces using Magnesium RNA Fragmentation Module (NEB, cat.e6150, USA) under 94°C 5–7min. Then the cleaved RNA fragments were reverse-transcribed to create the cDNA by SuperScript™ II Reverse Transcriptase (Invitrogen, cat. 1896649, USA), which were next used to synthesise U-labeled second-stranded DNAs with E. coli DNA polymerase I (NEB, cat.m0209, USA), RNase H (NEB, cat.m0297, USA) and dUTP Solution (Thermo Fisher, cat.R0133, USA). An A-base is then added to the blunt ends of each strand, preparing them for ligation to the indexed adapters. Each adapter contains a T-base overhang for ligating the adapter to the A-tailed fragmented DNA. Single- or dual-index adapters are ligated to the fragments, and size selection was performed with AMPureXP beads. After the heat-labile UDG enzyme (NEB, cat.m0280, USA) treatment of the U-labeled second-stranded DNAs, the ligated products are amplified with PCR by the following conditions: initial denaturation at 95°C for 3 min; 8 cycles of denaturation at 98°C for 15 sec, annealing at 60°C for 15 sec, and extension at 72°C for 30 sec; and then final extension at 72°C for 5 min. The average insert size for the final cDNA library was 300±50 bp. At last, we performed the 2×150bp paired-end sequencing (PE150) on an illumina Novaseq™ 6000 (LC-Bio Technology CO., Ltd., Hangzhou, China) following the vendor’s recommended protocol.
Bioinformatics Analysis of RNA-Seq
Fastp software (https://github.com/OpenGene/fastp) were used to remove the reads that contained adaptor contamination, low quality bases and undetermined bases with default parameter. Then sequence quality was also verified using fastp. We used HISAT2 (https://ccb.jhu.edu/software/hisat 2) to map reads to the reference genome of Homo sapiens GRCh38. The mapped reads of each sample were assembled using StringTie (https://ccb.jhu.edu/software/stringtie) with default parameters. Then, all transcriptomes from all samples were merged to reconstruct a comprehensive transcriptome using gffcompare (https://github.com/gpertea/gffcompare/). After the final transcriptome was generated, StringTie and was used to estimate the expression levels of all transcripts. StringTie was used to perform expression level for mRNAs by calculating FPKM (FPKM = [total_exon_fragments / mapped_reads(millions) × exon_length(kB)]). The differentially expressed mRNAs were selected with fold change > 2 or fold change < 0.5 and with parametric F-test comparing nested linear models (p- value < 0.05) by R package edgeR (https://bioconductor.org/packages/release/bioc/html/edgeR.html).
Statistical Analysis
All statistical analyses were performed using GraphPad Prism software. Data are presented as mean ± SEM. Group comparisons were conducted using t-tests or one-way ANOVA. A p-value <0.05 was considered statistically significant.
Results and Discussions
Characterization and Cellular Uptake of TDNs
The tetrahedral DNA nanostructures (TDNs) were assembled from four complementary single-stranded DNA sequences to form a well-defined tetrahedral configuration (Figure 1A and Table 1). Agarose gel electrophoresis of the DNA single strands confirmed the successful synthesis of TDNs, with an approximate molecular weight of 200 bp (Figure 1B). Atomic force microscopy (AFM) further analyzed the spatial structure and particle size of the DNA tetrahedrons, revealing a uniform distribution with a diameter of approximately 20 nm (Figure 1C–G). These results indicate the successful synthesis of TDNs with stable nanostructures. Moreover, the cellular uptake of TDNs was visualized using confocal microscopy, demonstrating the uptake of Cy5-labeled TDNs (Figure 1H). In the first 6 hours, the Cy5-labeled TDNs quickly penetrated the hypoxic-injured endothelial cells, predominantly localizing in the cytoplasm and on the cell membrane. These findings suggest that TDNs can traverse the cell membrane, enter the cytoplasm, and influence cellular biological activities; they are eventually transported to lysosomes and completely digested, indicating their biosafety.17,24
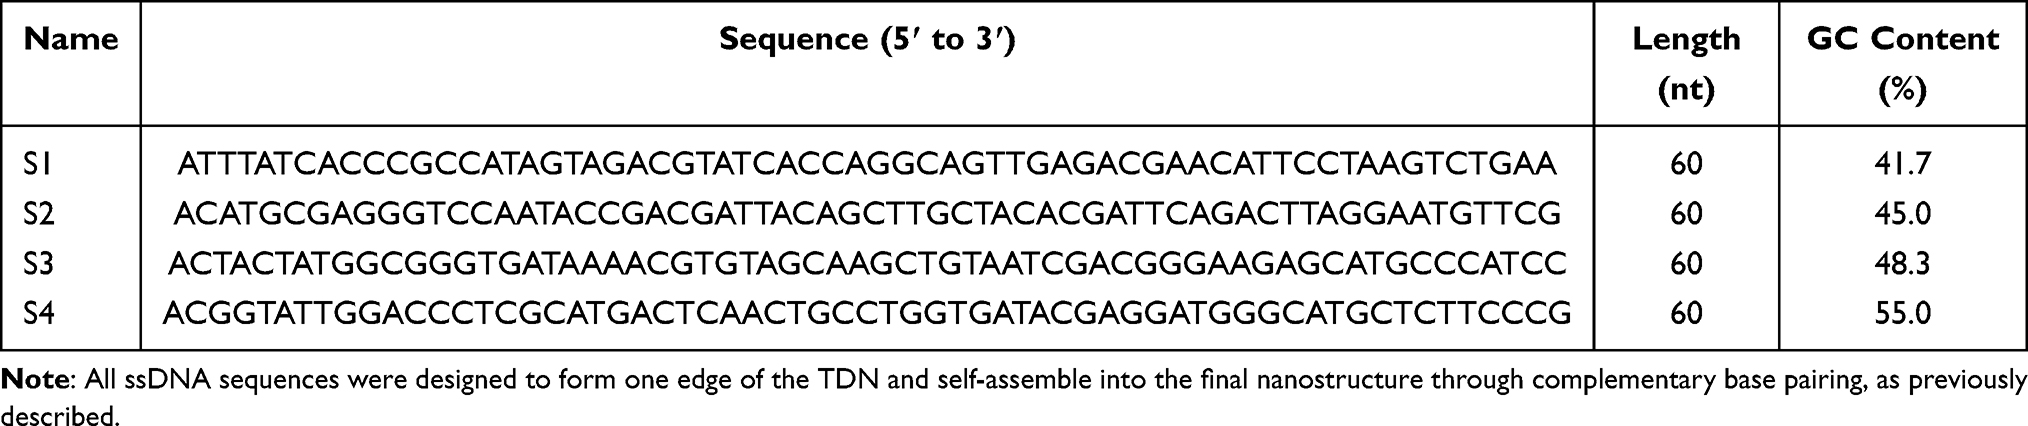 |
Table 1 Sequences and Characteristics of the Single-Stranded DNA (ssDNA) Components Used for the Synthesis of Tetrahedral DNA Nanostructures (TDNs) |
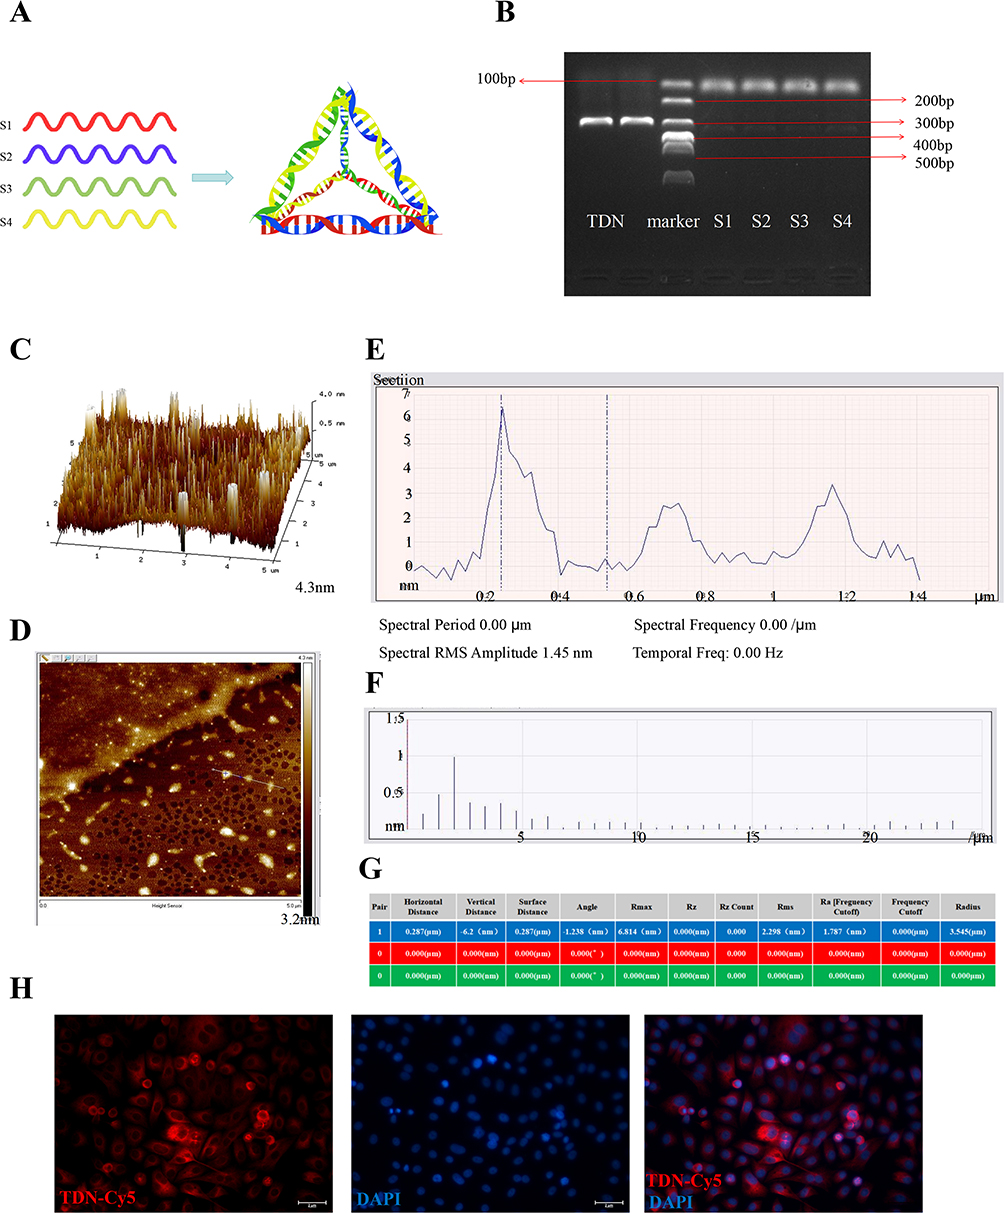 |
Figure 1 Synthesis and characterization of TDN. (A) Schematic diagram of the annealing and assembly of four ssDNA strands to form a tetrahedral DNA nanostructure (TDN). (B) Agarose gel electrophoresis analysis of the annealed TDN product and individual ssDNA strands, showing the efficiency and purity of TDN synthesis. (C) AFM two-dimensional height image of TDNs. (D) AFM two-dimensional planar image illustrating the surface morphology and nanoscale thickness of TDNs. (E) Representative AFM cross-sectional analysis: vertical axis represents height (nm), horizontal axis indicates width (μm). (F and G) Quantitative analysis of TDNs based on AFM measurements: (F) particle size distribution and (G) surface roughness parameters. (H) Cellular uptake of Cy5-labeled TDNs (red) by hypoxia-injured vascular endothelial cells. Nuclei are stained blue. Scale bar: 2 μm. |
TDNs were dissolved in PBS and incubated at 37 °C for 12, 24, and 48 hours, followed by the addition of 10% FBS to simulate stability in a physiological fluid environment. The results indicated that the structure of TDNs remained intact with no significant degradation within 24 hours, suggesting their relative stability under in vivo-like conditions (see Supplementary Figure 2). For in vitro experiments, we performed a macrophage adhesion assay, and the results supported the proposed mechanism of TDNs in immunothrombotic regulation. Regarding biosafety, we conducted additional high-dose toxicity studies. Specifically, mice were administered a concentration of TDNs (2 mg/kg) via tail vein injection. Histopathological examination (H&E staining) of the heart, spleen, and liver showed no significant differences compared with the normal control group, indicating that TDNs did not induce obvious toxic effects in highly vascularized organs at this dosage (see Supplementary Figure 3).
Although a systematic pharmacokinetic (PK) study was not conducted in this work, the dosage of TDNs used was based on previously reported safe ranges. The absence of overt toxicity in experimental animals further supports the good biocompatibility of TDNs at the administered dose. Moreover, we observed dose-dependent trends in thrombus length, inflammatory response, and apoptosis following TDN treatment, which partially validates the rationality of the selected dosage. Future studies will include comprehensive PK evaluations to systematically assess the in vivo distribution, metabolic kinetics, and tissue accumulation properties of TDNs.
TDNs Ameliorate Deep Vein Thrombosis by Inhibiting RIP3 and MLKL Phosphorylation, Reducing Oxidative Stress, and Suppressing Inflammation
To elucidate the mechanism by which TDNs alleviate deep vein thrombosis (DVT), we evaluated the influence of TDNs on reducing RIP3 and MLKL phosphorylation, inhibiting necroptosis, protecting endothelial cells, mitigating oxidative stress, and curbing inflammation. A DVT model was established in C57BL/6 mice, followed by intravenous administration of TDNs, as outlined in the experimental protocol (Figure 2A). Thrombosis was assessed through macroscopic examination (including thrombus length and inferior vena cava [IVC] swelling) and Color Doppler ultrasound imaging, histological examination of IVC tissues via hematoxylin and eosin (H&E) staining. Phosphorylation levels of RIP3 and MLKL in the IVC were quantified using Western blot (WB) and immunohistochemistry (IHC), while endothelial cell apoptosis in IVC tissues was assessed through TUNEL staining. Additionally, serum oxidative stress markers, including superoxide dismutase (SOD) activity and malondialdehyde (MDA) levels, were measured by enzyme-linked immunosorbent assay (ELISA).
 |
Figure 2 Model establishment and specimen collection. (A) Schematic of the experimental workflow. (B) Color Doppler ultrasound analysis of deep vein thrombosis (DVT). Compared with the DVT group, TDN treatment for 14 days significantly reduced thrombus burden in the inferior vena cava, accompanied by partial recanalization of blood flow. (C) Quantitative analysis of thrombus area in the inferior vena cava by ultrasound. The DVT+TDN group exhibited a significant reduction in thrombus formation area compared to the DVT group (**p < 0.01). (D) Macroscopic views of thrombus specimens from each treatment group. (E) (F) Quantitative comparisons indicated that TDNs significantly decreased thrombus length (***p < 0.001) as well as the ratio of thrombus weight (including thrombus and venous tissues) to length (**p < 0.01). |
Color Doppler ultrasound showed that 14-day TDN treatment markedly suppressed thrombus formation and partially restored blood flow in the IVC compared with the DVT group (Figure 2B). The thrombus area ratio was also significantly reduced after TDN administration (p < 0.01, Figure 2C). Macroscopic evaluation of thrombus specimens further confirmed that TDNs noticeably alleviated IVC swelling and reduced thrombus size (Figure 2D). Quantitative comparisons indicated that TDNs significantly decreased thrombus length (p < 0.001, Figure 2E) as well as the ratio of thrombus weight (including thrombus and venous tissues) to length (p < 0.01, Figure 2F).
Histopathological examination with H&E staining further highlighted substantial inflammatory infiltration, endothelial damage, and roughened luminal surfaces in the DVT group, which were significantly ameliorated following TDN treatment (Figure 3D). These findings suggest that TDNs ameliorate DVT-related pathological changes by alleviating abnormal thrombosis and reducing endothelial damage and inflammation.
 |
Figure 3 TDN mitigates DVT in mice by inhibiting RIP3 and MLKL phosphorylation. (A) Western blot (WB) analysis of p-MLKL and p-RIP3 protein levels with β-actin used as a loading control, and corresponding statistical analysis. (B) Serum levels of malondialdehyde (MDA) measured by ELISA. (C) Serum superoxide dismutase (SOD) activity measured by ELISA. (D) Histological assessment of pathological changes in IVC tissues by hematoxylin-eosin (H&E) staining (magnification: 200×). (E) TUNEL staining for detection of endothelial cell apoptosis and corresponding quantitative analysis. (F) Immunohistochemistry (IHC) of p-MLKL in IVC tissues with corresponding statistical analysis. (G) IHC of p-RIP3 in IVC tissues with corresponding statistical analysis. Statistical annotation: ns, p > 0.05, *p < 0.05, **p < 0.01, ***p < 0.001, ****p< 0.0001. |
Quantitative analysis of necroptosis-related markers via WB and IHC demonstrated significantly elevated phosphorylation levels of RIP3 and MLKL (p-RIP3 and p-MLKL, respectively) in the DVT model (p < 0.01, Figure 3A and F–G), alongside a notable increase in endothelial cell apoptosis as detected by TUNEL staining (p < 0.01, Figure 3E). These results indicate that upregulation of the RIPK3-MLKL pathway drives necroptosis, exacerbating endothelial injury during DVT progression. In contrast, TDN treatment significantly reduced p-RIP3 and p-MLKL expression and endothelial cell apoptosis compared to the untreated DVT group (p < 0.05, Figure 3A and 3E–G). These data suggest that TDNs protect endothelial cells from necroptosis by inhibiting the RIPK3-MLKL pathway, thereby mitigating DVT progression.
To explore the role of oxidative stress in DVT pathology and TDN-mediated modulation, serum oxidative stress markers were analyzed. In the DVT group, SOD activity was significantly reduced (Figure 3B), while MDA levels were significantly elevated (Figure 3C), indicative of excessive free radical production and oxidative damage during thrombogenesis (p < 0.01). TDN treatment notably enhanced SOD activity (p < 0.01; Figure 3B) and significantly reduced MDA levels (p < 0.01, Figure 3C), indicating that TDN alleviates oxidative stress and restores redox homeostasis in DVT, thereby mitigating inflammation and endothelial injury.
In summary, these findings highlight that TDNs significantly reduce phosphorylation levels of RIP3 and MLKL, alleviating necroptosis in the endothelial context during DVT. This aligns with previous studies that underscore the role of the RIPK3-MLKL pathway in thrombogenesis.11,25 Necroptosis and oxidative stress are closely intertwined, with elevated ROS levels playing dual roles in enhancing necroptosis and amplifying inflammation-associated tissue damage.26 Excessive ROS production induces lipid peroxidation, mitochondrial dysfunction, and activation of downstream signaling pathways, further amplifying necroptosis. Once initiated, necroptosis releases damage-associated molecular patterns (DAMPs) and pro-inflammatory cytokines from ruptured cell membranes, increasing local ROS burden and creating a vicious cycle between necroptosis and oxidative stress. As a novel nanomaterial with biomimetic properties and structural stability, TDNs have been shown to regulate oxidative stress.27 By interacting with cellular signaling pathways, TDNs alleviate excessive ROS generation and restore redox balance. In our study, TDN treatment significantly enhanced SOD activity and reduced MDA accumulation, suggesting improved systemic antioxidant capacity.
From a clinical perspective, oxidative stress is not only a pathological hallmark of DVT but also a potential therapeutic target. The dual role of TDNs in enhancing SOD activity and inhibiting MDA production indicates a robust anti-oxidative and cytoprotective effect, potentially offering greater advantages over conventional therapies targeting inflammation or coagulation alone. Crucially, by stabilizing the redox environment of the endothelium, TDNs reduce the pro-thrombotic risk of endothelial dysfunction and vascular injury—key factors in DVT pathogenesis.
In conclusion, the trends in SOD and MDA levels before and after TDN treatment in the DVT model provide significant insights into the pathophysiological roles of oxidative stress and its regulation. Our results underscore the potential of TDNs as therapeutic nanomaterials capable of modulating oxidative stress and necroptosis, applicable to thrombotic and inflammatory diseases. Further research is required to elucidate the detailed molecular mechanisms and explore potential applications in other oxidative stress and inflammation-driven cell death diseases.
Transcriptomic Analysis Reveals the Mechanism by Which TDNs Improve DVT
Transcriptomic Analysis Results
Transcriptomic analysis is a widely used tool for exploring disease mechanisms and therapeutic targets. In the present study, transcriptomic profiling was performed on inferior vena cava (IVC) tissues from three experimental groups: the control group (A), the deep vein thrombosis (DVT) group (B), and the DVT+TDN treatment group (C). The results revealed significant differences in gene expression profiles among the groups. Specifically, 4250 differentially expressed genes (DEGs) were identified between group B and group A, with 2119 genes significantly upregulated and 2131 genes significantly downregulated, showing a symmetric distribution (Figure 4A). In contrast, only 203 DEGs were detected between group C and group B, including 25 upregulated genes and 178 downregulated genes, indicating a potent alleviating effect of TDN treatment on DVT. A comparison between group C and group A identified 3825 DEGs, suggesting that TDN treatment partially restored gene expression to baseline levels.
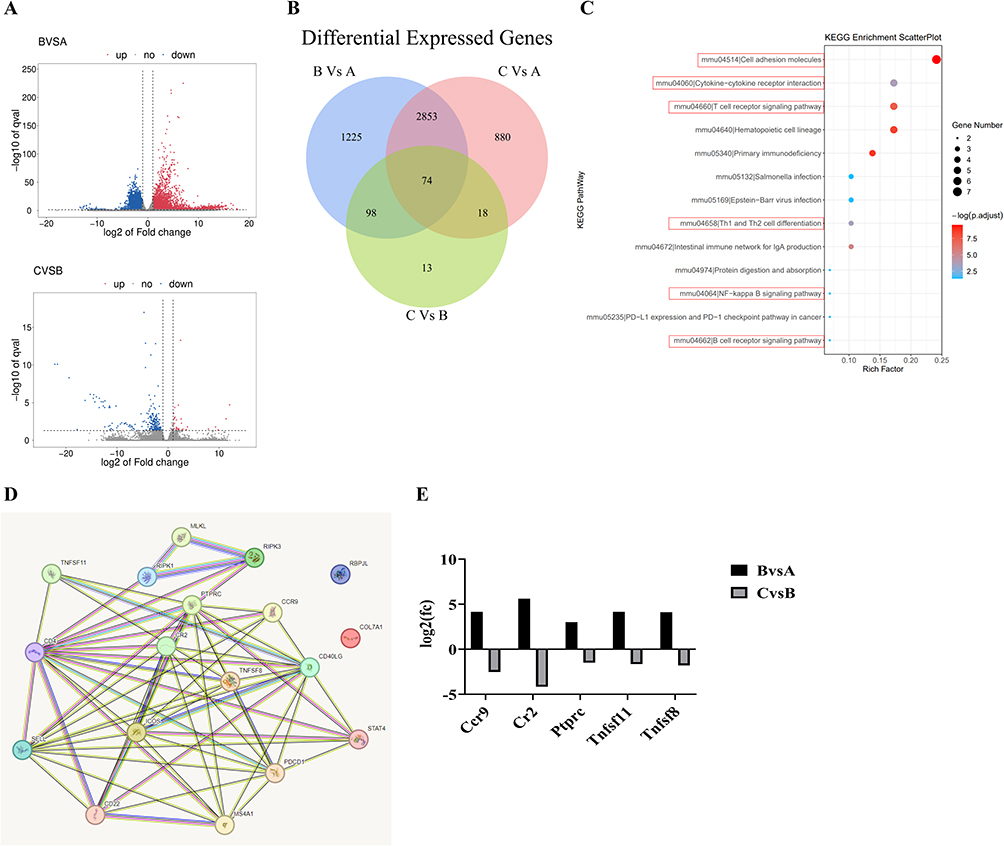 |
Figure 4 Transcriptomic analysis reveals TDN’s mechanism in improving DVT. (A) Volcano plot of differentially expressed genes (DEGs). Red dots represent upregulated genes, blue dots represent downregulated genes, and gray dots indicate non-significantly expressed genes. The x-axis indicates the fold change in gene expression between groups, while the y-axis represents the statistical significance of gene expression differences. (B) Venn diagram of DEGs. (C) Key signaling pathways from KEGG enrichment analysis. (D) Protein-protein interaction (PPI) network of candidate pathway-associated genes. (E) Differential expression of hub genes from the PPI network. The log2-transformed fold change values for the five candidate hub genes (Ccr9, Cr2, Ptprc, Tnfsf11, Tnfsf8) are presented. |
A Venn diagram analysis of the intersecting DEGs across the groups identified 74 potential key genes (Figure 4B), which could be central mediators of TDN’s therapeutic effects. Further Kyoto Encyclopedia of Genes and Genomes (KEGG) enrichment analysis using the KOBAS tool revealed that these genes were associated with 79 pathways, of which 13 showed significant enrichment (p < 0.05). Among these, six crucial pathways were directly related to inflammation and immune responses: cell adhesion molecules, cytokine-cytokine receptor interaction, T cell receptor signaling pathway, differentiation of Th1 and Th2 cells, NF-kappa B signaling pathway, and B cell receptor signaling pathway (Figure 4C). These pathways suggest that the progression of DVT and its improvement through TDN intervention are closely linked to the immune-inflammatory axis.
Further analysis identified 15 core genes associated with these pathways, including PTPRC, Cd4, CD22, SELL, Pdcd1, Icos, Cd40lg, TNFSF11, TNFSF8, CCR9, Rbpjl, Stat4, CR2, Ms4a1, and Col7a1. By integrating these genes with necroptotic pathway molecules (MLKL, RIPK3, and RIPK1), a protein-protein interaction (PPI) network was constructed using the STRING database (Figure 4D).28 Five key genes (Ccr9, CR2, PTPRC, TNFSF11 and TNFSF8) exhibited significant differences in expression between group B and group C (as well as between group C and group A) (Figure 4E). These genes were markedly upregulated in the DVT group compared to the control group but significantly downregulated following TDN treatment, suggesting that the reversal of inflammatory and pro-thrombotic gene expression may play a crucial role in TDN’s therapeutic mechanism.
Extensive research has established that immune and inflammatory processes are key contributors to thrombogenesis. Immune responses exacerbate thrombus formation through leukocyte adhesion, platelet activation, and the release of inflammatory cytokines, which accelerate vascular occlusion and endothelial dysfunction.29 In this study, the observed intersection between necroptosis and inflammatory pathways following TDN treatment suggests that TDN exerts its therapeutic effects by simultaneously suppressing necroptosis and dampening excessive immune activation.
TDNs Suppress Necroptosis and Regulate PTPRC and CCR9 to Improve DVT in Mice
Transcriptomic analysis revealed potential links between necroptosis and key immune regulatory molecules, prompting further validation of core gene expression through qPCR and Western blot experiments. Specifically, the expression levels of RIP3, MLKL, and five additional genes (PTPRC, CCR9, TNFSF8, TNFSF11, and CR2) were assessed across the experimental groups. qPCR results (Figure 5A) showed that all seven genes were significantly upregulated in the IVC tissues of the DVT group compared to the control group. Among them, RIP3, MLKL, PTPRC, CCR9, and TNFSF8 exhibited statistically significant increases (p < 0.05), while changes in TNFSF11 and CR2 were not significant (p > 0.05). Following TDN treatment, the expression of these genes was reduced, with RIP3, MLKL, PTPRC, and CCR9 showing significant downregulation (p < 0.01). These findings suggest that TDNs mitigate DVT primarily by inhibiting RIP3/MLKL-mediated necroptosis and modulating immune-regulatory factors such as PTPRC and CCR9.
 |
Figure 5 TDN ameliorates mouse DVT by blocking interactions between MLKL, PTPRC, and CCR9. (A) qPCR analysis of the expression levels of MLKL, PTPRC, CCR9, RIP3, TNFSF11, TNFSF8, and CR2 with GAPDH as the internal control. (B) WB analysis of PTPRC and CCR9 protein levels with β-actin as the loading control and corresponding statistical analysis. Statistical annotation: ns, p > 0.05, * p < 0.05, ** p < 0.01, *** p < 0.001, **** p < 0.0001. |
Western blot analysis further corroborated the central role of PTPRC and CCR9 in TDN’s protective effects. PTPRC, a critical regulator of T cell activation and immune signaling, is essential for maintaining normal immune function.30 In this study, PTPRC was significantly overexpressed in the DVT group, consistent with pro-thrombotic immune dysregulation.31 CCR9, a chemokine receptor associated with various inflammatory diseases, has been implicated in cardiovascular conditions, inflammatory bowel disease, and rheumatoid arthritis.32 Here, PTPRC and CCR9 were highly expressed in DVT tissues compared to the control group. Upon TDN treatment, the protein levels of PTPRC and CCR9 were significantly reduced (Figure 5B), highlighting their roles as critical regulators of the immune-thrombosis cascade and as key targets of TDN.
Recent studies have demonstrated that the interplay between necroptosis and the immune system plays a pivotal role in thrombotic pathogenesis—endothelial cell death is a trigger for leukocyte and platelet activation.33 In this study, the concurrent downregulation of RIP3, MLKL, PTPRC, and CCR9 following TDN therapy underscores the interconnected roles of necroptosis and immune inflammation in DVT progression. However, whether direct physical or functional interactions exist between PTPRC/CCR9 and necroptotic proteins remains to be elucidated.
Future research should explore the molecular interplay among these factors to thoroughly define TDN’s therapeutic mechanisms. Additionally, TDN’s anti-inflammatory effects via the suppression of excessive immune activation align with growing evidence supporting immune modulation as an effective strategy for treating thrombotic diseases.34
In the present study, although TDN treatment significantly downregulated the expression of key regulators such as RIP3, MLKL, PTPRC, and CCR9, the change in TNFSF8 expression did not reach statistical significance. This discrepancy may be attributed to the pathway specificity of TDNs, which appear to primarily target necroptosis and core immune cell migration pathways rather than the TNFSF8-mediated signaling axis. The biological role of TNFSF8 is highly context-dependent and may exhibit functional redundancy with other TNF superfamily members,35,36 potentially diminishing its central influence in DVT pathogenesis within this experimental setting. Furthermore, technical variations such as its potentially low basal expression level or temporal dynamics not captured at the time of assay may also contribute to the lack of significant results.37 Nonetheless, these findings refine our understanding of TDN’s mechanism, underscoring its selective action on necroptosis and specific immuno-thrombotic pathways without broad suppression of all immune ligands. Future studies should clarify the spatial-temporal role of TNFSF8 in DVT and its potential crosstalk with necroptotic signaling.
Mechanistic Study of TDN on Mitigating Cell Damage by Reducing Necroptosis
TDN Reduces Necroptosis by Decreasing the Expression of PTPRC, CCR9, P-RIP3, and P-MLKL
Cellular injury and necroptosis play pivotal roles in the pathogenesis and progression of deep vein thrombosis (DVT) and oxidative stress-related diseases. To further discern the protective mechanism of TDN (Therapeutic DNA Nanostructures), this study utilized an oxygen-glucose deprivation (OGD) model to simulate hypoxic cellular injury and evaluate the protective effect of TDN (Figure 6A). Results demonstrated that, under OGD conditions, the expression of necroptosis- and inflammation-related proteins—CCR9 and PTPRC—exhibited a time-dependent increase, accompanied by a significant rise in cell apoptosis. Furthermore, the key proteins of the necroptotic pathway, P-RIP3 and P-MLKL, showed a marked elevation after 12 hours of OGD treatment (p < 0.01) (Figure 6B and D). These findings suggest that OGD-induced cell injury is mediated through the activation of CCR9, PTPRC and necroptotic pathways.
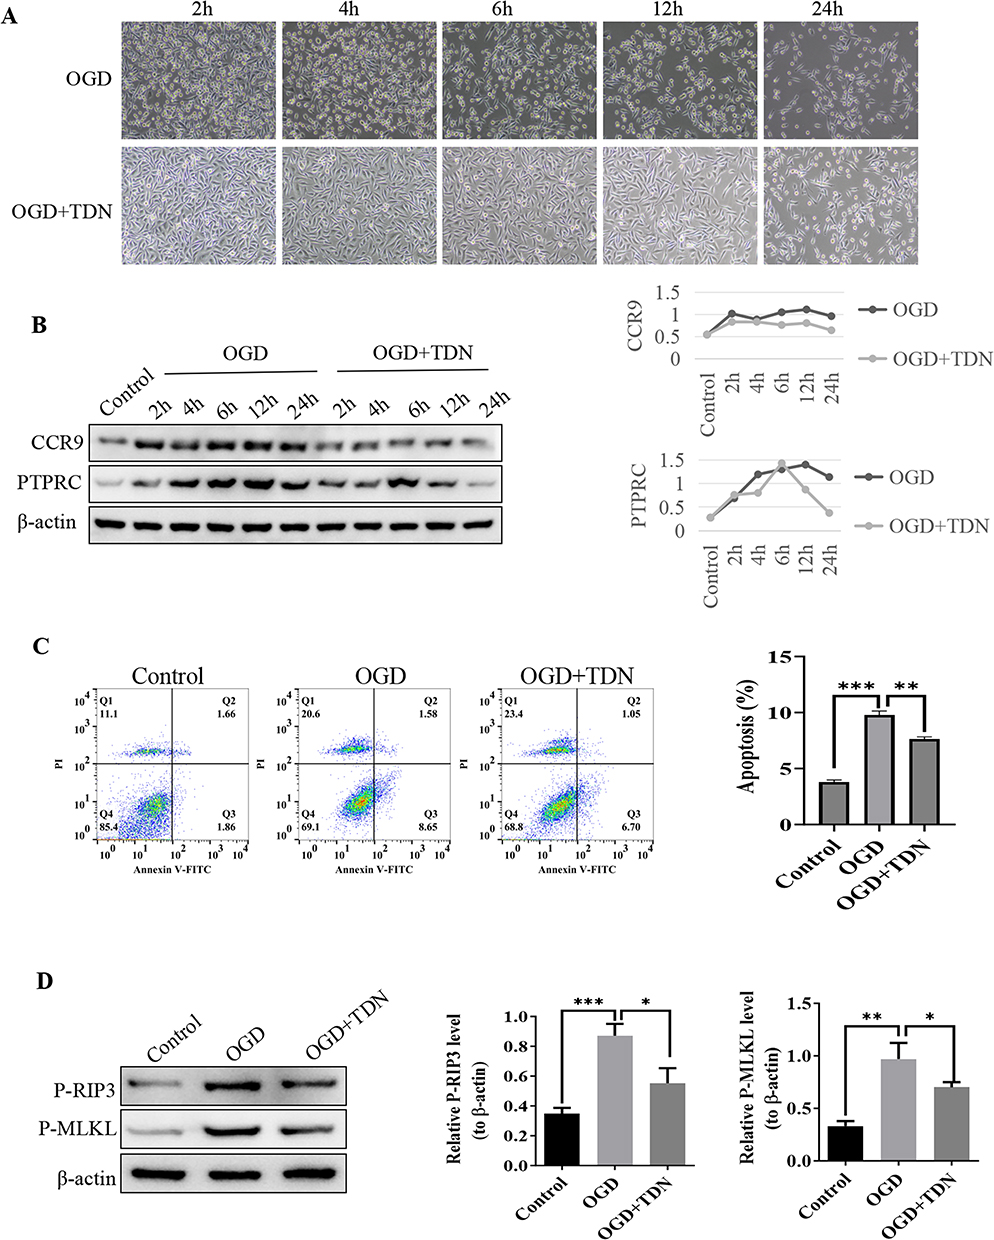 |
Figure 6 Cellular recovery experiments demonstrate that TDN reduces CCR9, PTPRC, p-RIP3, and p-MLKL expression, alleviating cell damage and apoptosis. (A) Images illustrating cell damage at different time points. (B) WB analysis of CCR9 and PTPRC protein expression levels at different time points with β-actin as the internal control. (C) Flow cytometry analysis of cell apoptosis. (D) WB analysis of p-RIP3 and p-MLKL protein expression levels at 12 h with β-actin as the internal control. Statistical annotation: * p < 0.05, ** p < 0.01, *** p < 0.001. |
However, the addition of TDN significantly downregulated the expression of CCR9 and PTPRC (p < 0.05). It is noteworthy that PTPRC exhibited a transient increase in the early stages of OGD (2–6 hours) before rapidly declining, potentially indicating its immunomodulatory role during the early phase of cell injury38 and the regulatory effect of TDN on its expression. Simultaneously, TDN treatment also significantly reduced the levels of P-RIP3 and P-MLKL proteins (p < 0.01 compared to the OGD group, p < 0.05 for comparison between groups receiving TDN). Flow cytometry further confirmed that TDN markedly attenuated OGD-induced cell apoptosis (Figure 6C). Western blot (WB) analysis confirmed that the expression levels of both RIP3 and MLKL proteins were elevated in the OGD-induced cell model. Treatment with TDN significantly reduced the expression of these proteins (Figure 6D).
These findings indicate that the key mechanism underlying OGD-induced cell injury involves the upregulation of CCR9 and PTPRC as well as the activation of the necroptotic pathway. TDN mitigates apoptosis and cellular damage by significantly inhibiting the expression of CCR9 and PTPRC and the activation of P-RIP3 and P-MLKL. This further underscores TDN’s therapeutic potential for treating DVT and hypoxia-related diseases, with CCR9 and PTPRC serving as potential molecular targets.
Furthermore, we conducted in vitro experiments, such as an endothelial-macrophage adhesion assay, to validate the immunothrombotic regulatory mechanism. The results demonstrated that OGD intervention significantly increased the adhesion of THP-1 cells to endothelial cells. In contrast, treatment with TDNs following OGD markedly reduced THP-1 cell adhesion, suggesting that TDNs effectively inhibit macrophage adhesion to injured endothelial cells (Supplementary Figure 4).
TDN Reduces Necroptosis via Inhibition of CCR9, PTPRC, P-RIP3, and P-MLKL Interactions
Further investigations revealed potential complex interactions among CCR9, PTPRC, RIP3, and MLKL proteins, collectively driving cell apoptosis and injury. Using lentivirus-mediated knockdown experiments (via si-CCR9 and si-PTPRC), this study assessed the roles of CCR9 and PTPRC in OGD-induced apoptosis and necroptotic pathways. Flow cytometry data demonstrated that knocking down CCR9 and PTPRC significantly reduced apoptosis (p < 0.001) (Figure 7A). Additionally, Western blot (WB) analysis revealed that the protein levels of CCR9, PTPRC, P-RIP3 and P-MLKL were significantly decreased following knockdown (p < 0.05) (Figure 7B). These results highlight the critical roles of CCR9 and PTPRC in apoptosis and their potential linkage with necroptotic pathways.
 |
Figure 7 CCR9 and PTPRC silencing reduces apoptosis and necroptotic activation. (A) Flow cytometry analysis of cell apoptosis following CCR9 and PTPRC knockdown. (B) WB analysis of CCR9, PTPRC, p-RIP3, and p-MLKL protein expression in cells following silencing of CCR9 and PTPRC, with β-actin as the internal control. Statistical annotation: * p < 0.05, ** p < 0.01, *** p < 0.001, **** p < 0.0001. |
Following the addition of TDN, apoptosis was further reduced, accompanied by significant downregulation of related protein expressions (p < 0.05). These findings suggest that TDN modulates the expression of CCR9 and PTPRC, disrupts signaling crosstalk between RIP3 and MLKL, and ultimately alleviates oxidative stress-induced damage under OGD conditions. Taken together, the interactions among CCR9, PTPRC, RIP3 and MLKL are likely central to the anti-apoptotic mechanism of TDN, providing further evidence for the integral roles of inflammatory immunity and necroptosis in cellular injury.39
Structural Interaction Between RIP3 and PTPRC
Understanding molecular-level protein-protein interactions is crucial for elucidating disease mechanisms and identifying therapeutic targets. In this study, bioinformatics prediction and experimental validation were conducted to uncover the direct binding and structural interaction between RIP3 and PTPRC. By retrieving protein sequences of RIP3 and PTPRC from the UniProt database, the tertiary structures of these proteins were predicted using I-TASSER, followed by rigid and flexible docking simulations via Rosetta and ClusPro, respectively, to determine the optimal binding conformation. Free energy analysis revealed a binding energy of −21.729 kcal/mol between RIP3 and PTPRC, indicating a strong binding affinity (Figure 8A and B).
 |
Figure 8 Schematic of RIP3 and PTPRC protein binding and interaction. (A) 2D schematic showing the interaction between PTPRC (P-chain) and RIPK3 (R-chain) proteins. Residues involved in hydrogen bond formation (yellow) or salt bridge interactions (red) are highlighted, with the bond lengths indicated near the dashed lines in Å. (B) 3D model showing the spatial arrangement of PTPRC and RIPK3 proteins, where PTPRC is depicted in purple and RIPK3 in pink. Residue interactions are annotated, with red dashed lines representing hydrogen bonds and yellow dashed lines representing salt bridge interactions. Bond lengths are labeled near the dashed lines in Å. (C) Immunofluorescence colocalization of PTPRC and RIP3 proteins. PTPRC is labeled in green fluorescence, RIP3 is labeled in red fluorescence, and nuclei are labeled in blue fluorescence. The scale bar represents 1 µm. (D) Co-immunoprecipitation (Co-IP) analysis of the interaction between PTPRC and RIP3 proteins. “Input” represents untreated original protein samples, “IgG” serves as an HRP-labeled negative control, and “anti-RIP3” refers to samples treated with RIP3 antibody for pull-down assays. The Western blot (WB) results demonstrate consistent findings across two Co-IP experiments. |
LigPlot analysis revealed key amino acid residues contributing to the interaction, where stable hydrogen bonds were observed between LYS-674 from PTPRC and ASP-178 from RIP3, as well as ARG-673 from PTPRC and PHE-111 from RIP3. Furthermore, immunofluorescence co-localization experiments indicated strong co-expression of RIP3 and PTPRC in cellular compartments, suggesting functional co-regulation (Figure 8C). Co-immunoprecipitation (Co-IP) assays confirmed direct binding between RIP3 and PTPRC, as PTPRC was significantly enriched when RIP3 antibodies were used for pull-down experiments (Figure 8D). Together, these findings demonstrate a direct molecular interaction between RIP3 and PTPRC, implicating them in the regulation of the inflammation-necroptosis network. This discovery provides critical insights into the underlying mechanisms of TDN function.
Conclusion
In summary, this study demonstrates that tetrahedral DNA nanostructures (TDNs) exert multi-target therapeutic effects against deep vein thrombosis (DVT) through coordinated modulation of necroptotic, inflammatory, and oxidative stress pathways. The key findings reveal that TDNs significantly inhibit the phosphorylation of core necroptosis executers RIP3 and MLKL, thereby attenuating endothelial cell death and thrombus formation. Furthermore, TDNs downregulate critical immune-thrombotic regulators PTPRC (CD45) and CCR9, disrupting leukocyte activation and endothelial inflammation. Transcriptomic and biochemical analyses confirm that TDNs restore redox homeostasis by enhancing superoxide dismutase (SOD) activity and reducing malondialdehyde (MDA) levels, breaking the vicious cycle between oxidative stress and necroptosis. Importantly, protein interaction studies identify a novel complex between RIP3 and PTPRC, providing a mechanistic link between immune receptor signaling and necroptotic cell death. Collectively, these results underscore TDNs as a promising nanotherapeutic strategy that simultaneously targets the necroptotic-inflammatory-oxidative axis in DVT, offering a multifaceted alternative to conventional mono-target therapies.Despite these promising findings, this study has several limitations. The research was conducted in a mouse model of DVT, and caution should be exercised in extrapolating the results to human patients due to known interspecies differences in immune responses and molecular pathways. Furthermore, the long-term biosafety, potential off-target effects, and in vivo durability of TDNs require further comprehensive evaluation before clinical translation. Future studies should focus on establishing optimized dose-response relationships, evaluating potential synergies between TDNs and existing antithrombotic drugs, and exploring the applicability of this approach in other hypoxia-related or inflammation-driven thrombotic diseases. Such efforts will help advance TDNs as a safe and effective strategy for personalized nanomedicine in vascular therapeutics.
Acknowledgments
The authors gratefully acknowledge the financial support to this research work from the Association Foundation Program of Yunnan Science and Technology Department and Kunming Medical University (grant number 202201AY070001-271, 202201AY070001-273), Funded by the Yunnan University Medical Research Foundation (grant number YDYXJJ2024-0013), Yunnan Provincial Cardiovascular Ultrasound Innovation Team Project (202305AS350021) and Yunnan Provincial Biomedicine Major Special Project (202402AA310052). The authors would like to express sincere gratitude to Dr. Sun Yue for her professional assistance in statistical data analysis, and Dr. Yuxue Wang for her expertise in the preparation of animal models. Their expertise greatly enhanced the quality of this work.
Disclosure
The author(s) report no conflicts of interest in this work.
References
1. Weitz J, Chan N. Novel antithrombotic strategies for treatment of venous thromboembolism. Blood. 2020;135(5):351–359. doi:10.1182/blood.2019000919
2. Jin MC, Sussman ES, Feng AY, et al. Hemorrhage risk of direct oral anticoagulants in real-world venous thromboembolism patients. Thromb Res. 2021;204:126–133. doi:10.1016/j.thromres.2021.06.015
3. Makedonov I, Kahn SR, Abdulrehman J, et al. Prevention of the postthrombotic syndrome with anticoagulation: a narrative review. Thromb Haemost. 2022;122(8):1255–1264. doi:10.1055/a-1711-1263
4. Henke P. Endothelial cell-mediated venous thrombosis. Blood. 2022;140(13):1459–1460. doi:10.1182/blood.2022017938
5. Aird WC. Phenotypic heterogeneity of the endothelium: i. structure, function, and mechanisms. Circ Res. 2007;100(2):158–173. doi:10.1161/01.RES.0000255691.76142.4a
6. Chanchal S, Mishra A, Singh MK, Ashraf MZ. Understanding inflammatory responses in the manifestation of prothrombotic phenotypes. Front Cell Dev Biol. 2020;8:73. doi:10.3389/fcell.2020.00073
7. Colling ME, Tourdot BE, Kanthi Y. Inflammation, infection and venous thromboembolism. Circ Res. 2021;128(12):2017–2036. doi:10.1161/CIRCRESAHA.121.318225
8. Metz AK, Luke CE, Dowling A, Henke PK. Acute experimental venous thrombosis impairs venous relaxation but not contraction. J Vasc Surg. 2020;71(3):1006–1012e1. doi:10.1016/j.jvs.2019.03.064
9. Vanden Berghe T, Linkermann A, Jouan-Lanhouet S, Walczak H, Vandenabeele P. Regulated necrosis: the expanding network of non-apoptotic cell death pathways. Nat Rev Mol Cell Biol. 2014;15(2):135–147. doi:10.1038/nrm3737
10. Pasparakis M, Vandenabeele P. Necroptosis and its role in inflammation. Nature. 2015;517(7534):311–320. doi:10.1038/nature14191
11. Nakazawa D, Desai J, Steiger S, et al. Activated platelets induce MLKL-driven neutrophil necroptosis and release of neutrophil extracellular traps in venous thrombosis. Cell Death Discov. 2018;4:6. doi:10.1038/s41420-018-0073-2
12. Li Y, Chen J, Yang Y, et al. Necroptosis plays a crucial role in vascular injury during DVT and is enhanced by IL-17B. J Immunol Res. 2022;2022:6909764. doi:10.1155/2022/6909764
13. Zhang T, Tian T, Zhou R, et al. Design, fabrication and applications of tetrahedral DNA nanostructure-based multifunctional complexes in drug delivery and biomedical treatment. Nat Protoc. 2020;15(8):2728–2757. doi:10.1038/s41596-020-0355-z
14. Lin Y, Li Q, Wang L, et al. Advances in regenerative medicine applications of tetrahedral framework nucleic acid-based nanomaterials: an expert consensus recommendation. Int J Oral Sci. 2022;14(1):51. doi:10.1038/s41368-022-00199-9
15. Duangrat R, Udomprasert A, Kangsamaksin T. Tetrahedral DNA nanostructures as drug delivery and bioimaging platforms in cancer therapy. Cancer Sci. 2020;111(9):3164–3173. doi:10.1111/cas.14548
16. Dou Y, Cui W, Yang X, Lin Y, Ma X, Cai X. Applications of tetrahedral DNA nanostructures in wound repair and tissue regeneration. Burns Trauma. 2022;10:tkac006. doi:10.1093/burnst/tkac006
17. Zhang M, Zhu J, Qin X, et al. Cardioprotection of tetrahedral DNA nanostructures in myocardial ischemia-reperfusion injury. ACS Appl Mater Interfaces. 2019;11(34):30631–30639. doi:10.1021/acsami.9b10645
18. Sirong S, Yang C, Taoran T, et al. Effects of tetrahedral framework nucleic acid/wogonin complexes on osteoarthritis. Bone Res. 2020;8:6. doi:10.1038/s41413-019-0077-4
19. Diaz JA, Farris DM, Wrobleski SK, Myers DD, Wakefield TW. Inferior vena cava branch variations in C57BL/6 mice have an impact on thrombus size in an IVC ligation (stasis) model. J Thromb Haemost. 2015;13(4):660–664. doi:10.1111/jth.12866
20. Diaz JA, Saha P, Cooley B, et al. Choosing a mouse model of venous thrombosis: a consensus assessment of utility and application. J Thromb Haemost. 2019;17(4):699–707. doi:10.1111/jth.14413
21. Chessum JE, Shaya SA, Rajab D, et al. Thrombin-activatable fibrinolysis inhibitor and sex modulate thrombus stability and pulmonary embolism burden in a murine model. J Thromb Haemost. 2024;22(1):263–270. doi:10.1016/j.jtha.2023.09.016
22. Zhou M, Zhang T, Zhang B, et al. A DNA nanostructure-based neuroprotectant against neuronal apoptosis via inhibiting toll-like receptor 2 signaling pathway in acute ischemic stroke. ACS Nano. 2022;16(1):1456–1470. doi:10.1021/acsnano.1c09626
23. Zhou M, Zhang T, Zhang X, et al. Effect of tetrahedral framework nucleic acids on neurological recovery via ameliorating apoptosis and regulating the activation and polarization of astrocytes in ischemic stroke. ACS Appl Mater Interfaces. 2022;14(33):37478–37492. doi:10.1021/acsami.2c10364
24. Cui Y, Ren N, Qingnuan L, et al. A systematic study in mammalian cells shows no adverse response to tetrahedral DNA nanostructure. ACS APPL MATER INTER. 2018;10(18):15442–15448. doi:10.1021/acsami.8b02626
25. Zhang Y, Zhang J, Yan R, et al. Receptor-interacting protein kinase 3 promotes platelet activation and thrombosis. Proc Natl Acad Sci U S A. 2017;114(11):2964–2969. doi:10.1073/pnas.1610963114
26. Weinlich R, Oberst A, Beere HM, Green DR. Necroptosis in development, inflammation and disease. Nat Rev Mol Cell Biol. 2017;18(2):127–136. doi:10.1038/nrm.2016.149
27. Zhang Q, Lin S, Shi S, et al. Anti-inflammatory and antioxidative effects of tetrahedral DNA nanostructures via the modulation of macrophage responses. ACS Appl Mater Interfaces. 2018;10(4):3421–3430. doi:10.1021/acsami.7b17928
28. Szklarczyk D, Gable AL, Lyon D, et al. STRING v11: protein-protein association networks with increased coverage, supporting functional discovery in genome-wide experimental datasets. Nucleic Acids Res. 2019;47(D1):D607–D613. doi:10.1093/nar/gky1131
29. Engelmann B, Massberg S. Thrombosis as an intravascular effector of innate immunity. Nat Rev Immunol. 2013;13(1):34–45. doi:10.1038/nri3345
30. Courtney AH, Shvets AA, Lu W, et al. CD45 functions as a signaling gatekeeper in T cells. Sci Signal. 2019;12(604). doi:10.1126/scisignal.aaw8151
31. Huang J, Liang X, Zhao M, Zhang Y, Chen Z. Metabolomics and network pharmacology reveal the mechanism of antithrombotic effect of Asperosaponin VI. Biomed Pharmacother. 2024;173:116355. doi:10.1016/j.biopha.2024.116355
32. Wu X, Sun M, Yang Z, et al. The roles of CCR9/CCL25 in inflammation and inflammation-associated diseases. Front Cell Dev Biol. 2021;9:686548. doi:10.3389/fcell.2021.686548
33. Schrottmaier WC, Mussbacher M, Salzmann M, Assinger A. Platelet-leukocyte interplay during vascular disease. Atherosclerosis. 2020;307:109–120. doi:10.1016/j.atherosclerosis.2020.04.018
34. Wilhelm G, Mertowska P, Mertowski S, et al. The crossroads of the coagulation system and the immune system: interactions and connections. Int J Mol Sci. 2023;24(16):12563. doi:10.3390/ijms241612563
35. Li Y, Li Q, Cao Z, Wu J. Multicenter proteome-wide mendelian randomization study identifies causal plasma proteins in melanoma and non-melanoma skin cancers. Commun Biol. 2024;7(1):857. doi:10.1038/s42003-024-06538-2
36. Sethi GS, Ramamoorthy Premlal AL, Chawla A, Croft M. ICOSL, OX40L, and CD30L control persistence of asthmatic CD4 tissue-resident memory CD4 T cells. J Allergy Clin Immunol. 2025;155(6):1993–2008. doi:10.1016/j.jaci.2024.12.1097
37. DeRoo E, Zhou T, Yang H, Stranz A, Henke P, Liu B. A vein wall cell atlas of murine venous thrombosis determined by single-cell RNA sequencing. Commun Biol. 2023;6(1):130. doi:10.1038/s42003-023-04492-z
38. Rheinlander A, Schraven B, Bommhardt U. CD45 in human physiology and clinical medicine. Immunol Lett. 2018;196:22–32. doi:10.1016/j.imlet.2018.01.009
39. Gong Y, Fan Z, Luo G, et al. The role of necroptosis in cancer biology and therapy. Mol Cancer. 2019;18(1):100. doi:10.1186/s12943-019-1029-8
 © 2025 The Author(s). This work is published and licensed by Dove Medical Press Limited. The
full terms of this license are available at https://www.dovepress.com/terms
and incorporate the Creative Commons Attribution
- Non Commercial (unported, 4.0) License.
By accessing the work you hereby accept the Terms. Non-commercial uses of the work are permitted
without any further permission from Dove Medical Press Limited, provided the work is properly
attributed. For permission for commercial use of this work, please see paragraphs 4.2 and 5 of our Terms.
© 2025 The Author(s). This work is published and licensed by Dove Medical Press Limited. The
full terms of this license are available at https://www.dovepress.com/terms
and incorporate the Creative Commons Attribution
- Non Commercial (unported, 4.0) License.
By accessing the work you hereby accept the Terms. Non-commercial uses of the work are permitted
without any further permission from Dove Medical Press Limited, provided the work is properly
attributed. For permission for commercial use of this work, please see paragraphs 4.2 and 5 of our Terms.