Back to Journals » Clinical Ophthalmology » Volume 8
Test-retest variability of multifocal electroretinography in normal volunteers and short-term variability in hydroxychloroquine users
Authors Browning D ![]() , Lee C
, Lee C
Received 19 April 2014
Accepted for publication 27 May 2014
Published 7 August 2014 Volume 2014:8 Pages 1467—1473
DOI https://doi.org/10.2147/OPTH.S66528
Checked for plagiarism Yes
Review by Single anonymous peer review
Peer reviewer comments 3
David J Browning,1 Chong Lee2
1Charlotte Eye, Ear, Nose and Throat Associates, 2University of North Carolina – Charlotte, Charlotte, NC, USA
Purpose: To determine measurement variability of N1P1 amplitudes and the R1/R2 ratio in normal subjects and hydroxychloroquine users without retinopathy.
Design: Retrospective, observational study.
Subjects: Normal subjects (n=21) and 44 patients taking hydroxychloroquine (n=44) without retinopathy.
Methods: Multifocal electroretinography (mfERG) was performed twice in one session in the 21 normal subjects and twice within 1 year in the hydroxychloroquine users, during which time no clinical change in macular status occurred.
Main outcome measures: N1P1 amplitudes of rings R1–R5, the R1/R2 ratio, and coefficients of repeatability (COR) for these measurements.
Results: Values for N1P1 amplitudes in hydroxychloroquine users were reduced compared with normal subjects by the known effect of age, but R1/R2 was not affected by age. The COR for R1–R5 ranged from 43% to 52% for normal subjects and from 43% to 59% for hydroxychloroquine users; for R1/R2 the COR was 29% in normal subjects and 45% in hydroxychloroquine users.
Conclusion: mfERG measurements show high test-retest variability, limiting the ability of a single mfERG test to influence a decision to stop hydroxychloroquine; corroborative evidence with a different ancillary test is recommended in a suspicious case.
Keywords: multifocal electroretinography, hydroxychloroquine, test-retest variability
Introduction
In 2011, the American Academy of Ophthalmology (AAO) published revised guidelines for screening hydroxychloroquine retinopathy.1 These recommended the use of what were termed objective ancillary tests, including multifocal electroretinography (mfERG), when available.1 Screening for retinopathy occurs over a period of years, typically with tests taken multiple times and interpretations compared longitudinally. In this situation, it is necessary to quantitate both measurement noise and short-term variation of the measurements in order to be able to recognize true changes that represent disease onset and progression. In this article, test-retest variability (measurement noise) in normal volunteers and short-term variation in hydroxychloroquine users without retinopathy were assessed.
A clinical case will make the issues concrete and motivate the need for the study.
Case report
A 64-year-old woman with rheumatoid arthritis was placed on hydroxychloroquine in 2007. She was 170 cm and weighed 84 kg. Her ideal body weight according to the National Heart Lung and Blood Institute table was 69 kg.2,3 She took hydroxychloroquine 400 mg/day for 6 years. Her best corrected visual acuity was 20/25 in each eye, secondary to early nuclear sclerotic cataracts. Her maculas at baseline were normal. She had no renal or liver disease.
Yearly 10-2 visual field (VF) testing with a III, red test object was normal for 6 consecutive years (Figure 1). When the AAO revised guidelines were published, mfERG testing was began. The results are shown for 3 consecutive years (Figure 2). Because of reductions in N1P1 amplitudes noted in 2012, the question arose as to whether she had toxicity and needed to be taken off hydroxychloroquine.
 | Figure 1 10-2 visual fields over six years. |
 | Figure 2 mfERGS for three consecutive years. |
Methods
This was a retrospective study of 21 normal subjects and 44 patients taking hydroxychloroquine, who were free of retinopathy, in a private multispecialty practice with 26 ophthalmologists and three optometrists. The 21 normal subjects were tested twice in a single session. mfERGs were recorded twice within 1 year from the 44 patients taking hydroxychloroquine. These patients had no change in their clinical condition between the first and second measurements and were not receiving toxic daily dosing. The two measurements provided data on short-term variation in the mfERG.
The radius of the stimulus zone was 25 degrees. The variables examined were the R1–R5 ring N1P1 amplitudes, the R1/R2 ring ratio, the R5/R4 ring ratio, and the R5/R3 ring ratio. One eye for each subject was chosen for analysis. For each index, the sample mean for the combination of both trials was used to normalize the measurements. The normalized measurements were analyzed via the method of Bland and Altman to calculate the coefficient of repeatability (COR), defined as 1.96 times the standard deviation of the differences between the paired measurements.4 The probability is 95% that a change in an index that exceeds the COR can be judged to be real, and not random variation in the measurement (noise).4
To avoid problems of correlated results between eyes, only one eye was included per patient.5 When only one of two eyes had good-quality testing (no 60-cycle noise and no evidence of eccentric fixation), that eye was chosen. When two eyes had good-quality testing, a random number generator was used to pick which of the two was included.
mfERGs were performed following International Society for Clinical Electrophysiology of Vision (ISCEV) guidelines as previously described.6,7 The mfERGs were performed with the Espion system (Diagnosys LLC, Lowell, MA, USA) running under version 6+ software. DTL (Dawson, Trick, and Litzkow) fiber electrodes were used. The patients’ eyes were dilated and topical anesthetic was used. The stimulation pattern was dictated by an m-sequence controlling the illumination of 61 contiguous hexagons subtending 30 degrees of VF to either side of fixation. The luminances of the white and black hexagons were 1,000 cd/m2 and 0 cd/m2, respectively. Signals were processed through a 10–100 hertz bandpass filter. The first order kernel response was analyzed. The waveform amplitudes refer to the response density measured from the trough of the N1 wave to the peak of the P1 wave. The displays are shown in the retinal view (as though looking at a fundus photograph, not as though looking at a VF).
Waiver of informed consent and waiver of Health Insurance Portability and Accountability Act (HIPAA) authorization were approved by the Presbyterian Hospital Institutional Review Board.
Results
The demographic characteristics of the normal subjects and patients taking hydroxychloroquine without retinopathy are shown in Table 1. The hydroxychloroquine users were older than the normal subjects (median age 62 and 38 years, respectively). The mfERG amplitudes from the normal subjects and hydroxychloroquine users are shown in Table 2. The amplitudes were lower in the hydroxychloroquine users, consistent with their increased age relative to the normal subjects.8 The test-retest variability in the normal subjects is shown in Table 3. Neither fixed nor proportional bias was manifest in the test-retest measurements (Figure 3). The COR was 16.1 nV/deg2 and 7.2 nV/deg2 for the averaged measurements of rings R1 and R2, respectively, the rings most closely assessed in evaluating hydroxychloroquine retinopathy. The COR for the R1/R2 ratio was 0.54. Expressing the measurements in relative terms, the CORs for R1, R2 and the R1/R2 ratio were 52%, 43%, and 29%, respectively. The smallest CORs were found for R5/R4 and R5/R3 (Table 3).
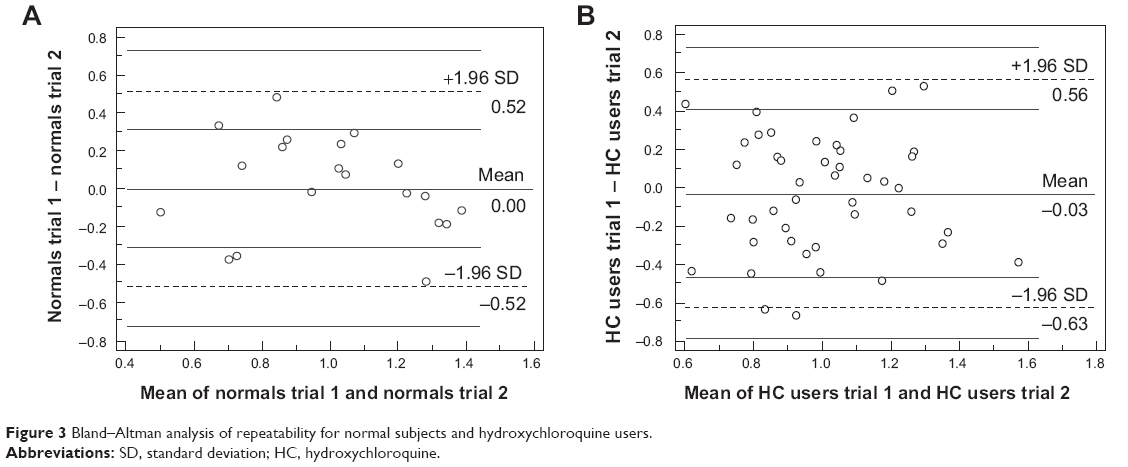 | Figure 3 Bland–Altman analysis of repeatability for normal subjects and hydroxychloroquine users. |
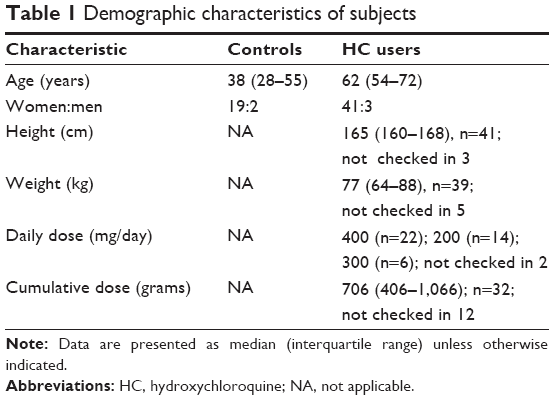 | Table 1 Demographic characteristics of subjects |
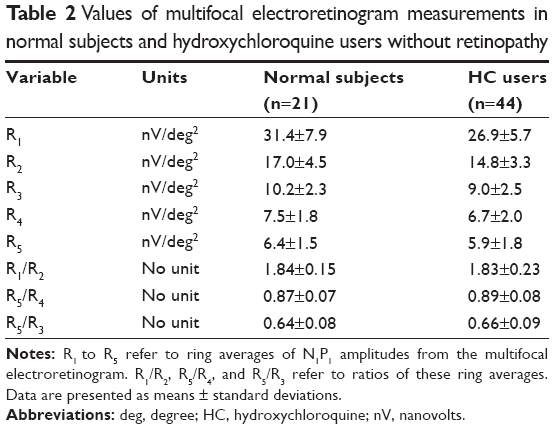 | Table 2 Values of multifocal electroretinogram measurements in normal subjects and hydroxychloroquine users without retinopathy |
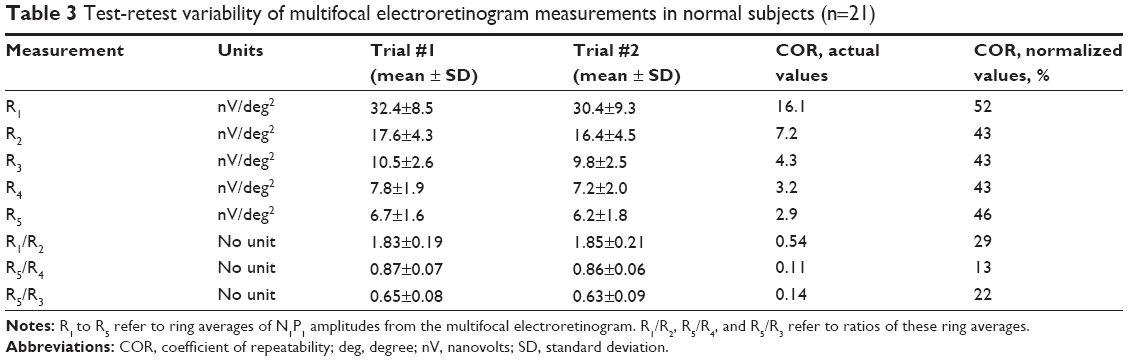 | Table 3 Test-retest variability of multifocal electroretinogram measurements in normal subjects (n=21) |
The short-term variability in hydroxychloroquine users is shown in Table 4. The magnitudes of the measurement differences from tests separated by months were no greater than the measurement differences in tests performed minutes apart in normal subjects. The COR extracted from these measurements was 16.0 nV/deg2 and 7.6 nV/deg2 for the averaged measurements of rings R1 and R2, respectively. The COR for the R1/R2 ratio in hydroxychloroquine users was 0.89. Expressing the measurements in relative terms, the CORs for R1, R2, and the R1/R2 ratio were 59%, 53%, and 45%, respectively. The smallest CORs were found for R5/R4 and R5/R3 (Table 4).
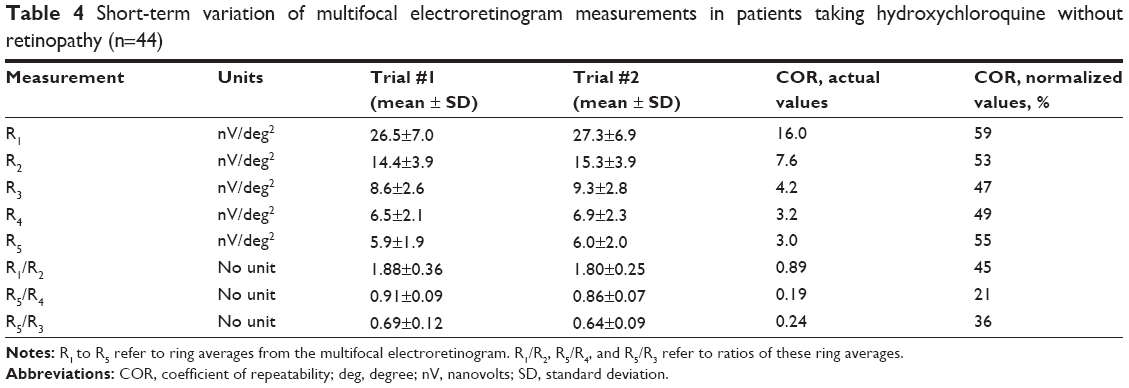 | Table 4 Short-term variation of multifocal electroretinogram measurements in patients taking hydroxychloroquine without retinopathy (n=44) |
Discussion
mfERG measurements suffer from high inter-test variability, in part due to the technical skills of the person administering the test.9–14 This limitation is not appreciated by many clinicians who have been advised to use the test in hydroxychloroquine screening.1 In the case report, for the right eye, R1 in the third study is decreased by 41% compared with baseline, which is less than the 59% COR for R1 in hydroxychloroquine users. Therefore, this change probably reflects measurement variability. Similar comments apply to the changes observed in R2 for the right eye and both R1 and R2 in the left eye. R1/R2 is not abnormal for either eye in any of the three studies.
Some authors place diagnostic weight on individual hexagonal waveforms of the mfERG. There is no evidence that the variability of individual hexagonal waveforms is less than for ring averages and ratios.10,13
The overall clinical picture carries more weight than isolated mfERG testing. For example, the patient in the case report had been on hydroxcyhloroquine <6.0 mg/kg/day based on ideal body weight and had consistently normal 10-2 VFs. There was no need to stop hydroxychloroquine nor to reduce the daily dose despite the decrease in the mfERG amplitudes in the 8-19-2013 study.
The short-term variability of mfERG measurements in patients taking hydroxychloroquine was similar to the test-retest variability in normal subjects, as has been reported by other investigators.14 Some have reported that variability of N1P1 amplitudes increases in the outer rings, but our measurements did not show this. The variability of the R1/R2 ratio was not better than that of N1P1 amplitudes to a clinically important extent. The usefulness of mfERG measurements in screening for hydroxychloroquine retinopathy is limited by their variability compared with the low variability of spectral domain optical coherence tomography (SD-OCT) images and thickness measurements, which can also be used for this purpose.15
Certain mfERG variables are age dependent.16 The response densities of individual hexagons can decrease from 5% to 12% per decade of age.17 Ring amplitudes decrease with age at approximately 11% per decade.16,18 Both N1 and P1 implicit times decrease at approximately 1% per decade.16 This adds an additional level of complexity to mfERG analysis of patients taking hydroxychloroquine, because patients taking hydroxychloroquine are often older than the normal population from which tables of normal mfERG values are derived. One method to circumvent this difficulty is to emphasize ring ratios, some of which are invariant with respect to age. For example, R1/R2, R1/R3, and R1/R4 have been reported to be invariant with respect to age.18 In particular, R1/R2 has been reported as particularly useful in assessing hydroxychloroquine toxicity, with 2.6 used as a cut point for classification of responses as abnormal or not.8 Another advantage cited for ring ratio analysis has been better reproducibility than amplitude measurements.18 The data herein do not support this notion. CORs for R1/R2 ratios in this study were no better than for N1P1 amplitudes. CORs for R5/R4 and R5/R3 were smaller, but these indices have only been used in one report to date.24
Because of the variability of the mfERGs, several tests should usually be conducted before deciding that hydroxychloroquine should be stopped, if other tests have not clarified the patient’s status. Otherwise, one might stop a useful drug based on a decrease in mfERG amplitude that in reality reflected only intersession variability of the measurements.19–22 In fact, some investigators think that the sole purpose of the mfERG is to raise suspicion, with other tests necessary to confirm or disconfirm the presence of retinopathy.20,23 At the other end of the spectrum of hydroxychloroquine retinopathy, the value of mfERG in more advanced cases has been questioned; if a more reliable test such as SD-OCT shows retinopathy, mfERG adds little.21,22
The limitations of this study include relatively small numbers of normal subjects and patients taking hydroxychloroquine. In addition, mfERG results vary across instruments, laboratories, and testing conditions, making it difficult to generalize to other settings.
Conclusion
These results provide estimates for variability in mfERG testing among patients being screened for hydroxychloroquine retinopathy. Caution against over-reliance on the results of a single mfERG test is warranted. Corroborative testing with other modalities such as the 10-2 VF and SD-OCT are indicated before stopping therapy based on an abnormal mfERG test.
Disclosure
No financial support was received for this work. The authors report no conflicts of interest in this work.
References
Marmor MF, Kellner U, Lai TY, Lyons JS, Mieler WF; American Academy of Ophthalmology. Revised recommendations on screening for chloroquine and hydroxychloroquine retinopathy. Ophthalmology. 2011;118(2):415–422. | ||
Browning DJ. Hydroxychloroquine and chloroquine retinopathy: screening for drug toxicity. Am J Ophthalmol. 2002;133(5):649–656. | ||
Browning DJ. Reply to defining ideal body weight. Am J Ophthalmol. 2002;134(6):935–936. | ||
Bland JM, Altman DG. Statistical methods for assessing agreement between two methods of clinical measurement. Lancet. 1986;1(8476):307–310. | ||
Murdoch IE, Morris SS, Cousens SN. People and eyes: statistical approaches in ophthalmology. Br J Ophthalmol. 1998;82(8):971–973. | ||
Hood DC, Bach M, Brigell M, et al. ISCEV guidelines for clinical multifocal electroretinography (2007 edition). Doc Ophthalmol. 2008;116(1):1–11. | ||
Browning DJ. Impact of the revised american academy of ophthalmology guidelines regarding hydroxychloroquine screening on actual practice. Am J Ophthalmol. 2013;155(3):418–428. | ||
Lyons JS, Severns ML. Detection of early hydroxychloroquine retinal toxicity enhanced by ring ratio analysis of multifocal electroretinography. Am J Ophthalmol. 2007;143(5):801–809. | ||
Harrison WW, Bearse MA Jr, Ng JS, Barez S, Schneck ME, Adams AJ. Reproducibility of the mfERG between instruments. Doc Ophthalmol. 2009;119(1):67–78. | ||
Yoshii M, Yanashima K, Wakaguri T, et al. A basic investigation of multifocal electroretinogram: reproducibility and effect of luminance. Jpn J Ophthalmol. 2000;44(2):122–127. | ||
Parks S, Keating D, Evans A, Williamson TH, Lay JL, Elliott AT. Comparison of repeatability of the multifocal electroretinogram and Humphrey perimeter. Doc Ophthalmol. 1996–1997;92(4):281–289. | ||
Kondo M, Miyake Y, Horiguchi M, Suzuki S, Tanikawa A. Clinical evaluation of multifocal electroretinogram. Invest Ophthalmol Vis Sci. 1995;36(10):2146–2150. | ||
Bültmann S, Rohrschneider K. Reproducibility of multifocal ERG using the scanning laser ophthalmoscope. Graefes Arch Clin Exp Ophthalmol. 2002;240(10):841–845. | ||
Penrose PJ, Tzekov RT, Sutter EE, et al. Multifocal electroretinography evaluation for early detection of retinal dysfunction in patients taking hydroxychloroquine. Retina. 2003;23(4):503–512. | ||
Grover S, Murthy RK, Brar VS, Chalam KV. Comparison of retinal thickness in normal eyes using Stratus and Spectralis optical coherence tomography. Invest Ophthalmol Vis Sci. 2010;51(5):2644–2647. | ||
Seiple W, Vajaranant TS, Szlyk JP, et al. Multifocal electroretinography as a function of age: the importance of normative values for older adults. Invest Ophthalmol Vis Sci. 2003;44(4):1783–1792. | ||
Tzekov RT, Gerth C, Werner JS. Senescence of human multifocal electroretinogram components: a localized approach. Graefes Arch Clin Exp Ophthalmol. 2004;242(7):549–560. | ||
Lyons JS, Severns ML. Using multifocal ERG ring ratios to detect and follow Plaquenil retinal toxicity: a review: Review of mfERG ring ratios in plaquenil toxicity. Doc Ophthalmol. 2009;118(1):29–36. | ||
Marmor MF. The dilemma of hydroxychloroquine screening: new information from the multifocal ERG. Am J Ophthalmol. 2005;140(5): 894–895. | ||
Bergholz R, Schroeter J, Rüther K. Evaluation of risk factors for retinal damage due to chloroquine and hydroxychloroquine. Br J Ophthalmol. 2010;94(12):1637–1642. | ||
Marmor MF. Comparison of screening procedures in hydroxychloroquine toxicity. Arch Ophthalmol. 2012;130(4):461–469. | ||
Lai TY, Chan WM, Li H, Lai RY, Lam DS. Multifocal electroretinographic changes in patients receiving hydroxychloroquine therapy. Am J Ophthalmol. 2005;140(5):794–807. | ||
Chang WH, Katz BJ, Warner JE, Vitale AT, Creel D, Digre KB. A novel method for screening the multifocal electroretinogram in patients using hydroxychloroquine. Retina. 2008;28(10):1478–1486. | ||
Adam MK, Covert DJ, Stepien KE, Han DP. Quantitative assessment of the 103-hexagon multifocal electroretinogram in detection of hydroxychloroquine toxicity. Br J Ophthalmol. 2012;96(5):723–729. |
 © 2014 The Author(s). This work is published and licensed by Dove Medical Press Limited. The
full terms of this license are available at https://www.dovepress.com/terms
and incorporate the Creative Commons Attribution
- Non Commercial (unported, 3.0) License.
By accessing the work you hereby accept the Terms. Non-commercial uses of the work are permitted
without any further permission from Dove Medical Press Limited, provided the work is properly
attributed. For permission for commercial use of this work, please see paragraphs 4.2 and 5 of our Terms.
© 2014 The Author(s). This work is published and licensed by Dove Medical Press Limited. The
full terms of this license are available at https://www.dovepress.com/terms
and incorporate the Creative Commons Attribution
- Non Commercial (unported, 3.0) License.
By accessing the work you hereby accept the Terms. Non-commercial uses of the work are permitted
without any further permission from Dove Medical Press Limited, provided the work is properly
attributed. For permission for commercial use of this work, please see paragraphs 4.2 and 5 of our Terms.