Back to Journals » Journal of Asthma and Allergy » Volume 9
Technical and clinical validation of an environmental exposure unit for ragweed
Authors Gomes PJ, Lane KJ, Angjeli E, Stein L, Abelson MB
Received 30 September 2016
Accepted for publication 11 November 2016
Published 14 December 2016 Volume 2016:9 Pages 215—221
DOI https://doi.org/10.2147/JAA.S123547
Checked for plagiarism Yes
Review by Single anonymous peer review
Peer reviewer comments 3
Editor who approved publication: Dr Luis Garcia-Marcos
Paul J Gomes,1 Keith J Lane,1 Endri Angjeli,1 Linda Stein,1 Mark B Abelson1,2
1Ora, Inc., Andover, MA, USA; 2Department of Ophthalmology, Harvard Medical School, Cambridge, MA, USA
Background: Allergic rhinitis is a common condition, with ragweed pollen one of the more prevalent aeroallergens. Environmental exposure units such as the Allergen BioCube® are valuable models for clinical allergy studies. A study was conducted to validate the Allergen BioCube for uniform ragweed pollen concentrations and clinically relevant sign and symptom responses to ragweed exposure.
Methods: Ragweed pollen concentrations were measured on 3 consecutive days in the Allergen BioCube and verified by Rotorod collection and continuous laser particle count measurements. Subjects (N=10) were exposed to ragweed pollen in the BioCube for 3 hours per day for 3 consecutive days. Subjects assessed their nasal itching, sneezing, rhinorrhea, and nasal congestion during each BioCube exposure; total nasal symptom score was computed. Peak nasal inspiratory flow was also assessed during BioCube exposure.
Results: Uniform ragweed pollen concentrations were obtained throughout each of the 3-hour testing periods in the Allergen BioCube, both spatially and temporally, at all subject positions, with a low mean standard deviation of 10%. Pronounced increases in mean total nasal symptom scores (6.7±0.94 to 7.6±0.86, last 90 minutes of exposure) occurred for all three BioCube ragweed pollen exposure visits. Mean peak nasal inspiratory flow decreased 24% at 3 hours of BioCube exposure on Day 3. No safety issues of concern occurred in this study.
Conclusion: The Allergen BioCube achieved technical and clinical validation for ragweed allergen. Ragweed pollen concentration was uniform both temporally and spatially. Allergic rhinitis signs and symptoms were induced in subjects during exposure to ragweed in the BioCube at clinically meaningful levels for allergy studies.
Keywords: Allergen BioCube®, validation, ragweed, symptom response, exposure unit
Introduction
Allergic rhinitis (AR) is a common condition affecting approximately 20% of the population worldwide.1,2 AR is triggered by seasonal or perennial allergens (eg, pollen of ragweed, trees, or grasses; dust mites, pet dander, molds). Nasal symptoms include nasal itching, sneezing, rhinorrhea, and nasal congestion. Ragweed pollen is one of the more prevalent aeroallergens in the US.
Clinical studies of AR traditionally have been conducted during the pollen season under natural environment conditions, often using field studies in which subjects are exposed to allergens in an outdoor setting, and responses are monitored. However, natural environmental studies for allergy research have important limitations, including variability in allergen concentrations and types at different geographical locations and from year to year at single locations. In addition, subjects in field studies are often exposed to pollen at different times within a single pollen season, contributing to variability in exposure patterns. Such inter- and intrasite variability limits the usefulness of environmental studies in assessing allergy symptoms and the onset and duration of action of treatments.
The objective of this study was to achieve uniform concentration and distribution of ragweed pollen and clinically relevant sign and symptom responses in the Allergen BioCube® (Ora, Inc., Andover, MA, USA), an environmental exposure unit (EEU). Several EEUs have been developed since the 1980s in the US, Canada, Japan, and Europe3 to control the variability associated with natural environmental studies. EEUs generally expose subjects to one allergen at a time to eliminate the confounding factors associated with multiple allergen exposures. EEUs (also called exposure chambers, allergy chambers, or allergen challenge chambers) are used to assess allergen exposures and clinical symptom responses, study the immunopathology and physiology of AR, and evaluate treatment efficacies.
One of the first EEUs, the EEU in Canada,4 was initially used in the early 1980s to evaluate the respiratory effects of urea formaldehyde foam insulation and was adapted in 1987 for allergy research. Other EEUs have included the Vienna Challenge Chamber in Austria;5 the Denmark chamber;6 the Fraunhofer Institute Environmental Challenge Chamber in Germany;7 the GA2LEN chamber in Germany;8 the OHIO, Wakayama, and Osaka/Chiba units in Japan;9–11 the Environmental Exposure Chamber in Canada;12 allergen Challenge Theatre in Canada;13 and the Atlanta Allergen Exposure Unit,14 the Allergen BioCube,15 and the Biogenics Research Chamber16 in the US. Several EEUs are described by Day et al3 and Ellis et al.17
Currently, the US Food and Drug Administration18 and the European Medicines Agency19 accept EEUs as a method for establishing seasonal AR prophylaxis time periods and onset of action of treatments for Phase II clinical trials and as supportive data for Phase III trials; the European Medicines Agency also suggests the use of EEUs for dose-finding studies for immunotherapeutic products. The US Food and Drug Administration20 accepts challenge model data for Phase I–IV clinical trials for other indications, such as allergic conjunctivitis and dry eye syndrome.
This paper discusses the technical and clinical validation of the Allergen BioCube for uniform ragweed pollen concentration and distribution and clinically relevant AR signs and symptoms.15
Methods
Technical validation
The Allergen BioCube is a 122 m2 level 3 clean room that can accommodate up to 25 subjects and 3 qualified clinical staff (Figure 1A). Allergen stability is achieved with control of airflow through straighteners, suspension aids, symmetric exhaust, and variable velocities that accommodate specific allergen size and properties. Circulated air and fresh air are passed through a series of high-efficiency particulate air filters to eliminate allergen and other particulates before the air is mixed with fresh allergen and redistributed into the subject exposure room. Technical validation of the Allergen BioCube was conducted to ensure that the specification for ragweed pollen concentration was met and that the concentration was uniform and reproducible throughout the BioCube and over time.
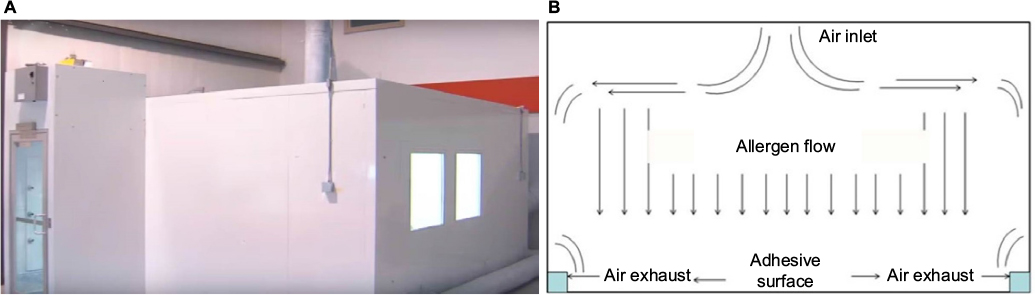 | Figure 1 (A) Exterior of the Allergen BioCube®. (B) Diagram of air and allergen flow in the Allergen BioCube. Notes: The allergen/air mixture enters the BioCube via a ceiling duct, which facilitates uniform allergen distribution |
Ragweed pollen concentration
Ragweed pollen used in the Allergen BioCube for this study was nondefatted short ragweed (Ambrosia artemesiifolia) pollen (Greer Laboratories, Lenoir, NC, USA), with purity certificates of analysis that indicated there was no fungi, bacteria, impurities, or any other biological matter in the sample. The specification for ragweed pollen concentration was 4,000±400 grains/m3 based on precedent, with other researchers and studies typically using concentrations that include this range for ragweed.14
BioCube allergen distribution
Pollen in the Allergen BioCube is transported through piping at a predetermined rate and volume and mixed with filtered air. The allergen/air mixture is introduced into the room from the ceiling and is radially distributed via laminar airflow (Figure 1B). Temperature (20°C–26°C) and relative humidity (35%–55%) in the BioCube were carefully controlled over each 3-hour continuous session in this ragweed validation study. Allergen/air travels downward and exits through return ventilation located near the floor along the perimeter of the room. Exhausted allergen and other particles pass through a series of high-efficiency particulate air filters, removing 99.97% of particulates ≥0.3 µm in diameter. The result is clean air that is significantly cleaner than average clinic, office, or outdoor air. Any portion of the ragweed that does not exit through the air return settles on the floor, where it is captured so that it does not re-aerosolize. An allergen buffer system (air shower) at the BioCube entrance creates buffer pressure to maintain airflow dynamics and allergen concentration whenever a subject enters or leaves the room and serves as a cleaning (decontamination) unit.
Technical validation methods
Allergen concentration testing was performed three times on 3 consecutive days without subjects to confirm allergen levels and reproducibility of results. Allergen levels were verified by Rotorod collection and laser particle counters (LPCs) to certify real-time particle counts. By placing LPCs at the height of the participants’ heads, the LPCs tracked only particles that came from the study participants. Pollen counts were measured at all subject positions during the entire 3-hour testing period each day.
Clinical validation
Clinical validation was conducted to confirm that clinically relevant AR signs and symptoms occurred in subjects exposed to ragweed in the Allergen BioCube. The study took place during October, after peak ragweed season in the Northeastern US. The subjects (N=10) were exposed to ragweed in the BioCube for up to 3 hours per day for 3 consecutive days. There were four study visits over the 3 days: Visit 1 (prior to Day 1) included screening and baseline/preexposure assessments; Visits 2, 3, and 4 (Days 1, 2, and 3, respectively) included ragweed exposure in the BioCube, during which nasal signs and symptoms were assessed. Safety evaluations were conducted at all visits.
Clinical validation methods
Subjects assessed four individual nasal symptom scores at each study visit: nasal itching, sneezing, rhinorrhea, and nasal congestion, using a 0–3 scale with 0=none, 1=mild, 2=moderate, and 3=severe. Subjects evaluated the four symptoms every 15 minutes for the 180 minutes (3 hours) they were exposed to ragweed in the BioCube. A composite score, total nasal symptom score (TNSS, 0–12 scale), was calculated as the sum of the individual symptom scores at each time point. A subject’s overall TNSS was based on the subject’s average TNSS score over the 90- to 180-minute period during BioCube ragweed exposure, which represented a plateau of symptoms. TNSS was averaged across all ten subjects for each BioCube exposure visit. Peak nasal inspiratory flow (PNIF) was evaluated by the investigator and measured preexposure and at 60, 120, and 180 minutes during BioCube allergen exposure. The mean of the time points from 90 through 180 minutes in the BioCube was reported as PNIF scores. Safety measures included pregnancy tests, nasal examinations, slit lamp biomicroscopy, peak expiratory flow rate (PEFR), and adverse event reporting. PEFR was measured every 60 minutes (±15 minutes) during ragweed exposure in the BioCube. The investigator and staff were blinded to subject symptom responses when assessing nasal safety parameters.
All subjects signed informed consent forms, and the study protocol and informed consent were approved by Alpha Institutional Review Board. Key inclusion criteria were a minimum of 18 years of age, a positive history of seasonal AR, a positive skin test reaction to ragweed (any increase in wheal size) within the past 24 months, and a positive nasal allergic response to ragweed in the BioCube defined as a TNSS of ≥6 on a standardized scale of composite nasal symptom scores, with a nasal congestion score of ≥2 during at least one time point. Subjects were recruited from a database of subjects who previously participated in clinical trials for allergic diseases.
Discontinuation of disallowed medications during the washout periods (7–45 days, depending on medication) was confirmed before initiating study procedures. Disallowed medications included H1 antihistamines, mast cell stabilizers, corticosteroids (inhaled, ocular, topical, depot), vasoconstrictors, decongestants, monoamine oxidase inhibitors, artificial tears, nasal washes, any other topical ophthalmic/nasal preparations, lid scrubs, prostaglandins, or nonsteroidal anti-inflammatory drugs. Any immunotherapeutic treatment must have been maintained steadily for at least 2 months. Other exclusion criteria were no history of mild persistent, moderate, or severe asthma within the preceding 5 years; no compromised lung function; no sinus or ocular infection; no respiratory tract infection; no nasal anatomical deformities or nasal or ocular conditions identified by the investigator as affecting the subject’s health or study parameters; no history of retinal detachment, diabetic retinopathy, or progressive retinal disease; no intraocular pressure <5 mmHg or >22 mmHg; and no nasal surgical intervention, among others.
Results
Technical validation results
The specification for ragweed pollen concentration of 4,000±400 grains/m3 was met throughout each of the 3-hour testing periods in the BioCube; Figure 2 shows the pollen concentrations for the third (last) technical validation session. Ragweed pollen concentration was uniform, both spatially and temporally, at all subject positions within the BioCube, as shown in Figure 3, with a low mean standard deviation (SD =10%), as confirmed by continuous measurements using LPCs. LPC measurements were consistent between the technical validation and the clinical validation, indicating that there was no significant contamination from subject-derived particles (ie, skin cells) inside the unit or when the clean room door was opened. Thus, the Allergen BioCube achieved technical validation for ragweed pollen.
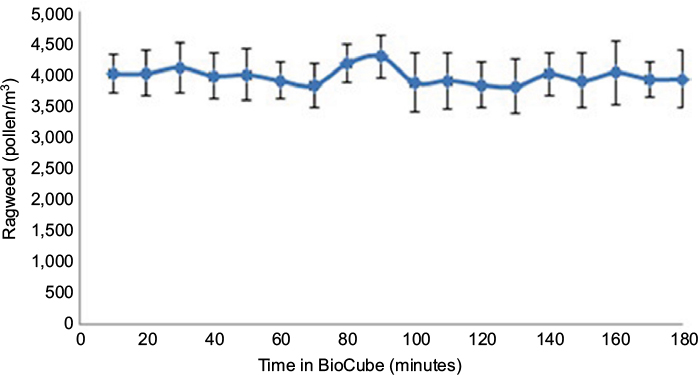 | Figure 2 Ragweed concentration in the Allergen BioCube® was within the specification of 4,000±400 grains/m3 throughout each 3-hour testing period, with a low mean standard deviation of 10% confirmed by multiple LPC counts. Notes: Results for the third (last) technical validation session shown. Abbreviation: LPC, laser particle counter. |
 | Figure 3 Ragweed concentrations at 4,000±400 grains/m3 in the Allergen BioCube® were uniform both spatially and temporally at all subject positions, with a mean low standard deviation of 10%. Results for the third (last) technical validation session shown. |
Clinical validation results
Average TNSS (N=10) increased from preexposure scores to TNSS of 6.7±0.94, 7.4±0.83, and 7.6±0.86 (Visits 2, 3, and 4, respectively) during the last 90–180 minutes of each exposure period in the BioCube (Table 1). Rapid onset of symptoms can be seen over the first 90 minutes of exposure, followed by a relative plateau during the last 90 minutes of exposure (Figure 4). Substantial increases also occurred for each of the four individual symptoms (Table 1). Subjects’ characteristics (age, gender, race, maximum TNSS) are shown in Table 2.
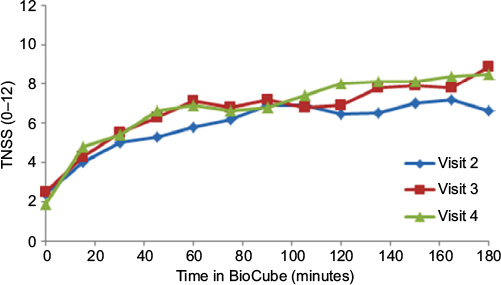 | Figure 4 Average TNSS increased from pre-BioCube ragweed exposures to TNSS of 6.7±0.94, 7.4±0.83, and 7.6±0.86 (Visits 2, 3, and 4, respectively) during the last 90–180 minutes of each BioCube exposure period. Notes: Rapid onset of symptoms occurred over the first 90 minutes of exposure, followed by a relative plateau during the last 90 minutes of exposure. Abbreviation: TNSS, total nasal symptom score. |
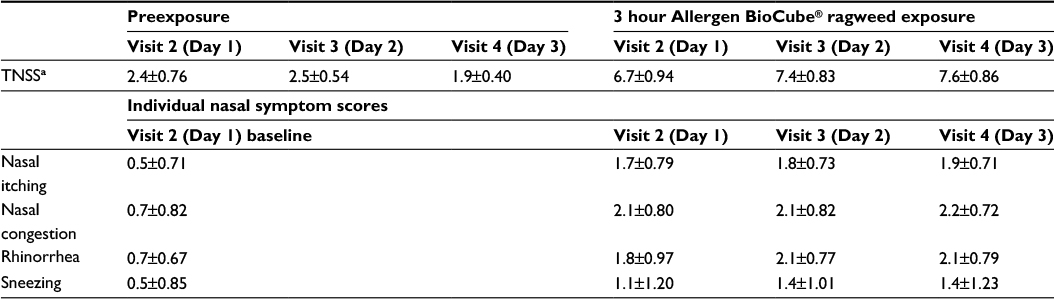 | Table 1 Mean individual nasal symptom scores and TNSS Notes: aSubjects assessed the four individual nasal symptom scores (nasal itching, sneezing, rhinorrhea, and nasal congestion) on a 0–3 scale (0 = none, 1 = mild, 2 = moderate, and 3 = severe). The composite TNSS score (0–12 scale) was calculated as the sum of the individual symptom scores. Abbreviation: TNSS, total nasal symptom score. |
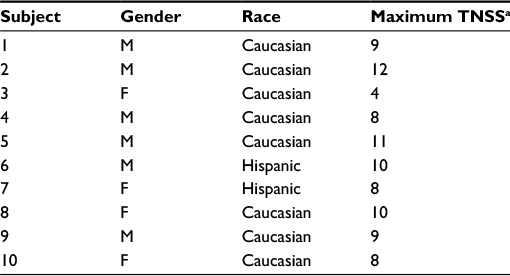 | Table 2 Subject characteristics Notes: aMaximum TNSS post-ragweed exposure in the Allergen BioCube®. Abbreviations: TNSS, total nasal symptom score; M, male; F, female. |
A small priming effect was noted; ie, TNSS, as well as individual nasal symptom scores, increased slightly during each subsequent BioCube ragweed exposure.
For PNIF, on average, there was a 24% drop in PNIF from preexposure to 180 minutes of BioCube ragweed exposure, indicating the onset of this AR sign in the BioCube.
The Allergen BioCube achieved clinical validation, with a clinically relevant sign (PNIF) and symptoms (TNSS and all four individual nasal symptoms) of AR in study subjects during ragweed exposure in the BioCube.
Subject safety
No safety issues of concern occurred in this study. Reduction in PEFR to 80% of baseline would have excluded subjects from further participation in the study, but this did not occur in any subjects. With a few exceptions, PEFR generally decreased in subjects from pre-BioCube ragweed exposure to the 180-minute BioCube exposure at all study visits, with the decreases always remaining within 20% of subjects’ baseline values. The ragweed allergen was well tolerated in all subjects. No serious or significant adverse events occurred during the BioCube ragweed exposures. No clinically significant changes occurred for any of the safety measures.
Discussion
Some early EEU studies experienced insufficient control of allergen release or had differing onset of action results for the same drug.4 These issues have been addressed in EEUs currently in use with system controls. A number of EEUs have been validated for uniform allergen concentration and induction of AR signs and symptoms; drug efficacy has also been evaluated and verified in EEUs.17,21–24
The precision of the Allergen BioCube in this ragweed pollen validation study was supported by a low SD (SD =0.10) for allergen concentration, which reduces the potential for nonresponder subjects due to an insufficient exposure system. The Allergen BioCube achieved uniform allergen concentration not only over time (each of three 3-hour testing periods), which is the most common technical validation method, but also at each individual subject location. Symptom response scores in the BioCube also had low SDs, eg, TNSS SD =0.86 at Day 3 (last 90 minutes), indicating the reliability of the small subject population (N=10) used to achieve clinically meaningful results.
Examination of individual nasal symptom responses, in addition to TNSS, can reveal important information. Clinically, some patients may suffer more from one symptom than another, and some drug treatments for AR do not adequately treat certain symptoms (eg, nasal congestion). In the BioCube ragweed study, all four individual nasal symptoms had notable increases during BioCube allergen exposure; methods and models that achieve differentiated subject symptom responses can contribute to the accuracy and usefulness of drug efficacy data.
In other preliminary studies, the Allergen BioCube has been validated for dust mites25 and timothy grass,26 shown to produce ragweed levels and subject responses comparable to those in the natural environment,15 and used to evaluate drug efficacy.27
Conclusion
This study provided technical and clinical validation of the Allergen BioCube for use in AR studies evaluating responses to ragweed exposure. The technical and clinical validation of the Allergen BioCube and other EEUs is key to their acceptance by regulatory agencies for potential expanded use in allergy studies.20,28
Author contributions
All authors were involved in the conception and design or analysis and interpretation of data, as well as in revising the paper critically for important intellectual content. All authors have approved the final version of the paper for submission and agree to be accountable for all aspects of the work.
Disclosure
Paul J Gomes, Keith J Lane, Endri Angjeli, and Linda Stein are employees of Ora, Inc. Mark B Abelson is Founder and Chief Scientific Officer of Ora, Inc. The authors report no other conflicts of interest in this work.
References
Ozdoganoglu T, Songu M. The burden of allergic rhinitis and asthma. Ther Adv Respir Dis. 2012;6(1):11–23. | ||
Brozek J, Bousquet J, Baena-Cagnani C, et al. Allergic rhinitis and its impact on asthma (ARIA) guidelines: 2010 revision. J Allergy Clin Immunol. 2010;126(3):466–476. | ||
Day J, Ellis A, Rafeiro E, Ratz J, Briscoe M. Experimental models for the evaluation of treatment of allergic rhinitis. Ann Allergy Asthma Immunol. 2006;96:263–278. | ||
Day J, Brisco M. Environmental exposure unit: a system to test anti-allergic treatment. Ann Allergy Asthma Immunol. 1999;83:83–93. | ||
Horak F, Jager S. The Vienna challenge chamber (VCC) – a new method for allergen exposition tests. Wein Klin Wocheschr. 1987;99:509–510. | ||
Rønborg SM, Mosbech H, Johnsen CR, Poulsen LK. Exposure chamber for allergen challenge. The development and validation of a new concept. Allergy 1996;51:82–88. | ||
Krug N, Hohlfeld J, Larbig M, et al. Validation of an environmental exposure unit for controlled human inhalation studies with grass pollen in patients with seasonal allergic rhinitis. Clin Exp Allergy. 2003;33:1667–1674. | ||
Zuberbier T, Abelson MB, Akdis CA. Validation of the GA²LEN chamber for trials in allergy. Innovation of a mobile allergen exposure chamber. J Allergy Clin Immunol. Epub September 30, 2016. | ||
Hashiguchi K, Tang H, Fujita T, et al. Validation study of the OHIO chamber in patients with Japanese cedar pollinosis. Int Arch Allergy Immunol. 2009;149:141–149. | ||
Enomoto T, Ide T, Ogino S. Construction of an environmental exposure unit and investigation of the effects of cetirizine hydrochloride on symptoms of cedar pollinosis in Japan. J Investig Allergol Clin Immunol. 2007;17:173–181. | ||
Ito K, Terada T, Yuki A, et al. Preliminary study of a challenge test to the patients with Japanese cedar pollinosis using an environmental exposure unit. Auris Nasus Larynx. 2010;37:694–699. | ||
Patel P, D’Andrea C, Sacks HJ. Onset of action of azelastine nasal spray compared with mometasone nasal spray and placebo in subjects with seasonal allergic rhinitis evaluated in an environmental exposure chamber. Am J Rhinol. 2007;21:499–503. | ||
Karsh J, Kelly S, Yang J, Perrins R, Yanget W. Clinical evaluation of an allergen Challenge TheatreTM. Allergy Asthma Clin Immunol. 2014;10(Suppl 2):A21. | ||
Berkowitz RB, Woodworth GG, Lutz C, et al. Onset of action, efficacy, and safety of fexofenadine 60 mg/pseudoephedrine 120 mg versus placebo in the Atlanta allergen exposure unit. Ann Allergy Asthma Immunol. 2002;89:38–45. | ||
Abelson MB, Gomes P, Lane K, Arenas N. Signs and symptoms of allergic rhinitis produced by the Allergen BioCube compared to the environment: a validation study. J Allergy Clin Immunol. 2011;127(2):AB253. | ||
Jacobs RL, Ramirez DA, Andrews CP. Validation of the biogenics research chamber for Juniperus ashei (mountain cedar) pollen. Ann Allergy Asthma Immunol. 2011;107:133–138. | ||
Ellis A, North M, Walker T, Steacy L. Environmental exposure unit: a sensitive, specific, and reproducible methodology for allergen challenge. Ann Allery Asthma Immunol. 2013;111:323–328. | ||
US Food and Drug Administration (FDA), Center for Drug Evaluation and Research. Guidance for Industry, Allergic Rhinitis: Clinical Development Programs for Drug Products, Draft Guidance. Rockville, MD; FDA; 2000. | ||
European Medicines Agency (EMA). Guideline on the Clinical Development of Products for Specific Immunotherapy for the Treatment of Allergic Diseases. London: EMA; 2008. | ||
US Food and Drug Administration (FDA), Center for Biologics Evaluation and Research. Allergenic Products Advisory Committee (meeting), May 12, 2011. Unedited transcript, p. 150. | ||
Rosner-Friese K, Kaul S, Vieths S, Pfaar O. Environmental exposure chambers in allergen immunotherapy trials: current status and clinical validation needs. J Allergy Clin Immunol. 2014;135(3):636–643. | ||
North M, Soliman M, Walker T, Steacy L, Ellis A. Controlled allergen challenge facilities and their unique contributions to allergic rhinitis research. Curr Allergy Asthma Rep. 2015;15:11. | ||
Zieglmayer P. Are results of environmental exposure units transferable to real-life exposure? Curr Opin Allergy Clin Immunol. 2013;13:244–248. | ||
Bernstein J. Correlation between a pollen challenge chamber and a natural allergen exposure study design for eliciting ocular and nasal symptoms: early evidence supporting a paradigm shift in drug investigation? J Allergy Clin Immunol. 2012;130:128–129. | ||
Lane K, Gomes P, Angjeli E, Ellis A. Uniformed distribution of aerosolized dust mite allergen in the Allergen BioCube (ABC). J Allergy Clin Immunol. 2014;133(2):AB189. | ||
Angjeli E, Lane K, Schoemmell E, Raval Y, Gomes P. Validation and verification of grass allergen challenge in the Allergen BioCube® (ABC). J Allergy Clin Immunol. 2016; 137(2 Suppl):AB262. | ||
Viirre E, Villafranca JE, Miller SD, Gomes P, Lasser E. Contrast agent reduces allergic rhinitis symptoms. J Allergy Clin Immunol. 2016;137(2):AB857. | ||
Togias A. Environmental exposure units: clinical trial design for validation. Bethesda, MD: National Institute for Allergy and Infectious Diseases/National Institutes of Health; 2010:1–12. |
 © 2016 The Author(s). This work is published and licensed by Dove Medical Press Limited. The
full terms of this license are available at https://www.dovepress.com/terms
and incorporate the Creative Commons Attribution
- Non Commercial (unported, 3.0) License.
By accessing the work you hereby accept the Terms. Non-commercial uses of the work are permitted
without any further permission from Dove Medical Press Limited, provided the work is properly
attributed. For permission for commercial use of this work, please see paragraphs 4.2 and 5 of our Terms.
© 2016 The Author(s). This work is published and licensed by Dove Medical Press Limited. The
full terms of this license are available at https://www.dovepress.com/terms
and incorporate the Creative Commons Attribution
- Non Commercial (unported, 3.0) License.
By accessing the work you hereby accept the Terms. Non-commercial uses of the work are permitted
without any further permission from Dove Medical Press Limited, provided the work is properly
attributed. For permission for commercial use of this work, please see paragraphs 4.2 and 5 of our Terms.