Back to Journals » OncoTargets and Therapy » Volume 12
TCTP promotes epithelial–mesenchymal transition in lung adenocarcinoma
Authors Sun R, Lu X, Gong L, Jin F
Received 19 August 2018
Accepted for publication 24 January 2019
Published 27 February 2019 Volume 2019:12 Pages 1641—1653
DOI https://doi.org/10.2147/OTT.S184555
Checked for plagiarism Yes
Review by Single anonymous peer review
Peer reviewer comments 2
Editor who approved publication: Dr Sanjeev K. Srivastava
Ruilin Sun,1 Xi Lu,1 Li Gong,2 Faguang Jin1
1Department of Respiratory Medicine, The Second Affiliated Hospital of Air Force Medical University, Xi’an, People’s Republic of China; 2Department of Pathology, The Second Affiliated Hospital of Air Force Medical University, Xi’an, People’s Republic of China
Background: Lung cancer is the most common and lethal malignancy worldwide. TCTP is highly expressed in various cancers including lung cancer. Epithelial–mesenchymal transition (EMT) could increase cancer cell invasion. Whether TCTP’s expression is associated with EMT in lung adenocarcinoma is largely unknown.
Methods: Several Gene Expression Omnibus datasets were used to analyze the correlation between TCTP expression and overall survival of lung adenocarcinoma patients by Kaplan–Meier survival analysis. Then, 24 surgically removed fresh lung adenocarcinoma tissue samples and paired paracancer tissue samples were used to analyze the correlation between TCTP expression and tumor stage by immunohistochemical analysis. Furthermore, stable cell lines were generated using lentiviral transduction systems to knock down or overexpress TCTP in A549 cells. Cell migration and invasion were measured by scratch and transwell assays, and EMT marker proteins such as α-SMA, ZEB1, and E-cadherin were quantitated by Western blot. The expression levels of miR-200a, miR-141, and miR-429 were determined by real-time quantitative PCR, and their target genes were predicted by an online database miRTarBase. The interaction between TCTP and these genes was analyzed by String database and visualized by Cytoscape.
Results: TCTP was highly expressed in tumor tissues compared to paracancer tissues. The expression of TCTP was associated with shorter overall survival. TCTP knockdown experiment in A549 cells suggested that TCTP knockdown could decrease the migration and invasion of lung cancer cells, and the expression level of ZEB1 and α-SMA, but increase the expression of E-cadherin and p53. Vice versa, overexpression of TCTP could increase the migration and invasion of cancer cells, and the expression level of ZEB1 and α-SMA, but decrease the expression of E-cadherin and p53. Furthermore, we found the expression of miR-200a, miR-141, and miR-429 was associated with TCTP expression.
Conclusion: TCTP promotes EMT in lung adenocarcinoma, and this effect may be associated with miR-200 family members like miR-200a, miR-141, and miR-429.
Keywords: TCTP, lung adenocarcinoma, epithelial–mesenchymal transition, miR-200
Background
Lung cancer is the most common cause of cancer-related deaths worldwide, with an estimated 1.6 million deaths each year. Non-small-cell lung cancer (NSCLC) accounts for about 80% of all lung cancers, including lung adenocarcinoma and lung squamous cell carcinoma. NSCLC is the leading cause of cancer-related deaths among men and the second leading cause of cancer-related deaths among women worldwide.1 Substantial progression has been made over the past 20 years with the advent of various targeted therapies and the effective application of immunotherapy in some advanced NSCLC patients.2 However, the overall cure and survival rates for NSCLC remain low, particularly for metastatic disease. Therefore, better predictors of patient responses as well as lung cancer aggressiveness are needed for the development of new therapies.2,3
Epithelial–mesenchymal transition (EMT) is a pivotal biological process that allows a well-polarized epithelial cell, which is immotile and normally interacts with the basement membrane, to undergo multiple biochemical changes and acquire mesenchymal cell phenotypes. This transition allows cancer cells to gain the ability to pass through the basement membrane and achieve increased invasive ability. Meanwhile, EMT could elevate resistance to apoptosis and promote inflammatory process. Moreover, it is closely related to cancer progression.4,5 EMT is characterized by the following molecular events: 1) downregulation of epithelial differentiation makers such as E-cadherin, 2) upregulation of EMT-induced gene (E-cadherin inhibitor) ZEB1/2, and 3) upregulation of the mesenchymal maker α-SMA.
TCTP is a highly conserved protein involved in cell proliferation and growth, tumorigenesis, apoptosis, pluripotency, and cell cycle regulation.6 In addition, TCTP is a regulator of tumor reversion that modulates a key regulator of apoptosis and tumor suppression (p53) and alters breast cancer stem-like cell activity.7 High expression of TCTP has been found in different types of cancers, for instance, colorectal carcinoma, prostatic carcinoma, breast carcinoma, liver cancer, and glioma. Previous studies have shown that TCTP interacts with ATM and p53 proteins, two major early mediators of DNA damage sensing.8 TCTP could downregulate p53, and thus inhibit tumor cell apoptosis. On the other hand, as an inhibitor of miR-200c, p53 could bind to the promoter region of miR-200c.9,10
The miR-200 family has been recognized as a main suppressor of EMT by targeting ZEB1. Gregory et al found that all five members of the miR-200 family (miR-200a, miR-200b, miR-200c, miR-141, and miR-429) and miR-205 were markedly downregulated in cells that had undergone EMT. Enforced expression of the miR-200 family alone was sufficient to prevent TGF-β-induced EMT.10,11 Thus, downregulation of the miR-200s may be an important step in tumor progression. Nishijima et al showed that retention of the epithelial phenotype with high levels of miR-200 family ensured good sensitivity to nintedanib in NSCLC cells.12 In addition, induction of miR-200b and miR-141 showed reversal of EMT and increased sensitivity for nintedanib in naturally resistant A549 cells. Therefore, regulating miR-200 family may help control tumor progression.
TCTP was found significantly increased in the plasmas and cancerous tissues from lung cancer patients; however, the role of TCTP in EMT process of lung cancer is still not clear. In this study, TCTP protein levels in 24 paired lung adenocarcinoma tissues were determined and the effect of TCTP on the EMT of lung adenocarcinoma A549 cells was investigated. We found that TCTP expression in mammary epithelial cells correlated with cancer progression, TCTP knockdown inhibited development of EMT, and TCTP regulated EMT which might be the result of interaction of TCTP with p53 and miR-200a, miR-141, and miR-429.
Methods
Sample collection
The study was approved by The Second Affiliated Hospital of Air Force Medical University. The study was conducted in accordance with the Declaration of Helsinki. Written informed consent was obtained from all patients, and the study protocol was approved by the Ethics Committee. Fresh tumor samples were snap-frozen and stored in liquid nitrogen until experimental use. These samples were obtained from 24 patients during the initial lung cancer surgery at The Second Affiliated Hospital of Air Force Medical University. Patients did not receive any treatment prior to surgery. The relevant proteins in fresh tumor samples were determined by Western blot analysis. Paraformaldehyde-fixed samples were assessed by immunohistochemistry. The clinicopathological features of patients including age, clinical manifestations, gender, race, cigarette smoking history, and stage at diagnosis were prospectively collected.
Cell culture and construction of TCTP-silenced and TCTP-overexpressing A549 cells
The human lung cancer cell line A549 (KRAS mutant) was obtained from ATCC. The cells were cultured in DMEM (Thermo Fisher Scientific, Waltham, MA, USA) supplemented with 10% FBS (HyClone, Logan, UT, USA) at 37°C in a humidified atmosphere of 95% air and 5% CO2. TCTP-specific shRNA (target sequence, 5′-GAUGGUCAGUAGGACAGAA-3′) and non-targeting control (non-targeting sequence, 5′-UUCUCCGAACGUGUCACGU-3′) shRNA oligonucleotides were synthesized by TaKaRa. Cells were infected to overexpress TCTP as described previously with minor modifications.3
Lentiviral vectors expressing the transgene TCTP, which contained the GFP gene (Lv-TCTP-GFP), or empty vectors (Lv-GFP) were used to infect the A549 cells. When the multiplicity of infection was 10, A549 cells were co-cultured with Lv-TCTP-GFP or Lv-GFP at 37°C in a humidified atmosphere with 5% CO2 for 2 hours.
Lentiviruses were generated as described previously with minor modifications.3 Briefly, TCTP shRNA with pCDH, PMDG, PLP1, and PLP2 was co-transfected into HEK293FT cells with PEI (Sigma-Aldrich, St Louis, MO, USA). Viral particles were harvested at 48 and 72 hours and infected into cells in the presence of 10 mg/mL polybrene. Infected cells were selected with EGFP.
Scratch assay
Scratch wound healing assays were performed to assess the migration of cancer cells. Lv-TCTP-GFP, Lv-GFP, and Lv-shTCTP-GFP cells seeded in a 24-well plate were grown into a confluent monolayer. After the cells covered 90% of the bottom, a straight scratch was generated across the cell monolayer using a 200 μL pipette tip. The cells were washed twice with PBS to remove debris and then incubated at 37°C for 24 hours. Reference points were marked to ensure the same area was viewed during image acquisition, and the gap images were captured at 0, 12, and 24 hours post-scratching using an EVOS™ XL Imaging System (Thermo Fisher Scientific). The gap distances were measured by ImageJ Plus software (US National Institutes of Health). The migration rate was defined as the percentage of gap closure at the indicated period.
Transwell assay
Transwell assays were conducted to assess the invasiveness of tumor cells. Briefly, 10,000 cells in 200 μL serum-free medium were plated in the upper chamber of a transwell (Corning, Corning, NY, USA), and the upper porous membrane with a pore size of 8 μm was pre-coated with 40 μL matrigel (1.5 mg/mL; BD Biosciences). The lower chamber contained 800 μL DMEM supplemented with 30% FBS. The cells were allowed to migrate through the porous membrane for 24 hours at 37°C. Thereafter, the cells on the upper surface of the membrane were wiped off, and the cells on the lower surface of the membrane were fixed with 4% paraformaldehyde and stained with 0.5% (w/v) crystal violet (VWR International, Radnor, PA, USA) for 5 minutes. The numbers of invading cells were counted under an inverted microscope at ×200 magnification.
Western blot
For protein extraction, cultured cells were lysed with RIPA lysis buffer (MYbiotech, Xi’an, China) containing 1% (v/v) phenylmethanesulfonyl fluoride (Beyotime). Protein concentration was determined with a BCA assay kit (MYbiotech), and 40 μg proteins from each sample were subjected to SDS-PAGE. Subsequently, the separated proteins were transferred onto polyvinylidene difluoride membranes (Millipore, Bedford, MA, USA). After the membranes were blocked with 5% skim milk for 1 hour, they were incubated with primary antibodies against TCTP (Cat. No ab133568; Abcam, Cambridge, UK), E-cadherin (Cat. No ab1416, c), α-SMA (Cat. No ab7817; Abcam), ZEB1 (Cat. No ab203829; Abcam), and p53 (Cat. No ab26; Abcam) and Alexa Fluor 594-conjugated goat anti-rabbit IgG (Cat. No ab150116; Abcam). The relative content of the target protein was detected by an enhanced chemiluminescent detection system (TIANON, Shanghai, China) according to the manufacturer’s protocol.
Real-time quantitative PCR
Isolation of total RNA and miRNA was carried out by using a QIAGEN RNeasy Mini kit (Qiagen, Hilden, Germany) and a QIAGEN miRNeasy Mini Kit (Qiagen) according to the manufacturer’s instructions. Quantitative PCR analysis of miR-200a, miR-141, and miR-429 was carried out by using a Roche Light Cycler 96 (Roche) with SYBR Green PCR Master Mix (Clontech Laboratories, Inc.) according to the manufacturer’s protocol. The primers for real-time quantitative PCR used in the present study are listed in Table 1.
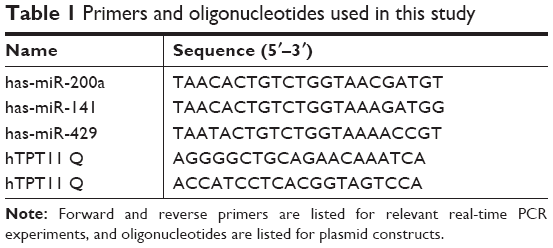 | Table 1 Primers and oligonucleotides used in this study |
Immunofluorescence staining
Cells were incubated for 24 hours and then fixed with 4% paraformaldehyde in PBS for 15 minutes at room temperature. For staining E-cadherin, cells were fixed with 100% acetone for 15 minutes at 4°C. After the cells were washed with PBS, they were permeabilized in 0.2% Triton X-100 in PBS and blocked in 1% BSA.
Cells were then stained with mouse monoclonal antibody and probed with Alexa Fluor 488- or 594-conjugated goat anti-mouse IgG (Thermo Fisher Scientific). Counterstaining with DAPI was performed by mounting in ProLong Gold antifade reagent (Thermo Fisher Scientific). Cells were photographed at ×400 magnification with a fluorescence confocal microscope (AF6000; Leica, Wetzlar, Germany).
Screening potential miRNA target genes and construction of protein–protein interaction network
Next, we retrieved potential target genes of miR-200a, miR-141, and miR-429 from miRTarBase (miRNA–target interactions database, release 7.0). miRTarBase is a manually collected, experimentally validated, and actively used database of miRNA targets. The selected target gene together with TPTC gene interaction network was then constructed by STRING database (version 10.5, https://string-db.org) and visualized by Cytoscape (vision 3.6.1).
Statistical analysis
All in vitro assays were performed three times. Data are expressed as mean ± SD. Multiple comparisons among groups were performed using one-way ANOVA followed by Bonferroni’s test. Significance was accepted at P<0.05.
Results
TCTP is upregulated in lung adenocarcinoma tissue samples and correlates with shorter overall survival
To evaluate the role of TCTP in human lung adenocarcinoma, we measured the expression levels of TCTP in 24 paired tumor tissues and their adjacent normal tissues by immunohistochemistry (Figure 1A and B), which showed TCTP protein levels in lung cancer tissues were increased approximately fourfold compared to adjacent tissues (P<0.001). Similar results were revealed by Western blot (Figure 1C and D), which showed TCTP expression was increased nearly sevenfold in tumor tissues (P<0.001). In addition, the transcriptional level of TCTP was measured by real-time PCR, which showed TCTP expression was increased significantly in tumor tissues (P=0.003) (Figure 1E). Thus, these results confirmed that TCTP expression is significantly upregulated in lung adenocarcinoma tissues.
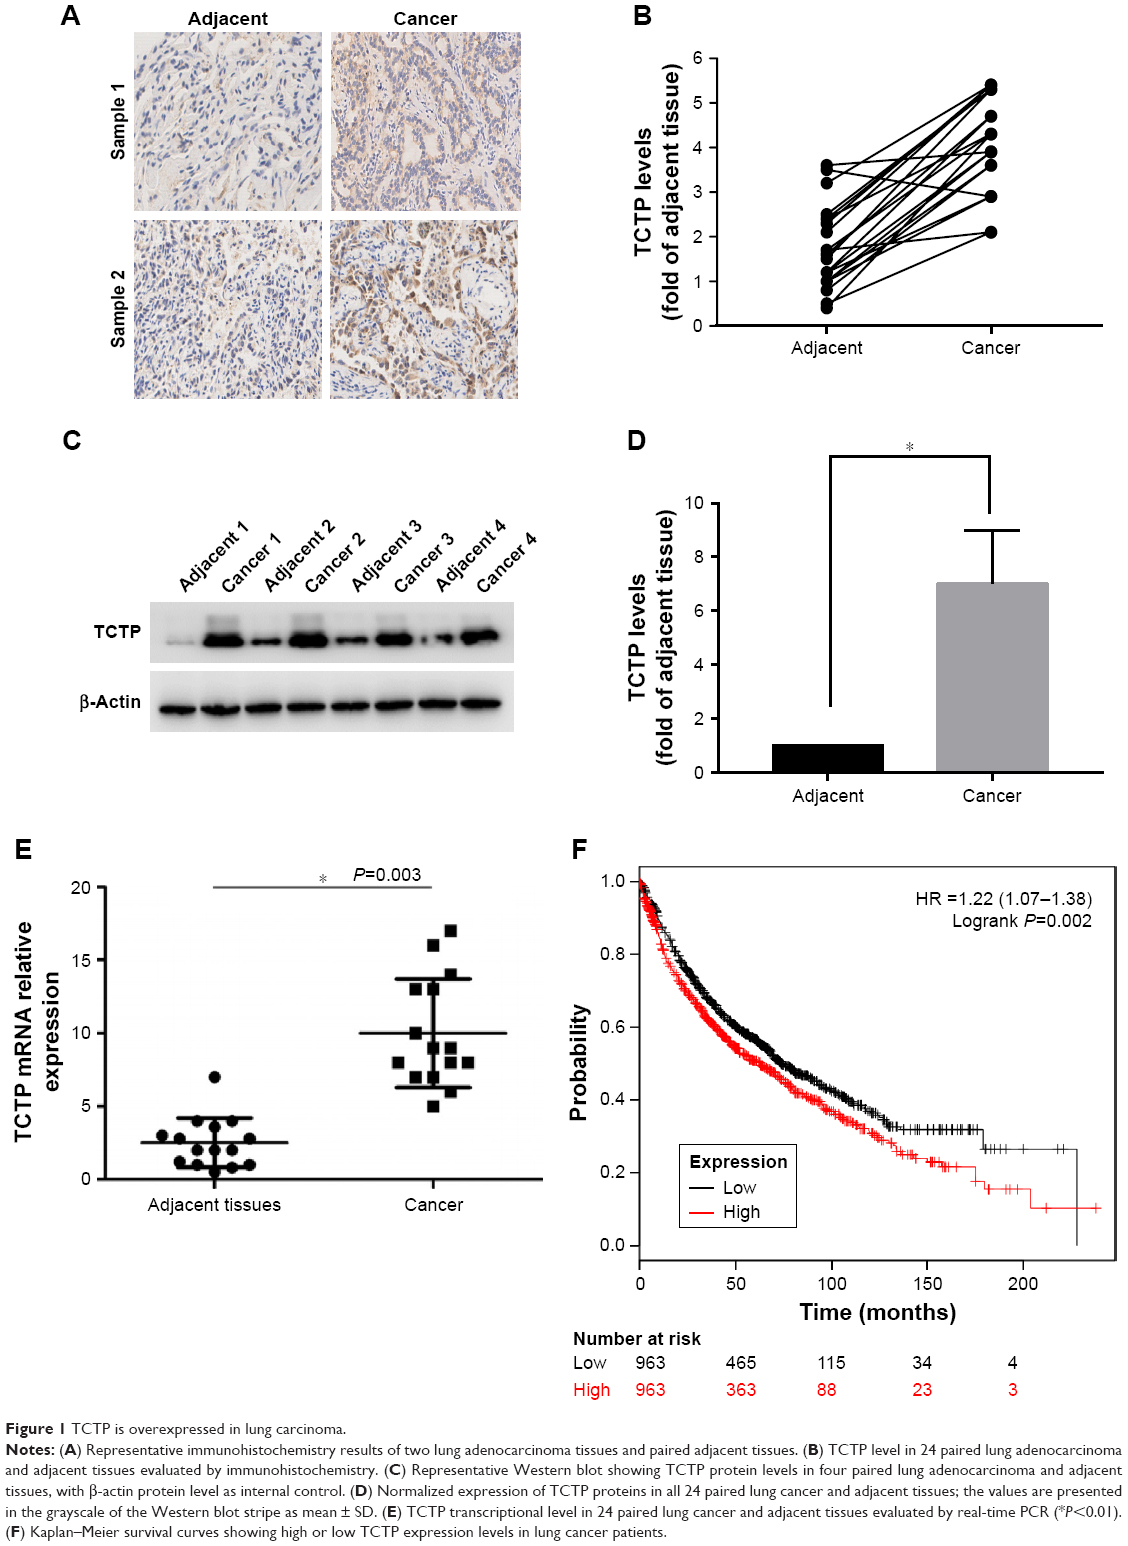 | Figure 1 TCTP is overexpressed in lung carcinoma. |
Furthermore, we examined the correlation between TCTP protein levels and various clinicopathological features of the 24 patients from whom tumor samples were collected in our hospital (Table 2). Age, gender, and smoking history did not show any significant correlation with TCTP protein levels. Interestingly, the protein levels of TCTP in high-grade (III–IV) lung adenocarcinoma tissues were significantly higher than those in low-grade (I–II) lung adenocarcinoma tissues (P=0.027), indicating that TCTP may function as an oncogene that promotes tumor development.
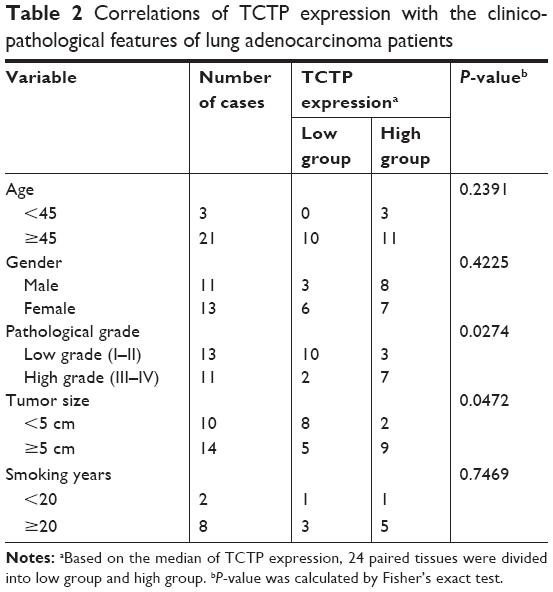 | Table 2 Correlations of TCTP expression with the clinicopathological features of lung adenocarcinoma patients |
A Kaplan–Meier analysis was performed to investigate the correlation of TCTP expression level with overall survival. The analysis was done using the online Kaplan–Meier plotter and the lung cancer database provided by the website (www.kmplot.com). We used 211943_x_at to stand for TCTP, and selected all the adenocarcinoma patients with overall survival data (n=720). The results showed that lung cancer patients with higher TCTP expression had a shorter overall survival rate compared to the patients with low TCTP expression (Figure 1F) (HR =1.8 (1.42–2.29), P<0.001), suggesting that the patients with higher TCTP expression levels have a higher risk of death from lung adenocarcinoma.
Silenced TCTP reverses EMT phenotypes and suppresses cell migration
We examined whether downregulation of TCTP could reverse EMT phenotypes and suppress migration of A549 cells. We depleted TCTP using lentivirus-delivered shRNA targeting TCTP (Lv-shTCTP) to infect A549 cells. All of the cells presented GFP-positive signals in both the Lv-shCon and Lv-shTCTP groups (Figure 2A). Western blot demonstrated that TCTP knockdown could affect the expression of epithelial and mesenchymal markers in A549 cells (Figure 2B and C). Similar results were obtained by real-time quantitative PCR (Figure S1). We observed an increase in the p53 expression (1.5±0.18 to 4.5±0.1, P<0.01) and epithelial marker E-cadherin (0.9±0.02 to 4.2±0.5, P<0.01), but a reduction in the mesenchymal markers ZEB1 (3.7±0.21 to 1.6±0.1, P<0.01) and α-SMA (6.2±0.12 to 1.1±0.4, P<0.01). Immunofluorescence staining also showed similar results (Figure 2D and E). These data indicated that downregulated TCTP could reverse EMT phenotypes. As we already indicated that tumor tissues expressed higher TCTP than adjacent normal tissues, we checked the expression of EMT markers in the 24 paired samples. As we expected, tumor samples showed higher expression of EMT markers ZEB1 and α-SMA (Figure S2).
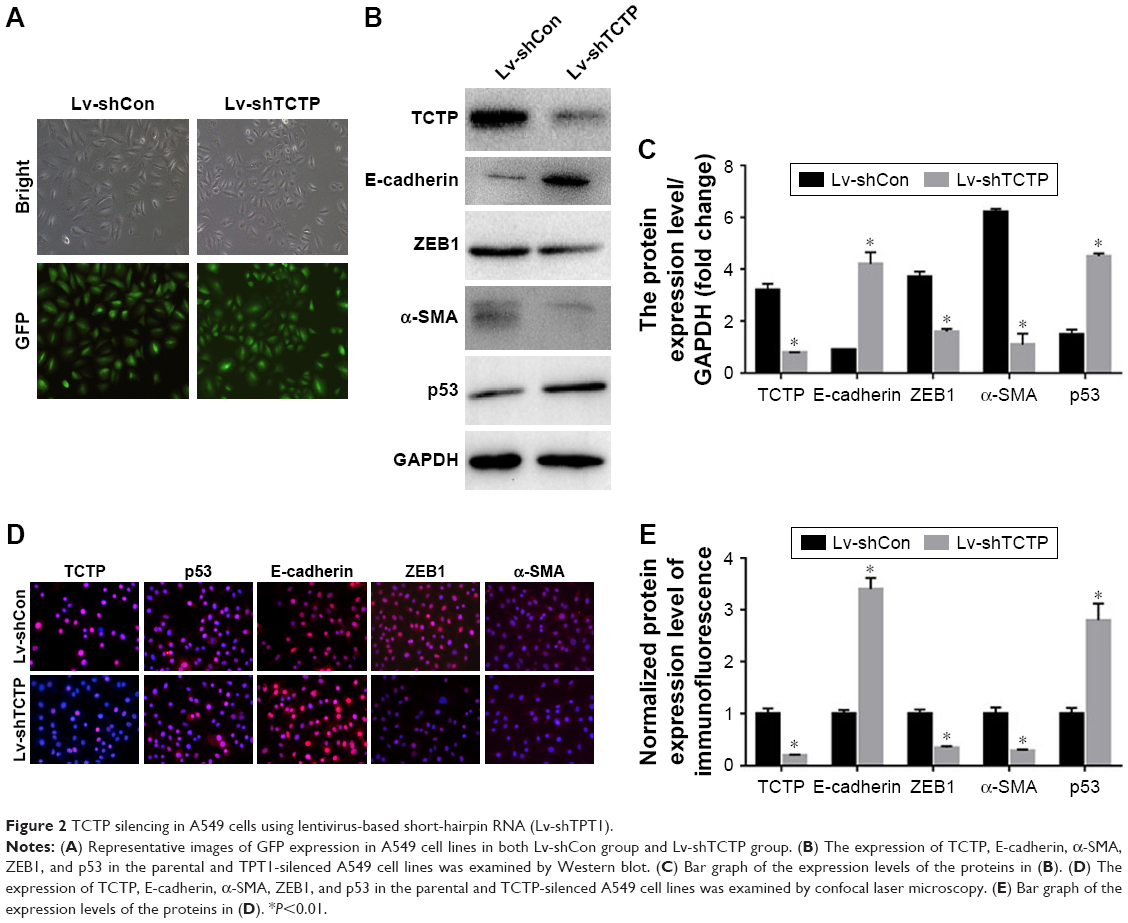 | Figure 2 TCTP silencing in A549 cells using lentivirus-based short-hairpin RNA (Lv-shTPT1). |
The motility and invasiveness of A549 cells were examined by scratch wound healing assays and matrigel-based transwell assays. In wound healing assays, the wound healing capacities of silencing of TCTP in A549 cells (Lv-shTCTP group) were significantly reduced compared to the control cells (Lv-shCon group) in 24 hours (0.59±0.07 vs 0.39±0.06, P<0.001) (Figure 3A and B), suggesting significantly decreased serum-induced directional migration. On the other hand, transwell migration assays revealed that the invasion capacity of TCTP-silenced cells was reduced to 67.5% (from 206±17.54 to 139±9.75, P<0.01) (Figure 3C and D). These findings clearly show that depletion of TCTP inhibits the development of mesenchymal-like phenotypes and invasion, confirming TCTP’s role in positively regulating EMT.
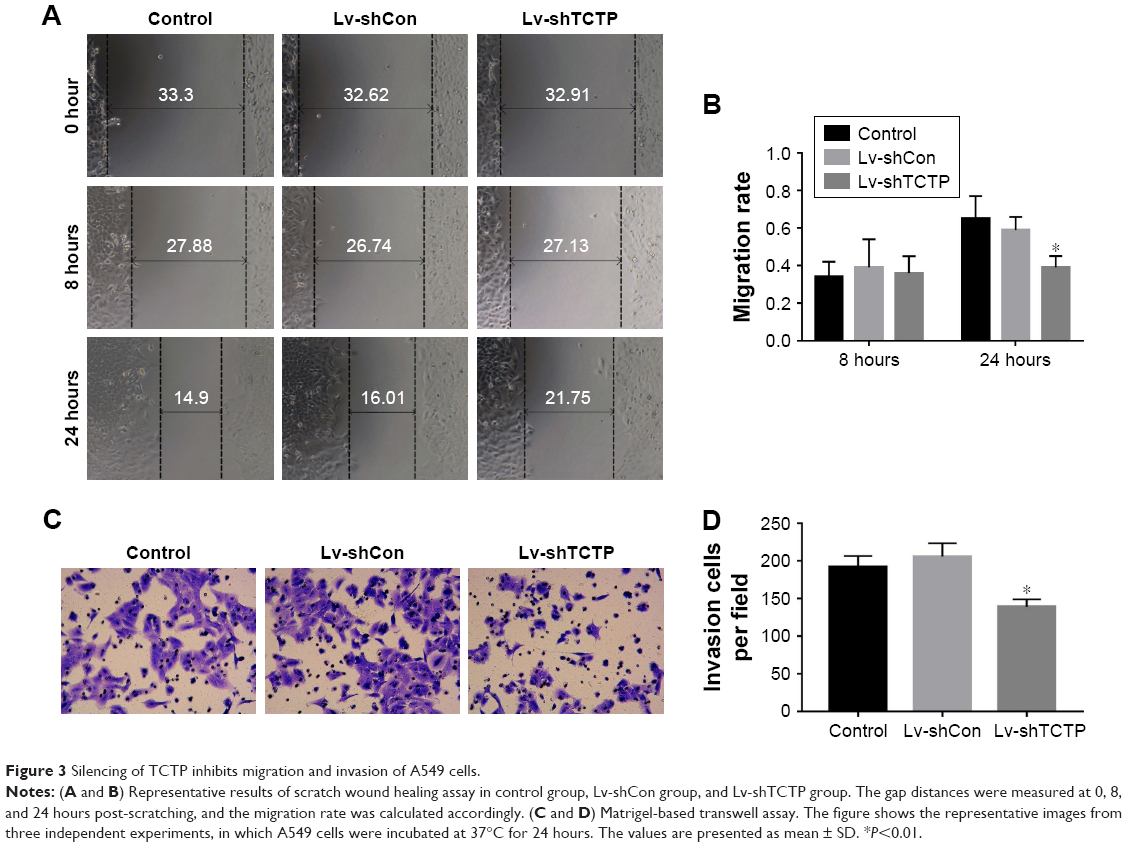 | Figure 3 Silencing of TCTP inhibits migration and invasion of A549 cells. |
Overexpression of TCTP enhances cell invasion and EMT phenotype
Next, we examined whether upregulation of TCTP can increase metastasis by inducing EMT. We overexpressed TCTP via a lentivirus vector in A549 cells. All of the cells presented GFP-positive signals in both the Lv-Con and Lv-TCTP groups (Figure 4A). The TCTP-overexpressing cells exhibited reduced expression of E-cadherin (from 1.2±0.11 to 0.7±0.02, P<0.01) and p53 (from 3.6±0.25 to 0.9±0.24, P<0.01), and increased expression of ZEB1 (from 1.1±0.09 to 5.2±0.51, P<0.01) and α-SMA (from 1.3±0.46 to 5.8±0.17, P<0.01) (Figure 4B and C). Similar results were shown by real-time quantitative PCR (Figure S3) and immunofluorescence staining (Figure 4D and E).
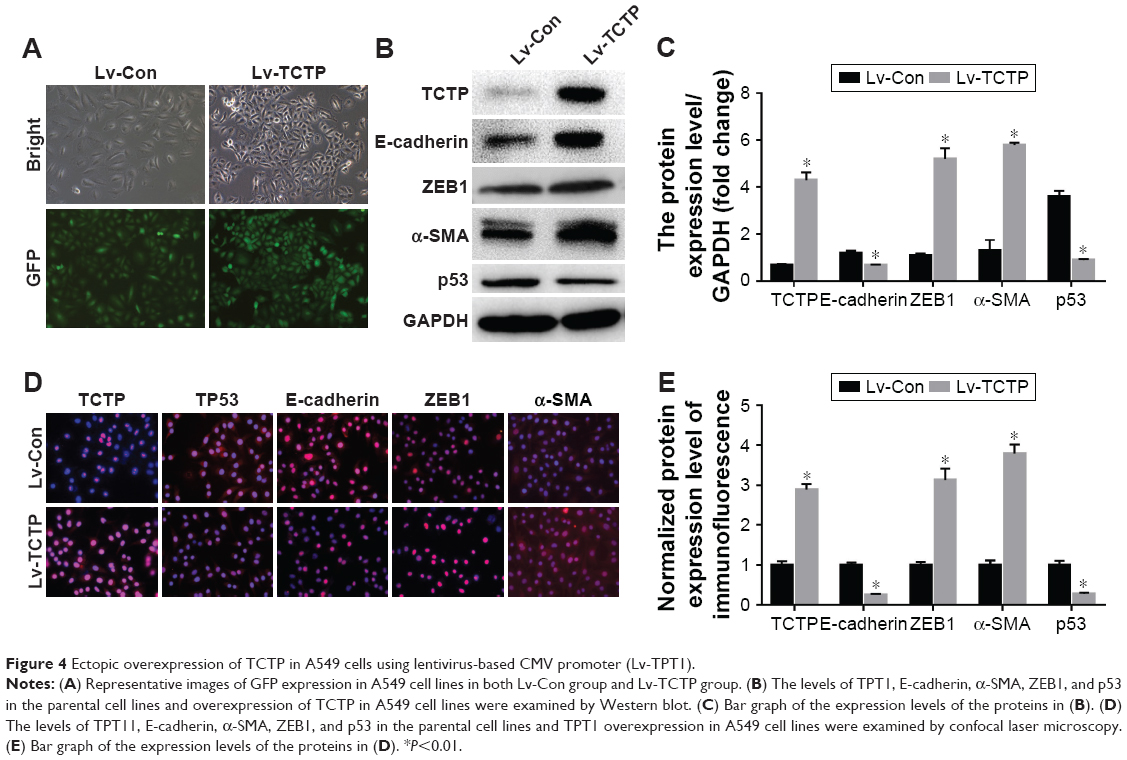 | Figure 4 Ectopic overexpression of TCTP in A549 cells using lentivirus-based CMV promoter (Lv-TPT1). |
TCTP-overexpressing A549 cells showed significantly increased wound healing capacities compared to the Lv-Con group in the scratch assay (0.72±0.05 vs 1.64±0.11 at 24 hours, P<0.001) (Figure 5A and B). Transwell assays demonstrated that invasion of the TCTP-overexpressing cells increased compared with that of the corresponding control cells (216±10.73 vs 344±15.96 at 24 hours, P<0.001) (Figure 5C and D). These results indicated that TCTP overexpression can promote EMT and cell migration and invasion.
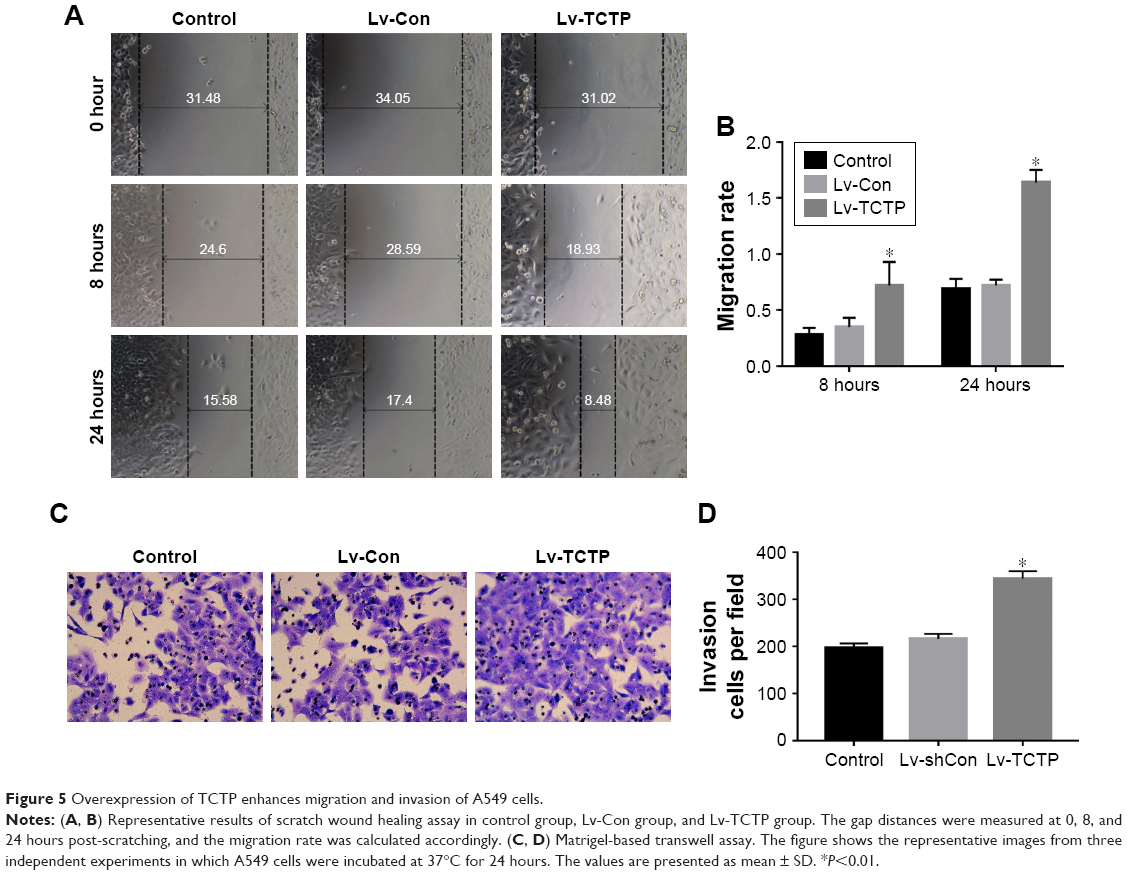 | Figure 5 Overexpression of TCTP enhances migration and invasion of A549 cells. |
miR-200a, miR-141, and miR-429 expression is associated with TCTP
Some previous researches have reported the role of miR-200a, miR-141, and miR-429 in EMT and mesenchymal–epithelial transition (MET).13 We suspected whether TCTP has some association with these miRNAs. Therefore, we measured the expression levels of miR-200a, miR-141, and miR-429 in TCTP-depleted and TCTP-overexpressing A549 cells. The results showed that all the three miRNAs were downregulated in TCTP-overexpressing cells and upregulated in TCTP-depleted cells (Figure 6A). We also checked the expression of miR-200a, miR-141, and miR-429 in the 24 paired samples. As expected, the expression of these three miRNAs was significantly lower in tumor tissues compared with adjacent normal tissues (Figure S4).
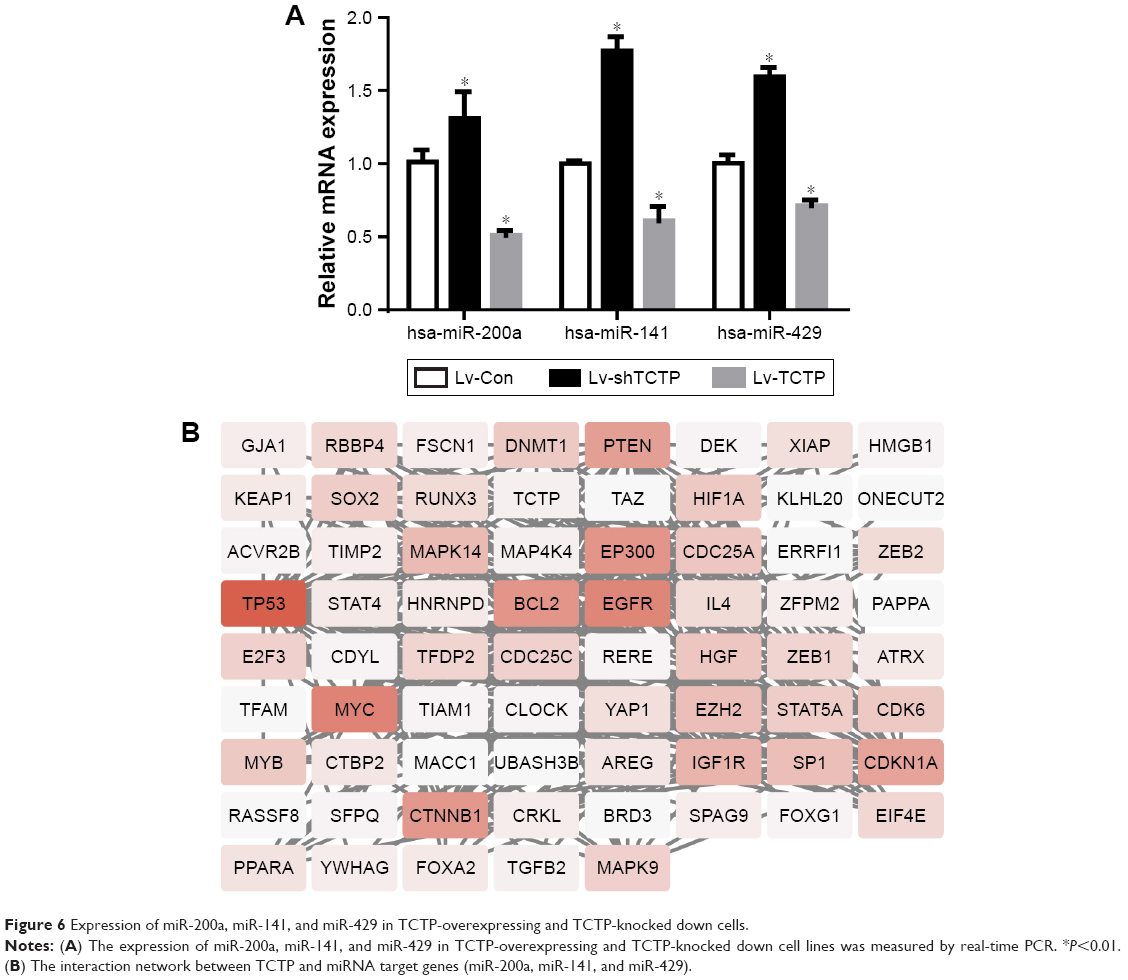 | Figure 6 Expression of miR-200a, miR-141, and miR-429 in TCTP-overexpressing and TCTP-knocked down cells. |
We predicted the target genes of miR-200a, miR-141, and miR-429 through an online database, miRTarBase. Ninety-nine target genes supported by strong experimental evidence (Western blot) were selected for further analysis (Figure 6B). Just as we expected, p53 and ZEB1 were in the list of target genes. In order to illustrate the interaction between TPT1, p53, ZEB1, and miR-200a, miR-141, and miR-429, we loaded the sequences of TCTP and all the 99 genes into String protein interaction database. TCTP was found to have a direct interaction with p53, but no direct interaction with ZEB1 (Figure 6B).
Together, these evidence suggest that TCTP expression plays a important role in lung adenocarcinoma. In addition, TCTP function is associated with the expression of ZEB1 and α-SMA, in turn suggesting an association with enhanced EMT. TCTP also interacts with miR-200a, miR-141, and miR-429. Thus, it is clear that TCTP has no direct interaction with EMT, but regulates EMT through p53 which is the target gene of the abovementioned miRNAs (Figure 7).
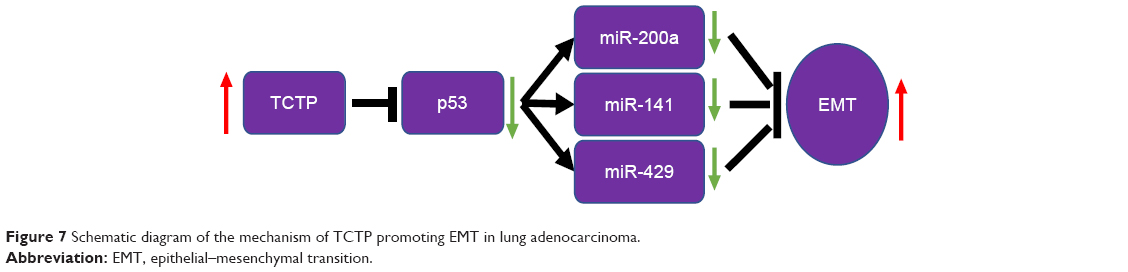 | Figure 7 Schematic diagram of the mechanism of TCTP promoting EMT in lung adenocarcinoma. |
Discussion
TCTP was first cloned in the Ehrlich ascites tumor cell line.5 This gene is widely present in various organisms and plays a key role in the growth and development of various organisms. TCTP expression is associated with an array of different biological activities, such as the cell cycle,14 apoptosis,15–17 cytoskeleton organization,18 protein synthesis,19 immune responses, development,20,21 and cancer.22 Previous studies have shown that TCTP is highly expressed in various human neoplasms.22,23 In this study, we demonstrated that TCTP protein levels in lung cancer tissues were significantly higher than those in adjacent tissues. These findings indicate that TCTP may play a role in the development of lung adenocarcinoma. In the Kaplan–Meier survival analysis, the overall survival of patients with high TCTP expression was significantly shorter than that of patients with low TCTP expression. Univariate Cox analysis showed that increased expression of TCTP in lung cancer tissues was significantly associated with shorter overall survival. Thus, TCTP may serve as a new prognostic indicator of lung cancer.
EMT plays an essential role in cancer metastasis, and restoration of the MET program should efficiently slow dissemination of tumor cells.24 EMT triggers the cessation of migration, inducing the same cell to proliferate and seed the new tumor.6 Many molecules have been shown to mediate EMT by inducing the expression of specific transcription factors, such as TWIST, SNAIL, and ZEB1. Many of these molecules decrease the expression of E-cadherin and induce the epithelial and mesenchymal markers fibronectin and N-cadherin.25 Some studies also researched the relationship between miR-200a, miR-141, and miR-429 and EMT in colorectal cancer, oral squamous cell carcinoma, and NSCLC,12,13,26 but seldom focused on the relationship between TCTP and the miRNAs of miR-200 family.
TCTP was shown to promote the degradation of the tumor suppressor p53 in lung cancer cells.20 Amson et al further revealed that TCTP promoted p53 degradation by competing with NUMB for binding to p53-MDM2 complexes.7 TCTP inhibits p53 and has been suggested to be a marker of EMT; furthermore, p53 protein regulates EMT and stem cell properties through modulating miRNAs.9 To determine whether the action of TCTP on the p53–miR-200 axis directly regulates the EMT process, we constructed lentiviral vectors overexpressing TCTP and silencing TCTP in A549 cells. TPT1-depleted cells exhibited the following characteristics: elevated expression of p53 and E-cadherin, changes in epithelial and mesenchymal markers, decreased expression of α-SMA and ZEB1, significantly decreased serum-induced directional migration and invasion, and significantly elevated miR-200s expression level compared to that of control A549 cells. Together, our results suggest that TCTP increased ZEB1, and this effect may be associated with the miR-200 family (Figure 6). Previous research found that TCTP enhances A549 cell EMT through ubiquitination and degradation. However, whether the interaction of TCTP and p53 regulates EMT through downstream factors was unclear. Our results suggest that the TCTP–p53–miR-200s pathway most likely accounts for regulating EMT, and activation of the TCTP–p53–miR-200s regulatory axis may serve as a therapeutic alternative for targeting EMT-associated tumor-initiating cells. Our data also indicate that silencing of TCTP inhibits growth, migration, and invasion of lung cancer cells. Thus, TCTP may be a potential target for lung cancer therapy.
Acknowledgment
This study was supported by Key Research and Development Plan of Shaanxi Province China (Grant No 2017ZDL-SF-14-6).
Author contributions
All authors made substantial contributions to conception and design, acquisition of data, or analysis and interpretation of data; took part in drafting the article or revising it critically for important intellectual content; gave final approval of the version to be published; and agree to be accountable for all aspects of the work.
Disclosure
The authors report no conflicts of interest in this work.
References
Torre LA, Bray F, Siegel RL, Ferlay J, Lortet-Tieulent J, Jemal A. Global Cancer statistics, 2012. CA Cancer J Clin. 2015;65(2):87–108. | ||
Herbst RS, Morgensztern D, Boshoff C. The biology and management of non-small cell lung cancer. Nature. 2018;553(7689):446–454. | ||
Wang L, Tang Y, Zhao M, et al. Knockdown of translationally controlled tumor protein inhibits growth, migration and invasion of lung cancer cells. Life Sci. 2018;193:292–299. | ||
Thiery JP, Sleeman JP. Complex networks orchestrate epithelial-mesenchymal transitions. Nat Rev Mol Cell Biol. 2006;7(2):131–142. | ||
Kalluri R, Weinberg RA. The basics of epithelial-mesenchymal transition. J Clin Invest. 2009;119(6):1420–1428. | ||
Bae SY, Kim HJ, Lee KJ, Lee K. Translationally controlled tumor protein induces epithelial to mesenchymal transition and promotes cell migration, invasion and metastasis. Sci Rep. 2015;5(1):8061. | ||
Amson R, Pece S, Lespagnol A, et al. Reciprocal repression between p53 and TCTP. Nat Med. 2012;18(1):91–99. | ||
Zhang J, de Toledo SM, Pandey BN, et al. Role of the translationally controlled tumor protein in DNA damage sensing and repair. Proc Natl Acad Sci U S A. 2012;109(16):E926–E933. | ||
Chang CJ, Chao CH, Xia W, et al. P53 regulates epithelial-mesenchymal transition and stem cell properties through modulating miRNAs. Nat Cell Biol. 2011;13(3):317–323. | ||
Gregory PA, Bert AG, Paterson EL, et al. The miR-200 family and MIR-205 regulate epithelial to mesenchymal transition by targeting ZEB1 and SIP1. Nat Cell Biol. 2008;10(5):593–601. | ||
Spaderna S, Brabletz T, Opitz OG. The miR-200 family: central player for gain and loss of the epithelial phenotype. Gastroenterology. 2009;136(5):1835–1837. | ||
Nishijima N, Seike M, Soeno C, et al. miR-200/ZEB axis regulates sensitivity to nintedanib in non-small cell lung cancer cells. Int J Oncol. 2016;48(3):937–944. | ||
Arunkumar G, Deva Magendhra Rao AK, Manikandan M, et al. Dysregulation of miR-200 family microRNAs and epithelial-mesenchymal transition markers in oral squamous cell carcinoma. Oncol Lett. 2018;15(1):649–657. | ||
Brioudes F, Thierry AM, Chambrier P, Mollereau B, Bendahmane M. Translationally controlled tumor protein is a conserved mitotic growth integrator in animals and plants. Proc Natl Acad Sci U S A. 2010;107(37):16384–16389. | ||
Tuynder M, Fiucci G, Prieur S, et al. Translationally controlled tumor protein is a target of tumor reversion. Proc Natl Acad Sci U S A. 2004;101(43):15364–15369. | ||
Li F, Zhang D, Fujise K. Characterization of fortilin, a novel antiapoptotic protein. J Biol Chem. 2001;276(50):47542–47549. | ||
Liu H, Peng HW, Cheng YS, Yuan HS, Yang-Yen HF. Stabilization and enhancement of the antiapoptotic activity of Mcl-1 by TCTP. Mol Cell Biol. 2005;25(8):3117–3126. | ||
Tsarova K, Yarmola EG, Bubb MR. Identification of a cofilin-like actin-binding site on translationally controlled tumor protein (TCTP). FEBS Lett. 2010;584(23):4756–4760. | ||
Cans C, Passer BJ, Shalak V, et al. Translationally controlled tumor protein acts as a guanine nucleotide dissociation inhibitor on the translation elongation factor eEF1A. Proc Natl Acad Sci U S A. 2003;100(24):13892–13897. | ||
Rho SB, Lee JH, Park MS, et al. Anti-apoptotic protein TCTP controls the stability of the tumor suppressor p53. FEBS Lett. 2011;585(1):29–35. | ||
Hsu YC, Chern JJ, Cai Y, Liu M, Choi KW. Drosophila TCTP is essential for growth and proliferation through regulation of dRheb GTPase. Nature. 2007;445(7129):785–788. | ||
Wu D, Guo Z, Min W, et al. Upregulation of TCTP expression in human skin squamous cell carcinoma increases tumor cell viability through anti-apoptotic action of the protein. Exp Ther Med. 2012;3(3):437–442. | ||
Baylot V, Katsogiannou M, Andrieu C, et al. Targeting TCTP as a new therapeutic strategy in castration-resistant prostate cancer. Mol Ther. 2012;20(12):2244–2256. | ||
Ye X, Weinberg RA. Epithelial-mesenchymal plasticity: a central regulator of cancer progression. Trends Cell Biol. 2015;25(11):675–686. | ||
Nieto MA, Huang RY, Jackson RA, Thiery JP. EMT: 2016. Cell. 2016;166(1):21–45. | ||
O’Brien SJ, Carter JV, Burton JF, et al. The role of the miR-200 family in epithelial-mesenchymal transition in colorectal cancer: a systematic review. Int J Cancer. 2018;142(12):2501–2511. |
Supplementary materials
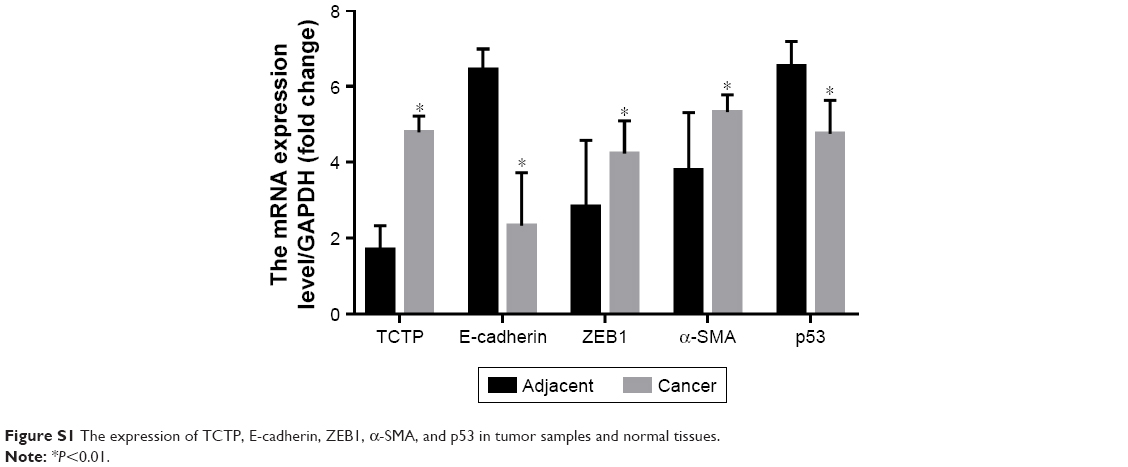 | Figure S1 The expression of TCTP, E-cadherin, ZEB1, α-SMA, and p53 in tumor samples and normal tissues. |
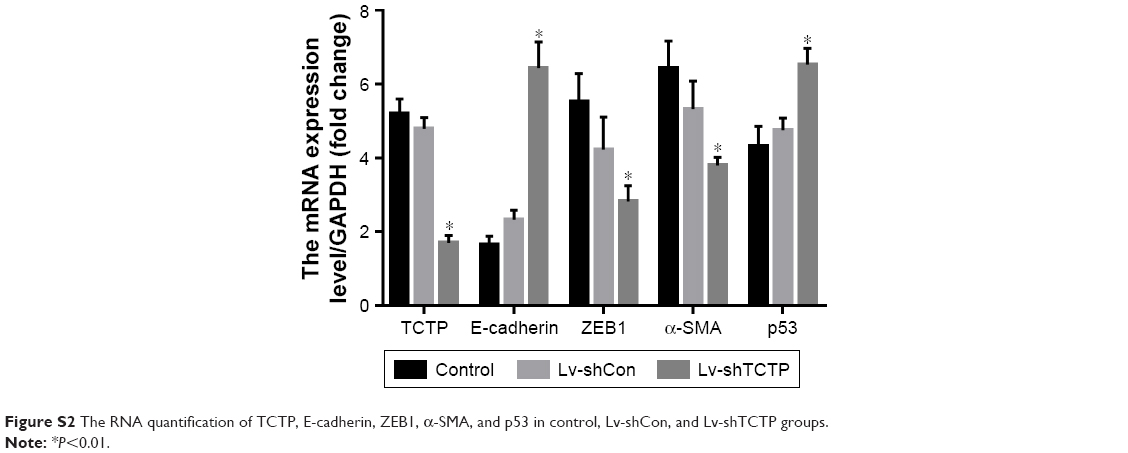 | Figure S2 The RNA quantification of TCTP, E-cadherin, ZEB1, α-SMA, and p53 in control, Lv-shCon, and Lv-shTCTP groups. |
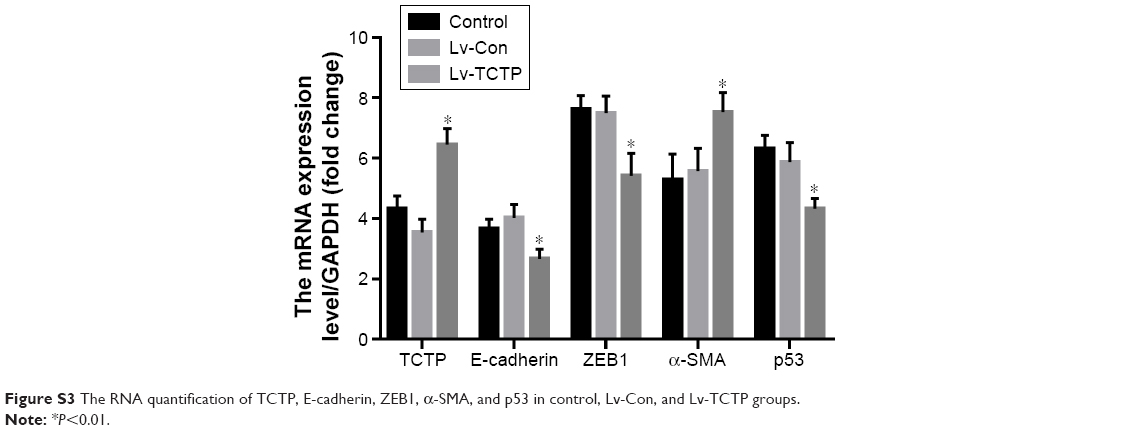 | Figure S3 The RNA quantification of TCTP, E-cadherin, ZEB1, α-SMA, and p53 in control, Lv-Con, and Lv-TCTP groups. |
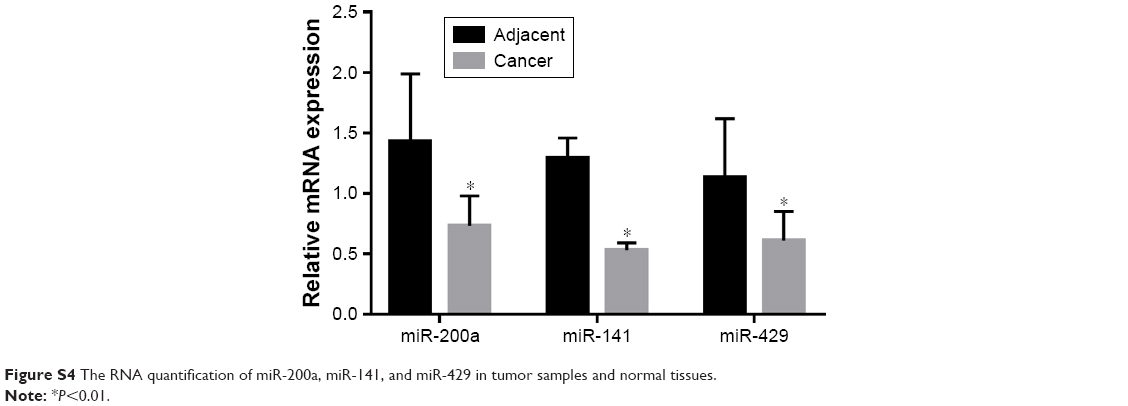 | Figure S4 The RNA quantification of miR-200a, miR-141, and miR-429 in tumor samples and normal tissues. |
 © 2019 The Author(s). This work is published and licensed by Dove Medical Press Limited. The
full terms of this license are available at https://www.dovepress.com/terms
and incorporate the Creative Commons Attribution
- Non Commercial (unported, 3.0) License.
By accessing the work you hereby accept the Terms. Non-commercial uses of the work are permitted
without any further permission from Dove Medical Press Limited, provided the work is properly
attributed. For permission for commercial use of this work, please see paragraphs 4.2 and 5 of our Terms.
© 2019 The Author(s). This work is published and licensed by Dove Medical Press Limited. The
full terms of this license are available at https://www.dovepress.com/terms
and incorporate the Creative Commons Attribution
- Non Commercial (unported, 3.0) License.
By accessing the work you hereby accept the Terms. Non-commercial uses of the work are permitted
without any further permission from Dove Medical Press Limited, provided the work is properly
attributed. For permission for commercial use of this work, please see paragraphs 4.2 and 5 of our Terms.