Back to Journals » International Journal of Nanomedicine » Volume 14
Targeting tumor cells and neovascularization using RGD-functionalized magnetoliposomes
Authors Garcia Ribeiro RS ![]() , Belderbos S
, Belderbos S ![]() , Danhier P, Gallo J
, Danhier P, Gallo J ![]() , Manshian BB, Gallez B, Bañobre M
, Manshian BB, Gallez B, Bañobre M ![]() , de Cuyper M, Soenen SJ, Gsell W
, de Cuyper M, Soenen SJ, Gsell W ![]() , Himmelreich U
, Himmelreich U ![]()
Received 2 May 2019
Accepted for publication 29 June 2019
Published 29 July 2019 Volume 2019:14 Pages 5911—5924
DOI https://doi.org/10.2147/IJN.S214041
Checked for plagiarism Yes
Review by Single anonymous peer review
Peer reviewer comments 2
Editor who approved publication: Dr Thomas Webster
Rita Sofia Garcia Ribeiro,1,* Sarah Belderbos,1,* Pierre Danhier,2 Juan Gallo,2 Bella B Manshian,1 Bernard Gallez,2 Manuel Bañobre,3 Marcel de Cuyper,4 Stefaan J Soenen,1 Willy Gsell,1 Uwe Himmelreich1
1Biomedical MRI/MoSAIC, Department of Imaging and Pathology, Biomedical Sciences Group, Leuven B-3000, Belgium; 2Biomedical Magnetic Resonance Research Group, Louvain Drug Research Institute, Université Catholique De Louvain, Brussels B-1200, Belgium; 3Diagnostic Tools and Methods/Advanced (Magnetic) Theranostic Nanostructures Lab, International Iberian Nanotechnology Laboratory (INL), PT-Braga 4715-330, Portugal; 4Laboratory of Bionanocolloids, Interdisciplinary Research Centre, KULAK/KU Leuven, Kortrijk B-8500, Belgium
*These authors contributed equally to this work
Purpose: Magnetoliposomes (MLs) have shown great potential as magnetic resonance imaging contrast agents and as delivery vehicles for cancer therapy. Targeting the MLs towards the tumor cells or neovascularization could ensure delivery of drugs at the tumor site. In this study, we evaluated the potential of MLs targeting the αvβ3 integrin overexpressed on tumor neovascularization and different tumor cell types, including glioma and ovarian cancer.
Methods: MLs functionalized with a Texas Red fluorophore (anionic MLs), and with the fluorophore and the cyclic Arginine-Glycine-Aspartate (cRGD; cRGD-MLs) targeting the αvβ3 integrin, were produced in-house. Swiss nude mice were subcutaneously injected with 107 human ovarian cancer SKOV-3 cells. Tumors were allowed to grow for 3 weeks before injection of anionic or cRGD-MLs. Biodistribution of MLs was followed up with a 7T preclinical magnetic resonance imaging (MRI) scanner and fluorescence imaging (FLI) right after injection, 2h, 4h, 24h and 48h post injection. Ex vivo intratumoral ML uptake was confirmed using FLI, electron paramagnetic resonance spectroscopy (EPR) and histology at different time points post injection.
Results: In vivo, we visualized a higher uptake of cRGD-MLs in SKOV-3 xenografts compared to control, anionic MLs with both MRI and FLI. Highest ML uptake was seen after 4h using MRI, but only after 24h using FLI indicating the lower sensitivity of this technique. Furthermore, ex vivo EPR and FLI confirmed the highest tumoral ML uptake at 4 h. Last, a Perl’s stain supported the presence of our iron-based particles in SKOV-3 xenografts.
Conclusion: Uptake of cRGD-MLs can be visualized using both MRI and FLI, even though the latter was less sensitive due to lower depth penetration. Furthermore, our results indicate that cRGD-MLs can be used to target SKOV-3 xenograft in Swiss nude mice. Therefore, the further development of this particles into theranostics would be of interest.
Keywords: tumor targeting, SKOV-3, cRGD, magnetoliposomes, MRI, FLI
Introduction
Recently, molecular imaging techniques have been widely developed for the diagnosis and detection of early stage tumors.1–4 Current tumor imaging in the clinic is still largely based on anatomical imaging methods that detect potentially malignant lesions or on the detection of enhanced metabolism in activated leukocytes or cancer cells using fluorine-18-radiolabeled fluorodeoxyglucose positron emission tomography (PET).5 Although useful, most commonly used PET tracers do not target a specific receptor on the surface of the cells involved in the disease process. Therefore, the use of a specific targeting moiety, eg FDA-approved monoclonal antibodies (mAbs), is being studied for diagnosis and treatment of cancer. A few of the most commonly used mAbs are the human epidermal growth factor receptor 2 (HER2)-specific Trastuzumab and the anti-epidermal growth factor receptor (EGFR) mAb Cetuximab.6–8 Recent advances have been made in targeted preclinical imaging using eg a visualizing SKOV-3 xenografts with positron emission tomography using Trastuzumab in a pretargeting approach.9,10 Even though, direct targeting of tumor-associated antigens is a potent tool, the use of a less expensive, non-radioactive and broader targeting moiety could be beneficial.
More widely available targets are for example biomarkers that are preferentially expressed on newly formed blood vessels in tumors, such as the vascular endothelial growth factor (VEGF) and the apha(v)beta(3)integrin (αvβ3). Tumor angiogenesis, or the sprouting of new vessels from preexisting vasculature, is well recognized as an essential mechanism for tumor growth and the development of metastasis.11,12 Without neoangiogenesis, tumors cannot grow beyond 1–2 mm in size as oxygen and nutrient supply will be restricted.13,14 Once vascularized, previously dormant tumors begin to grow rapidly, invade surrounding tissues (invasion), and transfer to distant sites in the body (metastasis). Among the various ligands, the integrin ligands have been widely studied. The Arg-Gly-Asp (RGD) motif and its structurally related compounds are some of the most studied integrin binding domains.15,16 The RGD motif specifically recognizes ανβ3 and ανβ5 integrins, which are overexpressed on many solid tumors and tumor vasculature, eg in human glioma.17
Iron oxide (Fe3O4) nanoparticles (NPs) have been particularly well studied as magnetic resonance imaging (MRI) contrast agents because of their unique magnetic properties, high sensitivity, and low toxicity.18 However, traditional Fe3O4 NPs are prone to aggregation. They can easily be eliminated by macrophages after injection due to their inherent large surface energy and magnetic dipole interactions.19,20 Therefore, appropriate surface modifications or coatings are necessary to improve their colloidal stability and biocompatibility. For example, by incorporation into liposomes, a lipid coating is provided, which allows efficient and flexible functionalization of the particles.
The use of liposomes to encapsulate Fe3O4 NPs and the advantages of such systems were already described in the early nineties. Bulte et al found that when magnetic NPs were encapsulated within large unilamellar vesicles, ie magnetoliposomes (MLs), they could efficiently label human blood mononuclear cells, such as peripheral blood lymphocytes and monocytes. This increased their MR relaxivity threefold when compared to relaxivities achieved using dextran coated magnetite NPs.21 By directly attaching the double lipid layer to the iron oxide cores (“small MLs”) their contrast properties were further improved, making them favorable for in vivo applications.22,23 MLs can easily be synthesized for modifying their surface charge, incorporate fluorescence markers or add moieties for targeting specific cell types.24–26 Liposomes with a diameter of up to 120 nm passively accumulate in tumor tissues via the surrounding “leaky” vasculature and the enhanced permeability and retention effect.27,28 Active targeting, achieved by modifying sterically stable liposomes with mAbs, folic acid or transferrin, enhances this passive accumulation.29,30
Coupling the liposomes to the RGD motif is a favorable strategy to achieve targeted delivery of these Fe3O4 NPs to tumors and their neovasculature and thus, for the NP-guided imaging of tumors. In the present study, our aim was to produce “small” MLs conjugated with the RGD peptide on the liposomal surface, resulting in RGD-functionalized MLs (RGD-MLs) targeting the ανβ3 integrin. Further functionalization of the MLs was achieved by incorporation of a Texas-Red fluorophore, which allowed monitoring of ML uptake by tumors using both in vivo MRI and fluorescence imaging (FLI), a fast and inexpensive imaging method. The targeting capabilities of the MLs towards tumor cells were evaluated in a preclinical SKOV-3 xenograft model for ovarian cancer.
Materials and methods
Synthesis and characterization of cyclic RGD-MLs (cRGD-MLS)
Anionic MLs were synthesized and iron and phospholipid content of the MLs was measured as previously described by De Cuyper et al.31 The full experimental details can be found wihin the Supplementary materials and Figure S1. The particles were characterized by fluorescence activated cell-sorting (FACS), transmission light microscopy (TEM), dynamic light scattering (DLS) and zeta potentials were determined, as described in detail in Supplementary materials.
 |
Figure 1 TEM images of magnetoliposomes (MLs). (A) anionic MLs, (B) c-RGD MLs. Note the covering around the nanoparticles (phospholipidc bilayer). Scale bar (A) =200 nm. (B) =200 nm. |
Cell culture
All cells were kept in culture in a humidified incubator at 37°C, 21% O2 and 5% CO2. The cell media described below were enriched with 10% heat-inactivated fetal bovine serum, 100 U/l penicillin and 100 μg/ml streptomycin. A human ovarian cancer cell line (SKOV-3; originally acquired from ATCC (Manassas, VA, USA), reference code ATCC® HTB-77™) transduced with a lentiviral vector encoding for enhanced green fluorescent protein and firefly luciferase was maintained in McCoy’s 5A modified medium. A mouse hepatic stellate cell line (GRX, kindly provided by prof. Leo van Grunsven, LiVR, ULB, Brussels, Belgium, originally acquired from Cell Biologics, Catalog No. C57-6242) and a human epithelial cell line (BEAS2B, also acquired from ATCC, reference code ATCC® CRL-9609™) were maintained in DMEM medium further supplemented with 1% glutamine. All cell culture components were purchased from Gibco (Life Technologies, Carlsbad, CA, USA).
High-content image analysis for assessment of cell viability, mitochondrial ROS, and morphology
High-content (HC) imaging studies were conducted as previously described.32 Briefly, 1.5×10³ cells/well were seeded in 96-well plates (Nunc®, Roskilde, Denmark) in 100 µL culture media and incubated overnight in a humidified atmosphere at 37°C with 5% CO2. The following day the cells were exposed to the MLs for 24h in culture medium at following concentrations: 0, 5, 10, 25, 50, 75, and 100 µg/ml. All experiments were performed in triplicates. Stainings were performed for actin, mitochondrial reactive oxygen species (ROS) and live-dead green, as described in Supplementary materials.
Animal experiments
Mice were kept in individual ventilated cages with ad libitum access to food and water. For the generation of xenografts, 1×10⁷ SKOV-3 cells resuspended in 100 µl of PBS (Gibco) were injected in the right flank of female Swiss nude mice (7–8 weeks, Charles River, Ecully, France) when anaesthetized with 2% isoflurane (IsoVET, 100 mg/g, Eurovet, Piramal, Healthcare, London, UK) in 100% O2. Mice were injected intravenously with 250 µL of either anionic or cRGD-MLs (corresponding to 400 µg total [Fe]) via the tail vein after the tumors were allowed to grow for approximately three weeks.
In all cases, animals were sacrificed with an overdose of pentobarbital (Nembutal, CEVA Santé Animale, Diegem, Belgium) and exsanguinated before the tumor, liver and spleen were harvested.
In vivo imaging
MR imaging
All MRI measurements were performed using a 7T Bruker Biospec small-animal MR scanner (Bruker Biospin, Ettlingen, Germany) with a horizontal bore of 30 cm and equipped with actively shielded gradients (200 mT m−1). In vivo data was acquired using a quadrature radio-frequency resonator (transmit/receive; inner diameter 8.6 cm, Bruker Biospin). Uptake of RGD-MLs by the tumors was evaluated by using dynamic contrast enhanced (DCE) MRI (fast low angle shot sequence with repetition time (TR) =20 ms, echo time (TE) =3.27 ms, 20 repetitions, flip angle =30°, matrix =128 x 128 x 45, field of view (FOV) =40 x 40 mm2), T2 weighted fast spin echo MRI (rapid acquisition with refocused echoes (RARE) with TR =1751 ms, TE =28.07 ms, RARE factor =8, averages =10, matrix =192 x 256, FOV =40 x 40 mm2, 2 slice packages with each 7 slices of 1 mm thickness and a 1 mm slice gap) and T2 maps (multi-slice multi-echo sequence with TR =1500 ms, TE =8 ms, 8 echoes, matrix =128 x 192, FOV =40x 40 mm2, 2 slice packages with each 7 slices of 1 mm thickness and a 1 mm slice gap).
MRI scans were acquired immediately before and after administration of MLs, and 2, 4, 24 and 48h after the injection of either anionic or RGD-functionalized MLs. An outline of the experimental design can be found in Figure S2. The manufacturer’s software Paravision 6.0.1 (Bruker Biospin, Ettligen, Germany) was used to generate the parametric T2 maps and to analyze the images. Regions of interest (ROIs) were drawn across the tumor in three adjacent slides and average T2 values were calculated. ROIs were kept equal in size across one animal.
 |
Figure 2 Magnetic resonance imaging (MRI) of mice injected with magnetolipsomes (MLs) (A) Representative in vivo MRI (T2-weighted RARE) before and 2, 4, 24 and 48h post-injection of cRGD-MLs and anionic MLs. Red arrows point to hypointense areas of signal changes, indicating uptake of RGD-MLs. (B) Quantification of the T2 values based on parametric T2 maps acquired by multi slice-multi echo MRI. Significant differences were detected between animals injected with cRGD-MLs and anionic MLs. Data are presented as mean ± SD (two-way ANOVA). **p<0.01, ***p<0.001, ****p<0.0001 vs baseline (n=9 animals/group). |
Fluorescence imaging
Tumor-bearing mice were given low fluorescent pellets (2019 Teklad Global 19% Protein Extruded Diet (Envigo, Gannat, France) starting from seven days before the onset of the experiments. In vivo and ex vivo FLI was performed using an IVIS Spectrum (Perkin Elmer, Waltham, MA, USA) with an excitation wavelength of 570 nm and emission filter of 620 nm. Signal intensities were measured before, immediately after administration and 2, 4, 24 and 48h after the intravenous administration of the particles via the tail vein (Figure S2). Three scans were acquired at each time point. After the animals were sacrificed, the tumors were removed and ex vivo FLI was performed.
To quantify the in vivo relative total radiant efficiency within the tumors, circular ROIs were drawn around the tumors, using the manufacturers Living Image software version 4.5.2 (Perkin Elmer). These ROIs were equal in size across one animal. All results were normalized to baseline.
Ex vivo confirmation of ML uptake
Fluorescence imaging
After the animals were sacrificed, ex vivo FLI was performed on the tumors, livers and spleens. Total radiant efficiency was determined by manual delineation of the organs. Total radiant efficiency of the background was also determined by use of the same ROI. Data are represented as the total radiant efficiency of the tumor region divided by that of the background (control region).
Electron paramagnetic resonance (EPR) spectroscopy
After the animals were sacrificed, organs were harvested, freeze-dried and crushed into a fine powder. The dry samples were analyzed using a Bruker EMX-Plus EPR spectrometer (Bruker, Rheinstetten, Germany), operating in X-band (9.85 GHz) and equipped with a PremiumX ultra low noise microwave bridge and a SHQ high sensitivity resonator. The following settings were used: microwave power =5.05 mW, center field =3150 G, field sweep width =5000 G, modulation amplitude =30 G, time constant =20.48 ms, conversion time =20.48 ms, modulation field =100 kHz. Measurements were performed at room temperature. The iron oxide content in each freeze-dried organ was quantified using a calibration curve for different concentrations of pure MLs after water removal (heating to 60°C for 3 days). Endogenous superparamagnetic iron content was normalized to the weight of the whole dry organs of cRGD-MLs injected animals or control animals and expressed in ng Fe3O4 per mg of dry tissue.
Histology
Harvested organs were fixed overnight in 4% paraformaldehyde (Acros Organics, Thermo Fisher Scientific, Geel, Belgium) and stored in 0.1% sodium azide (in PBS; Acros Organics) until further processing. Samples were embedded in paraffin and 5 µm thick sections were made using a microtome. Afterwards, sections were deparaffinized and dehydrated by passing through a graded alcohol series. Perl’s staining was performed to visualize iron in the respective tissue sections. Images were acquired using the Axio Scan.Z1 (Carl Zeiss, Göttingen, Germany).
Statistical analysis
Comparisons between groups were performed using Student’s t-test or two-way ANOVA. Bonferroni and Tukey’s post hoc tests were applied, respectively to determine statistical significance of treated groups relative to the control group or between two treated groups under one condition. In all figures, results are represented as means ± standard deviation (SD). Differences were considered statistically significant if p<0.05.
Results
ML characterization
In-house synthetized MLs were characterized by TEM and DLS, with TEM indicating a spherical morphology of Fe3O4 particles, each individually enveloped by a phospholipid bilayer (anionic MLs -Figure 1A, cRGD-MLs – Figure 1B). DLS analysis revealed similar hydrodynamic diameters (HD) and polydispersity indices (PDI) for anionic and cRGD-MLs. Furthermore, both types of MLs are negatively charged as indicated by zeta (Z) potential measurements (Table 1). FACS analysis showed two different populations: a negative fraction (no Texas Red, with a mean fluorescence intensity of 0 and 102 units, respectively) and a positive fraction corresponding to the functionalized MLs, with an increase in fluorescence intensity (102–104 units). The increase of fluorescence intensity of the MLs is directly proportional to the ratio of fluorescent probe used during the coupling, confirming the incorporation of the cRGD peptide with a coupling efficiency of 93.4%.
 |
Table 1 Characterization of anionic and RGD-functionalized magnetoliposomes (MLs) by dynamic light scattering |
No toxicity of cRGD-MLs was observed on SKOV-3 cells
BEAS-2B, GRX and SKOV-3 were exposed in vitro to anionic and cRGD-MLs with increasing concentrations of iron (5–100 µg Fe/ml medium). No significant differences were observed on viability, mitochondrial ROS formation, or cell morphology when cells were exposed to either anionic or cRGD MLs for 24 hrs (Figure S3).
 |
Figure 3 Fluorescence imaging (FLI) of mice injected with magnetoliposomes (MLs). (A) Representative in vivo FLI images before and 2, 4, 24 and 48 h post-injection of cRGD-MLs and anionic MLs. (B) Quantification of the total radiant efficiency based on FLI data. There is a significant difference between cRGD-ML and anionic ML injected animals. Data are presented as mean ± SD (Two-Way ANOVA). ***p<0.001, ****p<0.0001 vs baseline (n=3/group, except RGD-group for FLI: n=4). (C) Quantification of the total radiant efficiency of tumor region ex vivo, comparing the tumor with a control region of cRGD-ML and anionic-ML injected animals 2h, 4h and 48h after injection. *p<0.05 compared to 2h group (n=3 animals p/group). No results are shown for the group that received anionic MLs at 48h due to acquisition problems. |
Successful follow up of cRGD-MLs uptake in SKOV-3 tumor xenografts in vivo by MRI and FLI
MRI and FLI were used to determine the direct targeting capabilities of cRGD-MLs in vivo, by allowing the visualization and quantification of the MLs uptake at the tumor site of SKOV-3 xenografts longitudinally. We clearly see a decrease of signal intensity (hypointense area) in MRI after 2h (as indicated by white arrows in Figure 2A), The imaging results were confirmed by a decrease in T2 relaxation time, which is largest 4h after injection of cRGD-MLs (52.06±0.71 ms) compared to anionic MLs (63.6±1.6 ms) (Figure 2B). T2 values remained stable after 24h and 48h, showing a significant decrease in T2 relaxation time due to the presence of superparamagnetic iron oxide cores in the tumor site, accompanied by an increase of total radiant efficiency in FLI over time, with a maximum at 24h (Figure 3A).
FLI quantification confirms an increase in total radiant efficiency at the tumor site, immediately after the injection of the Texas Red-labeled cRGD-MLs, with a maximum uptake at 24h. Immediately after injection of the anionic MLs, one mouse died. The results of this animal were excluded. Four hours after injection of anionic MLs, a decrease in total radiant efficiency in the xenograft area was measured, which persisted during the whole experiment (Figure 3B). This confirms the lack of uptake of non-functionalized MLs by the tumor.
Confirmation of crgd-ml uptake in SKOV-3 tumor xenografts by ex vivo FLI and EPR spectroscopy
Quantification of the ex vivo total radiant efficiency (%) of tumors of cRGD and anionic-MLs injected animals indicates a clear increase in the fluorescent intensity in the tumor of cRGD-MLs injected animals, and thus presence of particles after 2h of injection (Figure 3C).
The ex vivo FLI results are further confirmed by EPR spectroscopy. We found an increase in the total iron content in cRGD-MLs injected animals at 4h after injection (1.26±0.30 ng Fe3O4/mg dry tissue or 0,12% ±0,04 of total dose) in comparison with anionic MLs (0.39±0.03 ng Fe3O4/mg dry tissue or 0,06±0,02% of total dose; Table 2) . The total superparamagnetic iron concentration is also significantly higher in the tumors of cRGD-MLs injected animals in comparison to control animals (0.37±0.02 ng Fe3O4/mg dry tissue; Figure 4A) This was also confirmed by the lower iron uptake in the liver of cRGD-MLs injected animals (72.78±0.40 ng Fe3O4/mg dry tissue) in comparison with animals injected with anionic-MLs (86.65±0.67 ng Fe3O4/mg dry tissue), due to an enhanced uptake of the NPs inside the tumor. We also observed an increased accumulation of the cRGD-MLs in the spleen (231.3±172.59 ng Fe3O4/mg dry tissue) in comparison with animals injected with anionic-MLs (57.24±43.81 ng Fe3O4/mg dry tissue; Figure 4B).
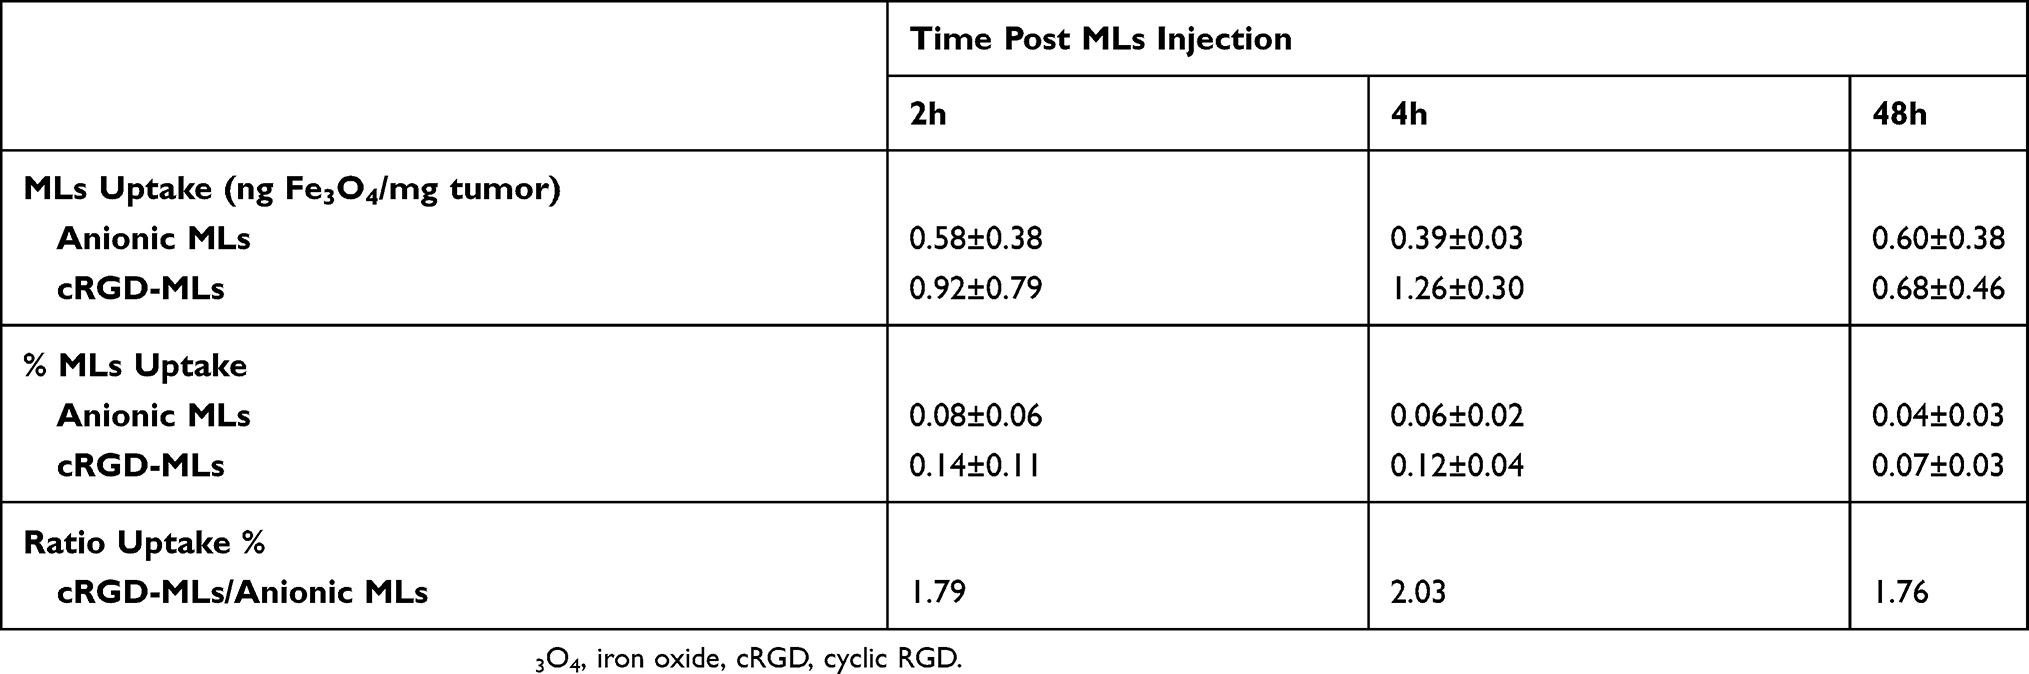 |
Table 2 MLs uptake in SKOV-3 xenografts at the different time points of the experiment |
 |
Figure 4 Ex vivo electron paramagnetic resonance spectroscopy (EPR). (A) Quantification of the total iron concentration [Fe] in the tumor tissue by EPR spectroscopy over-time (h= hours). Data are presented as mean ± SD (two-way ANOVA), (n=3 animals p/group). (B) Quantification of the total iron concentration in the tumor tissue of cRGD, anionic magnetoliposomes (MLs) and control (Ctrl) animals by EPR spectroscopy, in comparison with liver and spleen (excretion route) 2h after injection of the MLs. Data are presented as mean ± SD (two-way ANOVA). |
Histology
To confirm the uptake of cRGD-MLs by the SKOV-3 xenografts tumor, tissue sections of both cRGD-MLs and anionic-MLs injected animals were stained with Perl’s stain (Figure 5). No staining was detected in the tumor tissue of anionic ML-injected animals (Figure 5A). A distinct blue color can be seen on the histological slices of the cRGD-MLs injected animals (Figure 5B) indicating the presence of iron particles. These MLs were noticed in the tumor region where also necrotic areas were visible (Figure 5C).
 |
Figure 5 Hematoxylin and eosin stainings of tumors. Representative complete overviews of the histological sections of tumors derived from animals injected with either anionic magnetoliposomes (MLs) (A) or cRGD-MLs (B). (C) is an amplification of (B). The blue “dots” in the tumor, indicate the presence of Fe and are caused by the targeted uptake of cRGD-MLs. This signal is absent in the control tumors. Scale bar (A, B) =500 µm. Scale bar (C) =200 µm. |
Discussion
In this study, we generated cRGD-functionalized MLs for targeting newly formed blood vessels of tumors and tumor cells. We were able to monitor the uptake of these MLs by using in vivo MRI. This uptake was further assessed by in vivo and ex vivo FLI, EPR and histology. By functionalizing MLs with a cRGD peptide, we aimed at targeting the αvβ3 integrin. The αvβ3 was chosen as it is highly expressed on activated endothelial cells and newborn vessels, but it is absent on resting endothelial cells and most physiological tissues, making it a suitable target for tumor imaging.33–35
In vitro studies have shown that NPs of around 50 nm diameter are ideal in size for cellular interactions, while cell uptake of larger NPs is less efficient.36 To facilitate tumor uptake, we have synthesized particles with a HD of 53.5±0.3 and 57.8±3.7 nm for anionic and cRGD functionalized MLs, respectively. Our MLs presented a low PDI of 0.32±0.03 and a Z potential of -65.12±2.02mV, indicating an anionic charge of the MLs. Electrostatic interactions of these NPs with the cationic parts of the cell membrane contributes to their high cellular accumulation.36 Prior studies with anionic MLs demonstrated that these were taken up reaching an iron concentration of up to 18.9 pg Fe/cell.37–39 These values are in agreement with previously reported levels of non-specific uptake of other iron oxide NPs by other cell types.40–43
To test the biocompatibility under in vitro conditions, the toxicity of the MLs was tested on the target cell line, a human ovarian cancer cell line (SKOV-3) showing a high expression of αvβ3 receptors, and a positive and negative control cell line, a mouse hepatic stellate cell line (GRX) and a human epithelial cell line (BEAS2B), respectively.44,45 By using these different cell lines, the specificity of active targeting was also assessed. We investigated optimal NP/cell interaction by labeling the different cell lines with anionic and cRGD-MLs at increasing concentrations (5–100 µg Fe/ml medium). No noticeable effect on cell viability, oxidative stress or cell morphology was observed in cells when labeled with cRGD-MLs or anionic MLS for 24 hrs, for any of the concentrations tested (up to 100 µg iron/ml medium).
In addition to the in vitro experiments, we evaluated the use of in vivo imaging modalities (MRI and FLI) to monitor intra-tumoral ML uptake. As expected, negative T2 MR contrast induced by the superparamagnetic iron oxide cores of the MLs increased (decrease of signal intensity) in the tumors within 4h after cRGD-ML injection. We observed an accentuated increase in MR contrast in the tumor tissue in cRGD-MLs injected mice in contrary to anionic-MLs injected animals. This indicates that the cRGD-MLs are accumulating in the tumors by an active targeting process and that passive accumulation by the EPR effect is not sufficient for non-functionalized (anionic) MLs for similarly high accumulation in the tumor.46,47 It is worth noting that we observed an overall increase in T2 values for the animals injected with anionic-MLs over-time, most likely due to increased edema, necrosis and overall heterogeneity of the tumor mass, leading to heterogeneities on T2-weighted MR images.48
Similarly, increased uptake was observed on FLI images following administration of cRGD-MLs. We observed an increase in total radiant efficiency at the tumor site, immediately after the injection of the cRGD-MLs with a maximum uptake after 24h. The slight difference between the maximum uptake time point in MRI and FLI at 4h in contrast to 24h, respectively, can be explained because FLI and MRI measurements were performed on different groups of animal, adding inter-animal variability to the distribution profile of the MLs. Nevertheless, this did not interfere with the general findings that the overall uptake profile of cRGD and anionic MLs is different, indicating increased accumulation of cRGD-MLs in the tumors.
Even though MRI and FLI provided similar indications of cRGD-MLs uptake, FLI is less sensitive to early changes due to larger influences of background signal of circulating MLs, in particular in highly vascularized regions close to the surface (eg head and neck region). Furthermore, high baseline background signals might obscure uptake in other organs, like liver and spleen, as might be the case in the mice injected with anionic MLs. On the other hand, FLI is relatively easy to use, rapid and inexpensive in animal models, making it an effective screening tool for evaluation and comparison of vascular targeting. However, its application will be restricted by the limited depth penetration of light, biasing the intensity towards tumor surface and underestimating the signal changes at deeper regions of the xenograft.49
For validation, mice were sacrificed 2, 4 and 48 hrs after injection of MLs following MRI or FLI, respectively. Tumors were resected and examined by ex vivo FLI and EPR spectroscopy. We found a significant increase in relative total radiant efficiency in FLI of tumors harvested two hours after injection. This discrepancy between ex vivo and in vivo FLI confirms that the latter is challenging when the maximum signal is more transient.50 Using EPR spectroscopy, the presence of Fe3O4 residues inside the tissues was confirmed. The total iron content in tumors of cRGD-ML injected mice increased 2h after injection, with a maximum uptake per mg of tumor tissue after 4h (1.26±0.30 ng Fe3O4/mg dry tissue) in comparison with anionic MLs (0.39±0.03 ng Fe3O4/mg dry tissue), confirming that the tumor cells preferentially took up the cRGD-MLs (ratio cRGD/anionic MLs of 2.03).
We have also noticed a greater accumulation of the cRGD-MLs in the spleen which might also contribute to this effect. It is known from the literature that approximately 80% of the injected dose of iron oxide nanoparticles is take up by Kupfer cells and 5–10% of the injected dose ends up in the spleen.51 Furthermore, macrophages are equipped with scavenger receptors recognizing charged molecules, such as the free maleimide groups in the cRGD-MLs formulation.52 This could increase the recognition of these nanoparticles by the macrophages and therefore, their uptake in the spleen, as it was also shown in other studies.53
While the utilization of cRGD-nanoparticles to target tumor cells is not entirely new, previous studies have mostly focused on short-term follow-up (maximum 24h) of such NPs using a single modality, eg MRI or PET, with little to no ex vivo confirmation of NP-uptake in the tumors.54,55 In this study, we were able to demonstrate the suitability of cRGD-MLs as a diagnostic agent for combined multimodal imaging using MRI and FLI. By combining MRI and FLI in a dual-modality approach, MRI could provide high resolution, three-dimensional and quantitative information on cRGD-MLs uptake by the tumors, while FLI could provide rapid full body information on ML distribution and temporal changes. Furthermore, the great r2/r1 ratio achieved by the MLs in combination excellent biocompatibility makes them interesting candidates for future clinical studies.21,38 The good tolerance of cells towards MLs further enabled us to use relatively high iron concentrations without any adverse effects in vitro or in vivo. In future studies, these MLs can be used theranostic agents for the follow-up of anti-vascular therapies as they target tumor neovasculature.56
Conclusion
In conclusion, we were able to monitor the tumor-specific uptake of cRGD-MLs using MRI and FLI and confirm it by using EPR and histology. FLI, however, was less sensitive in detecting the RGD-MLs accumulation in vivo as it is limited by a low depth penetration and requires high local concentrations of NPs relative to background. On the other hand, T2-weighted MRI has its limitations due to potentially misleading changes in background signal (T2 values) caused by physiological changes (edema, hemorrhages etc.).
Ethics approval
All principles of laboratory animal care were followed according to the Belgian (Royal Decree of 29 May 2013), Flemish (Decision of the Flemish Government to adapt the Royal Decree of 29 May 2013, 17 February 2017) and European (Directive 2010/63/EU) regulations on the protection of animals used for scientific purposes. The animal experimental procedures were approved by the Ethics Committee of the KU Leuven (ECD number p259/2015).
Acknowledgments
The authors would like to thank Mrs. Ann Van Santvoort and Mr. Jens Wouters (Biomedical MRI/MoSAIC, KU Leuven, Belgium) for their technical support. This work was supported by the European Commission for the FP7 MC-ITN ‘BetaTrain’ (EU-FP7, 289932); the Horizon 2020 research and innovation programme (H2020‐NMP‐2014‐2015) for the ‘PANA’ project under grant agreement n° 686009; the Agency for Innovation by Science and Technology (IWT n° 140061, SBO NanoCoMIT) and The Research Foundation - Flanders (FWO) for project G.0A75.14 and G.0B28.14. Current adress for Dr Rita Sofia Garcia Ribeiro is In vivo Cellular and Molecular Imaging Lab (ICMI), Research Cluster Imaging and Physical Sciences (BEFY), Vrij Universiteit Brussel, Laarbeeklaan 103, B-1090 Jette, Belgium.
Author contributions
All authors contributed to data analysis, drafting and revising the articles, gave final approval of the version to be published, and agree to be accountable for all aspects of the work.
Disclosure
Dr Rita Sofia Garcia Ribeiro reports grants from European Comission, Agency for Innovation by Science and Technology, and Flemish Wetenschap Onderzoek (FWO), during the conduct of the study. Miss Sarah Belderbos reports grants from KU Leuven, during the conduct of the study. Prof. Dr. Uwe Himmelreich reports grants from European Commission, Agency for Innovation by Science and Technology and Research Foundation Flanders, during the conduct of the study. The authors report no other conflicts of interest in this work.
References
1. Shi X, Wang SH, Swanson SD, et al. Dendrimer-functionalized shell-crosslinked iron oxide nanoparticles for in-vivo magnetic resonance imaging of tumors. Adv Mater. 2008;20(9):1671–1678. doi:10.1002/adma.200702770
2. Wang H, Zheng L, Peng C, Shen M, Shi X, Zhang G. Folic acid-modified dendrimer-entrapped gold nanoparticles as nanoprobes for targeted CT imaging of human lung adencarcinoma. Biomaterials. 2013;34(2):470–480. doi:10.1016/j.biomaterials.2012.09.054
3. Chen Q, Li K, Wen S, et al. Targeted CT/MR dual mode imaging of tumors using multifunctional dendrimer-entrapped gold nanoparticles. Biomaterials. 2013;34(21):5200–5209. doi:10.1016/j.biomaterials.2013.03.009
4. Yang M, Cheng K, Qi S, et al. Affibody modified and radiolabeled gold-iron oxide hetero-nanostructures for tumor PET, optical and MR imaging. Biomaterials. 2013;34(11):2796–2806. doi:10.1016/j.biomaterials.2013.01.014
5. Coenen HH, Elsinga PH, Iwata R, et al. Fluorine-18 radiopharmaceuticals beyond [18F]FDG for use in oncology and neurosciences. Nucl Med Biol. 2010;37(7):727–740. doi:10.1016/j.nucmedbio.2010.04.185
6. Dijkers EC, Oude Munnink TH, Kosterink JG, et al. Biodistribution of 89Zr-trastuzumab and PET imaging of HER2-positive lesions in patients with metastatic breast cancer. Clin Pharmacol Ther. 2010;87(5):586–592. doi:10.1038/clpt.2010.12
7. Menke-van der Houven van Oordt CW, Gootjes EC, Huisman MC, et al. 89Zr-cetuximab PET imaging in patients with advanced colorectal cancer. Oncotarget. 2015;6(30):30384–30393. doi:10.18632/oncotarget.4672
8. van Loon J, Even AJG, Aerts HJWL, et al. PET imaging of zirconium-89 labelled cetuximab: a phase I trial in patients with head and neck and lung cancer. Radiother Oncol. 2017;122(2):267–273. doi:10.1016/j.radonc.2016.11.020
9. Billaud EMF, Belderbos S, Cleeren F, et al. Pretargeted PET imaging using a bioorthogonal 18F-labeled trans-cyclooctene in an ovarian carcinoma model. Bioconjug Chem. 2017;28(12):2915–2920. doi:10.1021/acs.bioconjchem.7b00635
10. Keinänen O, Fung K, Pourat J, et al. Pretargeting of internalizing trastuzumab and cetuximab with a 18F-tetrazine tracer in xenograft models. EJNMMI Res. 2017;7(1):95. doi:10.1186/s13550-017-0344-6
11. Hong H, Sun J, Cai W. Radionuclide-based cancer imaging targeting the carcinoembryonic antigen. Biomark Insights. 2008;3:435–451. Available from: http://www.ncbi.nlm.nih.gov/pubmed/19578524. Accessed February 16, 2018. doi:10.4137/BMI.S1124
12. Aparici CM, Carlson D, Nguyen N, Hawkins RA, Seo Y. Combined SPECT and multidetector CT for prostate cancer evaluations. Am J Nucl Med Mol Imaging. 2012;2(1):48–54. Available from: http://www.ncbi.nlm.nih.gov/pubmed/22267999. Accessed February 16, 2018.
13. Carmeliet P, Jain RK. Angiogenesis in cancer and other diseases. Nature. 2000;407(6801):249–257. doi:10.1038/35025220
14. Jain RK. Normalizing tumor vasculature with anti-angiogenic therapy: a new paradigm for combination therapy. Nat Med. 2001;7(9):987–989. doi:10.1038/nm0901-987
15. Xiong J-P, Stehle T, Zhang R, et al. Crystal structure of the extracellular segment of integrin alpha Vbeta3 in complex with an Arg-Gly-Asp ligand. Science. 2002;296(5565):151–155. doi:10.1126/science.1069040
16. Humphries JD, Byron A, Humphries MJ. Integrin ligands at a glance. J Cell Sci. 2006;119(Pt 19):3901–3903. doi:10.1242/jcs.03098
17. Ruoslahti E. RGD and other recognition sequences for integrins. Annu Rev Cell Dev Biol. 1996;12(1):697–715. doi:10.1146/annurev.cellbio.12.1.697
18. Himmelreich U, Dresselaers T. Cell labeling and tracking for experimental models using magnetic resonance imaging. Methods. 2009;48(2):112–124. doi:10.1016/j.ymeth.2009.03.020
19. Amiri H, Bordonali L, Lascialfari A, et al. Protein corona affects the relaxivity and MRI contrast efficiency of magnetic nanoparticles. Nanoscale. 2013;5(18):8656–8665. doi:10.1039/c3nr00345k
20. Tschulik K, Compton RG. Nanoparticle impacts reveal magnetic field induced agglomeration and reduced dissolution rates. Phys Chem Chem Phys. 2014;16(27):13909–13913. doi:10.1039/C4CP01618A
21. Bulte JWM, De Cuyper M, Despres D, Frank JA. Preparation, relaxometry, and biokinetics of PEGylated magnetoliposomes as MR contrast agent. J Magn Magn Mater. 1999;194(1–3):204–209. doi:10.1016/S0304-8853(98)00556-3
22. Soenen SJH, Hodenius M, De Cuyper M. Magnetoliposomes: versatile innovative nanocolloids for use in biotechnology and biomedicine. Nanomedicine (Lond). 2009;4(2):177–191. doi:10.2217/17435889.4.2.177
23. Soenen SJ, Vande Velde G, Ketkar-Atre A, Himmelreich U, De Cuyper M. Magnetoliposomes as magnetic resonance imaging contrast agents. Wiley Interdiscip Rev Nanomed Nanobiotechnol. 2011;3(2):197–211. doi:10.1002/wnan.122
24. Soenen SJ, De Meyer SF, Dresselaers T, et al. MRI assessment of blood outgrowth endothelial cell homing using cationic magnetoliposomes. Biomaterials. 2011;32(17):4140–4150. doi:10.1016/j.biomaterials.2011.02.037
25. Soenen SJH, Brisson AR, Jonckheere E, et al. The labeling of cationic iron oxide nanoparticle-resistant hepatocellular carcinoma cells using targeted magnetoliposomes. Biomaterials. 2011;32(6):1748–1758. doi:10.1016/j.biomaterials.2010.11.005
26. Ketkar-Atre A, Struys T, Dresselaers T, et al. In vivo hepatocyte MR imaging using lactose functionalized magnetoliposomes. Biomaterials. 2014;35(3):1015–1024. doi:10.1016/j.biomaterials.2013.10.029
27. Yuan F, Leunig M, Huang SK, Berk DA, Papahadjopoulos D, Jain RK. Microvascular permeability and interstitial penetration of sterically stabilized (stealth) liposomes in a human tumor xenograft. Cancer Res. 1994;54(13):3352–3356. Available from: http://www.ncbi.nlm.nih.gov/pubmed/8012948. Accessed February 15, 2018.
28. Maeda H. Toward a full understanding of the EPR effect in primary and metastatic tumors as well as issues related to its heterogeneity. Adv Drug Deliv Rev. 2015;91:3–6. doi:10.1016/j.addr.2015.01.002
29. Gabizon A, Shmeeda H, Horowitz AT, Zalipsky S. Tumor cell targeting of liposome-entrapped drugs with phospholipid-anchored folic acid-PEG conjugates. Adv Drug Deliv Rev. 2004;56(8):1177–1192. doi:10.1016/j.addr.2004.01.011
30. Derycke ASL, Kamuhabwa A, Gijsens A, et al. Transferrin-conjugated liposome targeting of photosensitizer AlPcS4 to rat bladder carcinoma cells. J Natl Cancer Inst. 2004;96(21):1620–1630. doi:10.1093/jnci/djh314
31. De Cuyper M, Soenen SJH. Cationic magnetoliposomes. Weissig V, ed. Methods Mol Biol. 2010;605:97–111. doi:10.1007/978-1-60327-360-2_6
32. Manshian BB, Pfeiffer C, Pelaz B, et al. High-content imaging and gene expression approaches to unravel the effect of surface functionality on cellular interactions of silver nanoparticles. ACS Nano. 2015;9(10):10431–10444. doi:10.1021/acsnano.5b04661
33. Folkman J. Role of angiogenesis in tumor growth and metastasis. Semin Oncol. 2002;29(6 Suppl 16):15–18. doi:10.1053/sonc.2002.37263
34. Sharma RA, Harris AL, Dalgleish AG, Steward WP, O’Byrne KJ. Angiogenesis as a biomarker and target in cancer chemoprevention. Lancet Oncol. 2001;2(12):726–732. doi:10.1016/S1470-2045(01)00586-1
35. Liu Z, Wang F, Chen X. Integrin alpha(v)beta(3)-Targeted Cancer Therapy. Drug Dev Res. 2008;69(6):329–339. doi:10.1002/ddr.20265
36. Verma A, Stellacci F. Effect of surface properties on nanoparticle-cell interactions. Small. 2010;6(1):12–21. doi:10.1002/smll.200901158
37. Ketkar-Atre A, Struys T, Soenen SJ, et al. Variability in contrast agent uptake by different but similar stem cell types. Int J Nanomedicine. 2013;8:4577. doi:10.2147/IJN.S51588
38. Garcia Ribeiro RS, Gysemans C, Da Cunha JPMCM, et al. Magnetoliposomes as contrast agents for longitudinal in vivo assessment of transplanted pancreatic islets in a diabetic rat model. Sci Rep. 2018;8(1):11487. doi:10.1038/s41598-018-29136-9
39. Garcia Ribeiro R, Ketkar-Atre A, Yin T, et al. Improved labeling of pancreatic islets using cationic magnetoliposomes. J Pers Med. 2018;8(1):12. doi:10.3390/jpm8010012
40. Moore A, Weissleder R, Bogdanov A. Uptake of dextran-coated monocrystalline iron oxides in tumor cells and macrophages. J Magn Reson Imaging. 1997;7(6):1140–1145. doi:10.1002/jmri.1880070629
41. Bulte JW, Douglas T, Witwer B, et al. Magnetodendrimers allow endosomal magnetic labeling and in vivo tracking of stem cells. Nat Biotechnol. 2001;19(12):1141–1147. doi:10.1038/nbt1201-1141
42. Struys T, Ketkar-Atre A, Gervois P, et al. Magnetic resonance imaging of human dental pulp stem cells in vitro and in vivo. Cell Transplant. 2013;22(10):1813–1829. doi:10.3727/096368912X657774
43. Trekker J, Leten C, Struys T, et al. Sensitive in vivo cell detection using size-optimized superparamagnetic nanoparticles. Biomaterials. 2014;35(5):1627–1635. doi:10.1016/j.biomaterials.2013.11.006
44. Zhou X, Murphy FR, Gehdu N, Zhang J, Iredale JP, Benyon RC. Engagement of alphavbeta3 integrin regulates proliferation and apoptosis of hepatic stellate cells. J Biol Chem. 2004;279(23):23996–24006. doi:10.1074/jbc.M311668200
45. Zaret KS. Pancreatic beta cells: responding to the matrix. Cell Metab. 2006;3(3):148–150. doi:10.1016/j.cmet.2006.02.006
46. Bertrand N, Wu J, Xu X, Kamaly N, Farokhzad OC. Cancer nanotechnology: the impact of passive and active targeting in the era of modern cancer biology. Adv Drug Deliv Rev. 2014;66:2–25. doi:10.1016/j.addr.2013.11.009
47. Ernsting MJ, Murakami M, Roy A, Li S-D. Factors controlling the pharmacokinetics, biodistribution and intratumoral penetration of nanoparticles. J Control Release. 2013;172(3):782–794. doi:10.1016/j.jconrel.2013.09.013
48. Belderbos S, Govaerts K, Croitor Sava A, et al. Assessment of tumor microenvironment to determine the most suitable therapeutic window in an ovarian cancer model. Proc Intl Soc Mag Reson Med. 2018;26:
49. Liu L, Mason RP, Gimi B. Dynamic bioluminescence and fluorescence imaging of the effects of the antivascular agent Combretastatin-A4P (CA4P) on brain tumor xenografts. Cancer Lett. 2015. doi:10.1016/j.canlet.2014.09.038
50. Bollinger RA. Evaluation of the light emission kinetics in luciferin/luciferase-based in vivo bioluminescence imaging for guidance in the development of small animal imaging study design. UT Southwestern Graduate School of Biomedical Sciences; 2006. Available from: https://repositories.tdl.org/utswmed-ir/handle/2152.5/737. Accessed February 16, 2018.
51. Ruoslahti E, Bhatia SN, Sailor MJ. Targeting of drugs and nanoparticles to tumors. J Cell Biol. 2010;188(6):759–768. doi:10.1083/jcb.200910104
52. D’Hollander A, Jans H, Vande VG, et al. Limiting the protein corona: A successful strategy for in vivo active targeting of anti-HER2 nanobody-functionalized nanostars. Biomaterials. 2017;123:15–23. doi:10.1016/j.biomaterials.2017.01.007
53. Arnida J-AMM, Ray A, Peterson CM, Ghandehari H. Geometry and surface characteristics of gold nanoparticles influence their biodistribution and uptake by macrophages. Eur J Pharm Biopharm. 2011;77(3):417–423. doi:10.1016/j.ejpb.2010.11.010
54. Richard S, Boucher M, Lalatonne Y, Mériaux S, Motte L. Iron oxide nanoparticle surface decorated with cRGD peptides for magnetic resonance imaging of brain tumors. Biochim Biophys Acta. 2016. doi:10.1016/j.bbagen.2016.12.020
55. Yang X, Hong H, Grailer JJ, et al. cRGD-functionalized, DOX-conjugated, and 64Cu-labeled superparamagnetic iron oxide nanoparticles for targeted anticancer drug delivery and PET/MR imaging. Biomaterials. 2011;32(17):4151–4160. doi:10.1016/j.biomaterials.2011.02.006
56. Kazmierczak PM, Todica A, Gildehaus F-J, et al. 68Ga-TRAP-(RGD)3 hybrid imaging for the in vivo monitoring of αVß3-integrin expression as biomarker of anti-angiogenic therapy effects in experimental breast cancer. Chammas R, ed. PLoS One. 2016;11(12):e0168248. doi:10.1371/journal.pone.0168248
Supplementary materials
Cyclic RGD peptide-labeled MLs synthesis
Small anionic MLs were produced as previously described [30]. In short, sonicated vesicles containing a mixture of 1,2-Dimyristoyl-sn-glycero-3-phosphorylcholine (DMPC) and 1,2-Dimyristoyl-sn-glycero-3-phosphorylglycerol sodium salt (DMPG) (both from Avanti Polar Lipids, Alabaster, Alabama) (9:1) in 2-[Tris(hydroxymethyl)-methylamino]-ethanesulfonic acid (TES) buffer (5 mM, pH 7.0; Sigma-Aldrich, Overijse, Belgium) were mixed at a lipid/Fe3O4 weight ratio of 1:5 with a water compatible magnetic fluid at room temperature (RT). Subsequently the mixture was dialyzed for 3 days against TES buffer with regular buffer changes. Separation of the resulting MLs from the excess vesicles was performed by high-gradient magnetophoresis (HGM) and 1,2-distearoyl-sn-glycero-3-phosphoethanolamine-polyethylene glycol-maleimide (DSPE-PEG-MAL, 2-5% mol) (Avanti Polar Lipids, Alabaster, Alabama) was added to the anionic vesicles. The RGD peptide was linked to the MLs formulation via a sulfhydryl group at the cysteine residue of the DSPE-PEG-MAL by overnight incubation at a 10:1 molar ratio (Supplementary Scheme 1). A custom-made cyclic RGD peptide, labeled with fluorescein isothiocyanate (FITC), from Pepscan B.V (Lelystad, The Netherlands) was used. Additionally, a fluorescent lipid conjugate 1,2-Dipalmitoyl-sn-glycero-3-phosphoethanolamine (DPPE)-Texas Red (Avanti Polar Lipidis, Alabaster, Alabama) (0.75% mol) was added to the outer lipid layer of the MLs. Unbound cyclic RGD peptide and DPPE-Texas Red were separated from the magnetic MLs fraction by HGM.
Characterization of cRGD-MLs
A JEOL 2100 transmission electron microscope (JEOL Ltd., Tokyo, Japan) working at 80 keV was used to image the nanostructures. Cryogen frozen samples were prepared in a FEI Vitrobot™ (Thermo Fischer Scientific) under the following parameters: Sample volume, 7.5 μl; Blot time, 3 s; Wait time, 1 s; Drain time, 0 s; Blot force, −3; Blot total, 1. Lacey carbon coated, 300 mesh, copper grids (Ted Pella, Redding, CA, USA) were used for the samples. Hydrodynamic size and surface charge studies were performed on a Horiba nanoPartica SZ-100 (Horiba Ltd., Kyoto, Japan) instrument directly in water solutions. Measurements were performed directly in water at 37 ºC in disposable cuvettes. Carbon electrodes were used for the zeta potential measurements. In both cases, results are shown as the average of four independent measurements ± standard deviation.
High-content image analysis for cell viability, mitochondrial ROS, and morphology
To investigate the effect of following the exposure period, cells were washed twice with phosphate-buffered saline (PBS, Gibco Life Technologies) and were immediately fixed with 4% PFA to prepare for actin staining. Next, cells were permeabilized for 10 mins with Triton X-100 (1%, Sigma-Aldrich) and blocked for 30 min with 10% serum-containing PBS, followed by incubation with Acti-stain 488 phalloidin (TebuBio, Belgium) at RT. For samples reserved for viability, samples were fixed with 4% paraformaldehyde (PFA) and incubated with LIVE/DEAD® Fixable Green Dead Cell Stain Kit (Thermo Fisher Scientific) for 30 min at 37°C and 5% CO2. Samples reserved for mitochondrial ROS studies, live cells were incubated at 37°C and 5% CO2 for 30 min with MitoTracker Red CMXRos (Molecular Probes, Life Technologies Europe, Belgium). Subsequently, all cells were washed twice with PBS and counterstained with 1:500 Hoechst (Thermo Fisher Scientific) for 10 min in the dark at RT. All samples were kept in PBS, in the dark at 4°C, until analyzed with the InCell Analyzer 2000 (GE Healthcare Europe GmbH, Belgium). Data processing was performed using Investigator Tool 1.6.1 (GE Healthcare Europe GmbH) software on which the cells were segmented and fluorescence intensities were determined in individual cells.
 |
Figure S1 Schematic representation of RGD functionalized magnetoliposomes synthesis procedure. The RGD peptide was linked via a sulfhydryl (-SH) group of the cysteine in the cyclic-RGD peptide that couples to the maleimide groups at the distal end of the DSPE-PEG-MAL group. The liposome suspension was incubated with cyclic RGD peptide at a molar ratio of 10:1 overnight. |
 |
Figure S2 Experimental outline of the in vivo imaging experiments. Two separate groups of animals were used for the fluorescence imaging (FLI) and Magnetic Ressonance Imaging (MRI) experiments. |
 |
Figure S3 Representation of high content image analysis for (A) cell viability, (B) membrane damage, (C–D) cell morphology (cell size and skewness) and (E–F) mitochondrial ROS formation and stress levels for BEAS-2B, GRX and SKOV-3 cells labeled with increasing concentrations of anionic (AN) and cRGD-MLs for 24 h via color-coded heat maps. Data are presented as mean ± SD vs control. Acquired data were analyzed using two-way ANOVA. No significance difference was found after incubating the cells with either anionic or RGD-MLs. |
 © 2019 The Author(s). This work is published and licensed by Dove Medical Press Limited. The
full terms of this license are available at https://www.dovepress.com/terms
and incorporate the Creative Commons Attribution
- Non Commercial (unported, 3.0) License.
By accessing the work you hereby accept the Terms. Non-commercial uses of the work are permitted
without any further permission from Dove Medical Press Limited, provided the work is properly
attributed. For permission for commercial use of this work, please see paragraphs 4.2 and 5 of our Terms.
© 2019 The Author(s). This work is published and licensed by Dove Medical Press Limited. The
full terms of this license are available at https://www.dovepress.com/terms
and incorporate the Creative Commons Attribution
- Non Commercial (unported, 3.0) License.
By accessing the work you hereby accept the Terms. Non-commercial uses of the work are permitted
without any further permission from Dove Medical Press Limited, provided the work is properly
attributed. For permission for commercial use of this work, please see paragraphs 4.2 and 5 of our Terms.