
Back to Journals » Drug Design, Development and Therapy » Volume 20
Targeted Degradation of Histone Deacetylase 8 Using Proteolysis Targeting Chimeras Technology: A Promising Approach for Glioblastoma Treatment
Authors Chotitumnavee J  , Seemaung P, Settacomkul R, Sukprasert R, Itoh Y, Suzuki T, Srihirun S, Power C, Vivithanaporn P
Received 19 September 2025
Accepted for publication 10 December 2025
Published 23 January 2026 Volume 2026:20 555228
DOI https://doi.org/10.2147/DDDT.S555228
Checked for plagiarism Yes
Review by Single anonymous peer review
Peer reviewer comments 2
Editor who approved publication: Professor Anastasios Lymperopoulos
Jiranan Chotitumnavee,1 Peeratchai Seemaung,1 Rapeewan Settacomkul,2 Ratchanon Sukprasert,2 Yukihiro Itoh,3 Takayoshi Suzuki,4 Sirada Srihirun,1 Christopher Power,5 Pornpun Vivithanaporn2
1Department of Pharmacology, Faculty of Dentistry, Mahidol University, Bangkok, Thailand; 2Chakri Naruebodindra Medical Institute, Faculty of Medicine Ramathibodi Hospital, Mahidol University, Samut Prakan, Thailand; 3Laboratory for Biomaterials and Bioengineering, Institute of Integrated Research, Institute of Science Tokyo, Tokyo, Japan; 4SANKEN, The University of Osaka, Osaka, Japan; 5Department of Medicine, University of Alberta, Alberta, Canada
Correspondence: Pornpun Vivithanaporn, Chakri Naruebodindra Medical Institute, Faculty of Medicine Ramathibodi Hospital, Mahidol University, Samut Prakan, Thailand, Email [email protected]
Introduction: Histone deacetylase 8 (HDAC8) plays a role in glioblastoma progression, making it a promising therapeutic target. While HDAC8 inhibitors (HDAC8is) suppress glioblastoma growth and prolong survival in animal models, they do not eliminate HDAC8. In contrast, HDAC8-targeting proteolysis-targeting chimera (PROTAC), a selective HDAC8 degrader, induces proteasomal degradation of HDAC8 and thus eliminates all of its functions.
Purpose: In this study, we investigated the antitumor activity and underlying mechanisms of a previously reported HDAC8 PROTAC in glioblastoma cells.
Methods: Cytotoxicity in glioblastoma-derived U-87 MG, A172 and T98G cells and primary human astrocytes (PHA) was assessed via 3-(4,5-dimethylthiazol-2-yl)-2,5-diphenyltetrazolium assays. Live-cell imaging was performed using an Incucyte® Live-Cell Analysis System. Cell proliferation, cell cycle distribution, and apoptosis were analyzed using flow cytometry. HDAC8 and key regulators of cell cycle and apoptosis were quantified via Western blotting.
Results: HDAC8 PROTAC effectively degraded HDAC8 and exhibited cytotoxic and antiproliferative effects in human glioblastoma cells, while demonstrating minimal toxicity in PHA. It induced S-phase arrest and reduced Cdk1, Cdk2, Cdk4, Cdk6, and cyclin B1 expression. It elevated caspase-3/7 activation, downregulated Bcl-2, induced apoptosis, and upregulated key endoplasmic reticulum (ER) stress response proteins, including BiP, XBP1s, CHOP, and p-JNK in U-87 MG glioblastoma cells. The HDAC8 PROTAC demonstrated stronger antitumor activity than HDAC8i and pan-HDACi vorinostat. Moreover, the HDAC8 PROTAC showed selective toxicity toward glioblastoma cells compared to primary human astrocytes.
Conclusion: HDAC8 PROTAC selectively suppressed glioblastoma cell growth and viability by arresting the cell cycle and inducing ER stress-mediated apoptosis via the IRE1α/XBP1s–JNK–CHOP pathway. Hence, HDAC8 PROTAC is a potential therapeutic agent for glioblastoma treatment.
Keywords: HDAC8, PROTAC, HDAC8 degradation, cell cycle arrest, apoptosis, endoplasmic reticulum stress
Introduction
Glioblastoma, the most common and aggressive type of brain cancer, has a poor prognosis and low survival rate with global 5-year survival rate below 17%.1 Standard treatment with temozolomide (TMZ) and radiotherapy provides a median overall survival of only 14.6 months and a progression-free survival (PFS) of 6.9 months.2 Therefore, there is an urgent need to develop novel therapeutic strategies that overcome these challenges and improve patient outcomes.
The histone deacetylases (HDACs) are enzymes that deacetylate histone and nonhistone proteins. HDAC inhibitors (HDACis) have demonstrated anticancer effects against several types of cancer.3–8 Vorinostat (suberoylanilide hydroxamic acid), a pan-HDACi, has shown activity against human glioblastoma U-87 MG cells9 and was the first HDACi to enter clinical trials for glioblastoma treatment. In recurrent glioblastoma, vorinostat monotherapy yielded a 6-month progression free rate of 17% and a median overall survival was 5.7 months,10 while its combination with TMZ and radiotherapy improved survival outcomes in newly diagnosed patients.2,11 However, significant grade 3–4 toxicities—particularly the occurrence of thrombocytopenia, neutropenia, leukopenia, and fatigue—have been attributed to vorinostat’s nonselective effects, highlighting the need for isoform-specific HDACis to reduce adverse events.
HDAC8 is a class I HDAC that deacetylates nonhistone proteins12,13 and its inhibition or knockdown reduce the viability of U-87 MG and T98G glioblastoma cells,14 while HDAC8 inhibition prolonged survival in glioblastoma-bearing mice,15 highlighting the crucial role of HDAC8 in glioblastoma. It is important to note that in addition to its enzymatic activity, HDAC8 has a scaffolding function. It interacts with other transcription factors,16,17 which are implicated in cancer development and progression. In glioblastoma, a scaffolding function of HDAC8 has also been reported, where HDAC8 interacts with the proteasome receptor adhesion regulating molecule 1 (ADRM1), promoting DNA-damage repair and contributing to TMZ resistance.14 Hence, the disruption of catalytic function of HDAC8 by classical inhibitors may not fully inhibit the enzyme’s tumorigenic activity.
To overcome this limitation, we developed an selective HDAC8 Proteolysis Targeting Chimera (HDAC8 PROTAC) (1)18 by linking HDAC8i (2),19 an NCC-149 derived HDAC8-selective inhibitor, to pomalidomide (3), which is commonly used as the E3 ligase recruiting part for PROTACs. As shown in Figure 1, the linker part of HDAC8 PROTAC (1) is connected with an NCC-149 derived HDAC8i (2) at meta- position. A docking study showed linking at one of meta-positions has less steric clashes than othro- and para-positions, leading to the higher degradation activity compared with para-substitution compound.18 This HDAC8 PROTAC was also shown to selectively induce the degradation of HDAC8 via the ubiquitin–proteasome system and to significantly inhibit cell growth in T-cell leukemia (Jurkat) cells.18 This selectivity was confirmed by both enzymatic catalytic assay and cell-based assay.18 The isoform-specific degradation induced by the HDAC PROTAC (1) may result from attaching the linker to the meta- position of the NCC-149 derived HDAC8 inhibitor (2) which allows the ligand to adopt the L-shaped conformation required for selective binding to the HDAC8-specific pocket.20 Since our report of the HDAC8 PROTAC (1), several other HDAC8 PROTACs have also been developed and shown to inhibit both the catalytic and scaffolding functions of HDAC8.21–27 Given the promising results achieved with reported HDAC8 PROTACs, their anticancer effects in HDAC8-driven cancers are being investigated in a range of cancer types, including T-cell leukemia,18,28 breast cancer,29 and neuroblastoma.30 However, the anticancer effects of HDAC8 PROTACs in glioblastoma cells have not been reported. Therefore, in this study, we examined the anticancer effects of our previously developed HDAC8 PROTAC (1)18 in glioblastoma cells.
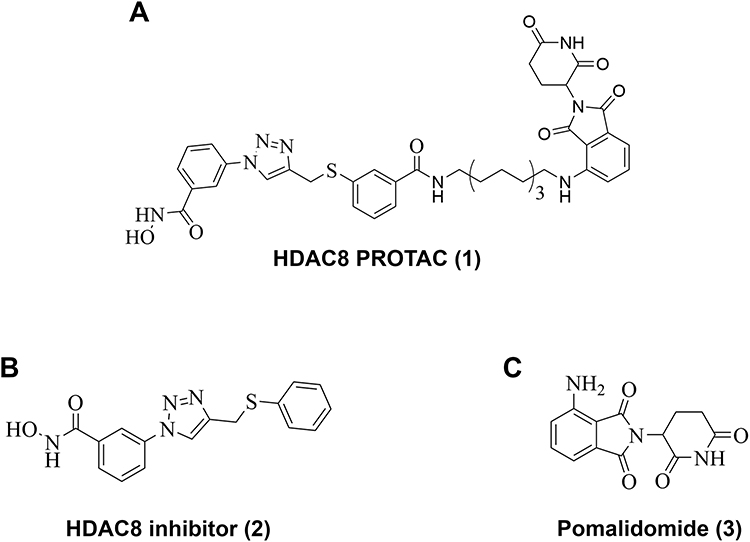 |
Figure 1 Structure of (A) HDAC8 PROTAC (1), (B) HDAC8 inhibitor (2), and (C) Pomalidomide (3). |
Materials and Methods
Chemicals and Reagents
HDAC8 PROTAC (1),18 an NCC-149 derived HDAC8i (2)19 which is an HDAC8-recruiting ligand for HDAC8 PROTAC (1), and vorinostat were synthesized in Dr. Takayoshi Suzuki’s laboratory (SANKEN, The University of Osaka, Japan), following the previously described procedure.18,19 Pomalidomide was purchased from MedChemExpress (USA). All reagents were dissolved in dimethyl sulfoxide (DMSO; Sigma, USA).
Cell Lines and Culture
U-87 MG, A172, and T98G human glioblastoma cell lines, the most used human glioblastoma cell models for aggressive brain tumor, were obtained from the American Type Culture Collection (ATCC, USA). Primary human astrocytes (PHA), representing normal astrocytes, were prepared in Dr. Christopher Power’s laboratory (University of Alberta, Canada) according to protocol number Pro00027660 assigned by Health Research Ethics Board of University of Alberta and consent was obtained by the study participants prior to study commencement. Both cell types were cultured and maintained in Minimum Essential Medium (MEM; Gibco, USA) at 37°C in a humidified atmosphere of 5% CO2. The culture medium was supplemented with 1% sodium pyruvate (Gibco, NY, USA), 1% penicillin–streptomycin (Merck, USA and Gibco, USA), and 10% fetal bovine serum (FBS; Gibco, USA) for the U-87 MG and T98G cells. For PHA, the culture medium was additionally supplemented with 1% L-glutamine (Gibco, USA) and 1% MEM nonessential amino acid (Gibco, USA). A172 cells were cultured and maintained in Dulbecco’s Modified Eagle Medium (DMEM; Gibco, USA) supplemented with 1% penicillin–streptomycin (Merck, USA and Gibco, USA), and 10% fetal bovine serum (FBS; Gibco, USA) at 37°C in a humidified atmosphere of 5% CO2.
Cell Viability Assay
A 3-(4,5-dimethylthiazol-2-yl)-2,5-diphenyltetrazolium (MTT; TCI, Japan) assay was used to investigate the cytotoxicity of HDAC8 PROTAC (1), HDAC8i (2), pomalidomide (3), vorinostat, 0.5% DMSO (control), and/or a combination of HDAC8 inhibitor (2) and pomalidomide (3) in U-87 MG, A172, T98G and PHA. Briefly, each human glioblastoma cell line was seeded into 96-well plates at 20,000 cells/well, while PHA were seeded into 48-well plates at 35,000 cells/well. Following overnight incubation, the cells were treated with the test compounds at the indicated concentrations and incubated at 37°C in a humidified atmosphere of 5% CO2 for 72 h. MTT solution was added, and the cells were incubated for another 2 h. The formazan precipitate was dissolved in DMSO, and the absorbance was subsequently measured at 562 nm using an Epoch microplate spectrophotometer (Biotek®, USA). The IC50 value (the concentration of the test compound that resulted in 50% cell viability) was calculated from the logarithmic plot of the inhibitor concentration ([Inh]) versus the logistic function of the percentage of cell viability using GraphPad Prism version 10.3 (GraphPad Software LLC, USA).
Analysis of Cell Proliferation
CytoLabeling Deep Red Reagent (ab176736, Abcam, USA) was used to assess the antiproliferative effect of the test compounds. The CytoLabeling Deep Red Reagent permeates through the cell membrane and is hydrolyzed by intracellular esterases, releasing a fluorescent compound in the process. The fluorescent compound covalently binds to intracellular proteins, which allows it to be transferred to daughter cells. As the cells that contain the compound proliferate, the mean fluorescence intensity decreases. Therefore, an intense fluorescent signal indicates a lack of proliferation. Briefly, U-87 MG cells were labeled with CytoLabeling Deep Red Reagent in phosphate-buffered saline (PBS; Cytiva, USA). The excess reagent was washed away using PBS containing 2% FBS. Stained cells were seeded into 96- and 6-well plates at 20,000 and 200,000 cells/well, respectively. Following overnight incubation at 37°C in a humidified atmosphere of 5% CO2, the cells were treated with the test compounds at the indicated concentrations. The cells in the 96-well plates were subsequently incubated in an Incucyte® Live-Cell Analysis System (Sartorius, Germany) to capture the real-time fluorescence shift, with images captured every 12 h for 144 h. To confirm the fluorescence shift, the single-cell mean fluorescence intensity in the cells cultured in the 6-well plates was measured at 72 h post treatment using a BD AccuriTM C6 plus flow cytometer (BD Biosciences, USA) and analyzed using FlowJo software (BD Biosciences, V10.8.1). A minimum of 10,000 events were analyzed per sample. The percentage of fluorescence intensity was calculated and compared to that in the DMSO-treated group (control).
Cell Cycle Analysis
To examine the effects of the test compounds on the cell cycle distribution of U-87 MG cells, cells were seeded into 6-well plates at 200,000 cells/well and incubated at 37°C in a humidified atmosphere of 5% CO2 overnight. The cells were subsequently cultured in MEM without supplements overnight to induce cell synchronization and then treated with the test compounds at the indicated concentrations. At 72 h post treatment, the cells were trypsinized, fixed with 70% ethanol on ice for 30 min, washed with PBS, and stained with a propidium iodide (PI)/RNase staining solution (BD Biosciences, USA). The DNA content was analyzed using a BD FACSMelody™ Cell Sorter flow cytometer (BD Biosciences, USA) and FlowJo software (BD Biosciences, V10.8.1, USA).
Detection of Apoptotic Cells
To investigate the capacity of the test compounds to induce apoptosis, U-87 MG cells were seeded into 6-well plates at 150,000 cells/well and incubated at 37°C in a humidified atmosphere of 5% CO2 for 48 h. The cells were subsequently treated with the test compounds at the indicated concentrations. At 72 h post treatment, the supernatant was collected, and the cells were trypsinized. The supernatant and detached cells were centrifuged at 1,400 rpm for 5 min. The cells were then washed twice with Annexin V binding buffer (BD Biosciences, USA). The cells were stained with Annexin V-PE and 7-amino actinomycin D in the dark for 15 min. Single cells were analyzed using a BD FACSMelody™ Cell Sorter flow cytometer (BD Biosciences, USA) and FlowJo software (BD Biosciences, V10.8.1, USA). A minimum of 10,000 events were analyzed per sample. The percentages of early and late apoptotic cells were summed to determine the overall percentage of apoptotic cells.
Detection of Caspase-3 and Caspase-7 Activity
U-87 MG cells were seeded into 96-well black plates with a clear flat bottom at 25,000 cells/well. Following overnight incubation at 37°C in a humidified atmosphere of 5% CO2, the cells were stained with Caspase-3/7 Dye (Sartorius, Germany), treated with the test compounds at the indicated concentrations, and incubated in an Incucyte® Live-Cell Analysis System (Sartorius, Germany). Live-cell images were captured every 3 h until 72 h. Red fluorescence (indicative of caspase-3/7 activity) was analyzed using the Incucyte® S3 Live-Cell Analysis platform.
Western Blotting
To determine the effect of HDAC8 PROTAC (1) on the level of HDAC8, U-87 MG cells were seeded into 60 mm dishes at 700,000 cells/well and incubated at 37°C in a humidified atmosphere of 5% CO2 overnight. The cells were then incubated with HDAC8 PROTAC (1) at either 10 μM for different lengths of time, including 0, 4, 8, 16, and 24 h., or at different concentrations for 24 h. To determine levels of proteins involved in cell cycle regulation, including Cyclin-dependent kinase (Cdk) 1, Cdk2, Cdk4, Cdk6, cyclin B1, cyclin E, and cyclin A2, U-87 MG cells were seeded at 700,000 cells/well, incubated overnight at 37°C in a humidified atmosphere of 5% CO2, incubated in MEM without supplements overnight, and then treated with HDAC8 PROTAC (1), HDAC8i (2), or pomalidomide (3) at 10 μM for 72 h. To detect proteins involved in apoptosis, autophagy, DNA damage, ER stress, and the mitogen-activated protein kinase (MAPK) pathway, including B-cell lymphoma 2 (Bcl-2), Bcl-2-associated X protein (Bax), microtubule-associated protein 1A/1B-light chain 3 (LC3), spliced X—box binding protein 1 (XBP1s), binding immunoglobulin protein (BiP), C/EBP homologous protein (CHOP), c-Jun-N-terminal kinase (JNK), phosphorylated JNK (p-JNK), extracellular signal-regulated kinase (ERK), and phosphorylated ERK (p-ERK), U-87 MG cells were seeded at 400,000 cells/well and incubated at 37°C in a humidified atmosphere of 5% CO2 overnight. Then, the cells were treated with the test compounds at the indicated concentrations for 24 or 72 h.
All the cells were then harvested, treated with lysis buffer (20 mM Tris, 1% NP-40, 50 mM NaCl) and a protease inhibitor cocktail (#539134, MilliporeSigma, USA), and centrifuged at 10,000 rpm for 10 min at 4°C. The protein concentration of each lysate was determined using a bicinchoninic acid protein assay Kit (#23227, Invitrogen, USA). Equivalent amounts of protein from each lysate were separated in 10% SDS-polyacrylamide gels and transferred to nitrocellulose membranes. After blocking with skimmed milk (1% for HDAC8, CdK4, Cdk6, cyclin B1, cyclin E, Bcl-2, Bax, LC3, XBP1s, BiP, and CHOP, and 5% for other proteins), the membranes were probed with primary antibodies. The antibodies and probing conditions are shown in Table 1.
 |
Table 1 List of Antibodies and Dilution of Probing for Western Blotting Analysis |
The probed membranes were washed three times with Tris-buffered saline containing 0.5% Tween 20 and incubated with a secondary antibody linked to horseradish peroxidase. The proteins were visualized using a ClarityTM Western ECL substrate (#170-5060, BioRad, USA). The concentration of the test compound that resulted in 50% degradation (DC50) was determined from the logarithmic plot of the concentration [Inh] versus the logistic function of % degradation using GraphPad Prism version 10.3 (GraphPad Software LLC).
Statistical Analysis
Data are presented as mean ± standard deviation (S.D.) values calculated from five independent experiments. All statistical analyses were performed using GraphPad Prism version 10.3 (GraphPad Software LLC). Data distribution was evaluated visually using Q-Q plots. Differences between experimental groups were determined by one-way analysis of variance using the Tukey–Kramer post hoc test for multiple comparisons. A p-value < 0.05 indicates statistical significance, a p-value < 0.01 indicates a highly significant result, and a p-value < 0.001 indicates an extremely significant result.
Results
HDAC8 PROTAC (1) Reduced the Viability of Glioblastoma Cells
To investigate the potential of HDAC8 PROTAC (1) as an anticancer agent for glioblastoma treatment, we assessed the viability of U-87 MG, A172, and T98G cells treated for 72 h with HDAC8 PROTAC (1). The results showed that HDAC8 PROTAC (1) reduced cell viability in a dose-dependent manner. The half-maximal inhibitory concentration of HDAC8 PROTAC (1) was 6.12 ± 1.52 μM, 6.25 ± 1.83 μM, and 22.68 ± 10.36 μM in U-87 MG, A172, and T98G cells, respectively (Figures 2A). In U-87 MG cells, its cytotoxic effect was more potent than that of HDAC8i (2) and vorinostat. The half-maximal inhibitory concentration of HDAC8 PROTAC (1) was approximately 10 times more potent than HDAC8i (2) and roughly three times more potent than vorinostat, while pomalidomide (3) showed no cytotoxic effect (Figure 2B).
 |
Figure 2 HDAC8 PROTAC (1) reduced glioblastoma cells viability. (A) Dose-response curves of the HDAC8 PROTAC (1) effects on U-87 MG, A172, and T98G glioblastoma cell viability after 72-h exposure. (B) Dose-response curves of the HDAC8 PROTAC (1), HDAC8i (2), pomalidomide (3), and vorinostat effects on U-87 MG cell viability after 72-h exposure. To ensure consistency and enable direct comparison, the same dose-response curve representing cell viability induced by 10 μM HDAC8 PROTAC (1) is shown in both Figure 2A and B. The half-maximal inhibitory concentrations (IC50) of these compounds were the mean ± S.D. of five independent experiments. (C) U-87 MG cell viability percentage after treatment with HDAC8 PROTAC (1), HDAC8 inhibitor (2), pomalidomide (3), and a combination of HDAC8 inhibitor (2) and pomalidomide (3) at 10 µM for 72 h. Data are represented as the mean ± S.D. of five independent experiments. (*** p < 0.001). |
Because HDAC8 PROTAC (1) includes HDAC8i (2) (an HDAC8 ligand), linker, and pomalidomide (3) (an E3 ligase ligand), we investigated whether the observed cytotoxicity was specifically attributable to HDAC8 PROTAC (1) or its components. To this end, we co-treated U-87 MG cells with HDAC8i (2) and pomalidomide (3) (10 μM each) (Figure 2C). Only HDAC8 PROTAC (1) had a significant cytotoxic effect; HDAC8i (2), pomalidomide (3), and the combination of these compounds had no effect on cell viability. These results suggest that the HDAC8 PROTAC has a potent cytotoxicity effect in the U-87 MG cells. This effect may be due to the function of HDAC8 PROTAC to degrade HDAC8 in glioblastoma cells.
HDAC8 PROTAC (1) Showed Selective Cytotoxicity in Glioblastoma Cells Compared to PHA
To assess the selective cytotoxicity of HDAC8 PROTAC (1), we conducted cell viability assays in which U-87 MG cells and PHA were treated with the test compounds. As shown in Figure 3, treatment with HDAC8 PROTAC (1) at 5 μM and 10 μM significantly reduced the viability of the U-87 MG cells, whereas it had a minimal effect on the viability of the PHA. Compared with the U-87 MG cells, the PHA exhibited approximately 2-fold and 3-fold greater viability after treatment with HDAC8 PROTAC (1) at 5 μM and 10 μM, respectively. This indicates that HDAC8 PROTAC (1) is selectively cytotoxic toward glioblastoma cells. However, HDAC8i (2), and pomalidomide (3) at 10 μM were found to be no difference in cell viability between the PHA and the glioblastoma cells, suggesting that these compounds exert nonselective cytotoxic effects. Additionally, treatment with vorinostat at 10 μM led to reduced viability in both U-87 MG cells and PHA, with the viability being only about 1.5-fold higher in the PHA compared to that in the U-87 MG cells, indicating lower cancer cell selectivity than HDAC8 PROTAC (1). Hence, HDAC8 PROTAC (1) showed greater selective cytotoxicity in glioblastoma cells compared to PHA.
 |
Figure 3 HDAC8 PROTAC (1) showed limited cytotoxicity against primary human astrocytes. The graph showed percentage of cell viability of U-87 MG, glioblastoma cells, and primary human astrocytes (normal cell) after 72-h treatment with the HDAC8 PROTAC (1), HDAC8i (2), pomalidomide (3), and vorinostat at indicated concentrations. Data are represented as the mean ± S.D. of five independent experiments. (** p < 0.01, *** p < 0.001). |
HDAC8 PROTAC (1) Inhibited Glioblastoma Cell Proliferation
To investigate whether HDAC8 PROTAC (1) inhibits glioblastoma cell proliferation, live-cell imaging and U-87 MG cells stained with CytoLabeling deep red reagent were performed by flow cytometry.
The cells were incubated with 10 μM of HDAC8 PROTAC (1), HDAC8i (2), pomalidomide (3), or vorinostat for predetermined times. Representative bright-field images and fluorescence images after treatment with HDAC8 PROTAC (1) are shown in Figure 4A and B, respectively. A time-dependent decrease in the number of U-87 MG cells was observed, while the fluorescence intensity remained strong following treatment with HDAC8 PROTAC (1). This phenomenon was not observed in cells treated with HDAC8i (2) or pomalidomide (3). Our analysis of the vorinostat-treated cells showed that the number of cells was reduced, and this was accompanied by a slight decrease in the fluorescent signal (Supplementary Figure 1 and 2). These results suggest that HDAC8 PROTAC (1) inhibited the proliferation of U-87 MG cells.
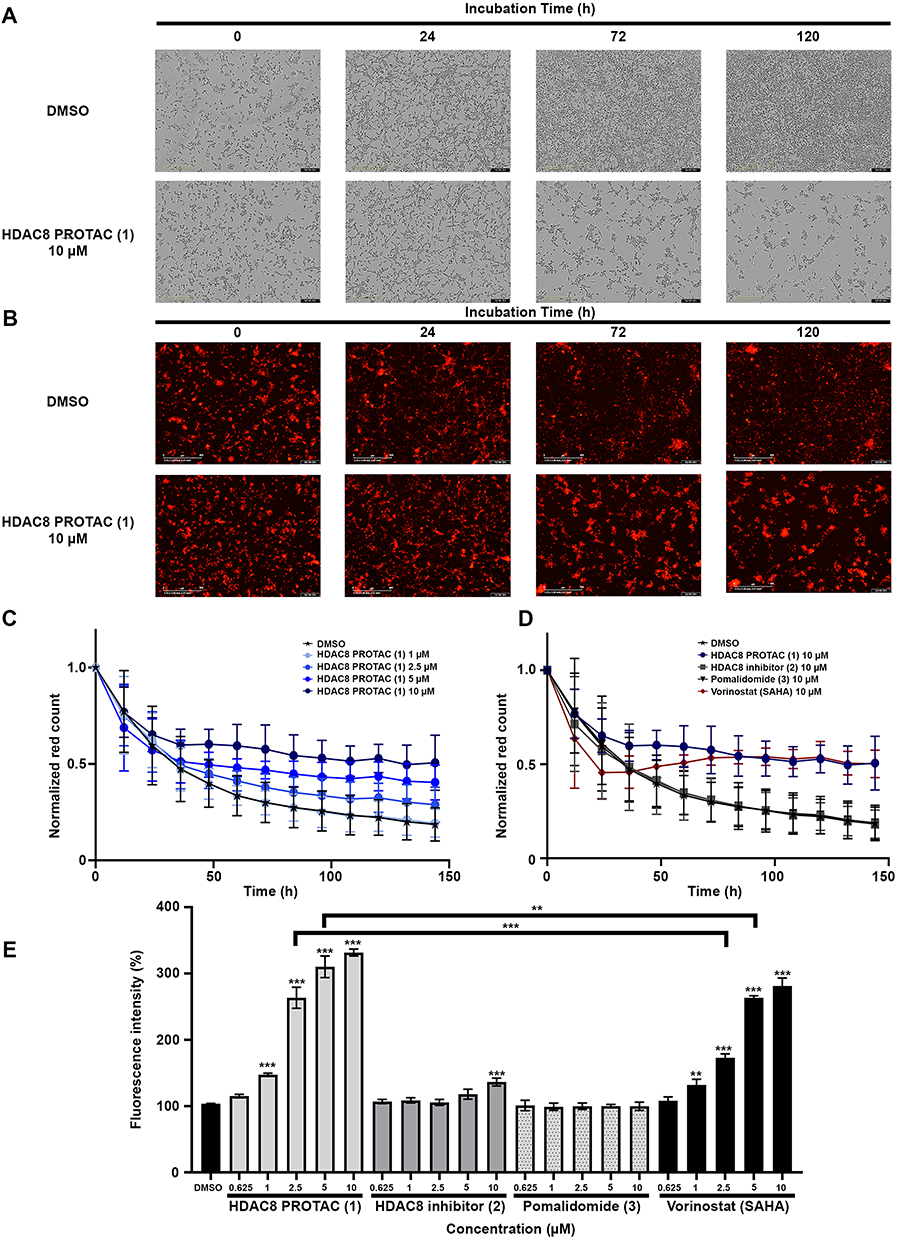 |
Figure 4 HDAC8 PROTAC (1) inhibited cell proliferation in glioblastoma U-87 MG cells. (A) Representative bright-field images and (B) Representative fluorescence images of U-87 MG cells after treatment with 10 µM HDAC8 PROTAC (1) at indicated time point captured via Incucyte®. The red fluorescence was calculated via Incucyte® analysis software following (C) treatment with HDAC8 PROTAC (1) at indicated concentrations and (D) treatment with HDAC8 PROTAC (1), HDAC8i (2), pomalidomide (3), and vorinostat at 10 µM every 12 h for 144 h. (E) Percentage of mean fluorescence intensity after treatment with the HDAC8 PROTAC (1), HDAC8i (2), pomalidomide (3), and vorinostat at the indicated concentration for 72 h analyzed by flow cytometry. Data are represented as the mean ± S.D. of five independent experiments. (** p < 0.01, *** p < 0.001). |
When we analyzed the effect of each treatment using Incucyte® analysis software (Figure 4C–D), the results showed that the number of cells with high fluorescence intensity was not reduced after 36 h of treatment with HDAC8 PROTAC (1) at 5 and 10 μM (Figure 4C) and that among all the test compounds, treatment with HDAC8 PROTAC (1) led to the highest number of cells with high fluorescence until before 84 h of treatment, after that time the effect of HDAC8 PROTAC (1) was equivalent to vorinostat at 10 μM (Figure 4D). These results are consistent with the flow cytometry results (Figure 4E). After 72 h of treatment, the cells treated with ≥ 1 μM HDAC8 PROTAC (1) showed significantly higher fluorescence than the vehicle-treated (control) cells. The cells treated with HDAC8 PROTAC (1) at 2.5 and 5 μM showed a significantly higher fluorescence intensity than the cells treated with 2.5 and 5 μM vorinostat, whereas HDAC8i (2) and pomalidomide (3) did not show an antiproliferative effect in the U-87 MG cells.
HDAC8 PROTAC (1) Mediated S-Phase Arrest in Glioblastoma Cells by Controlling Cdk and Cyclin Levels
To elucidate the mechanism underlying the antiproliferative effects of HDAC8 PROTAC (1), we investigated the effect of HDAC8 PROTAC (1) on cell cycle distribution and the proteins that regulate the cell cycle. A flow cytometric analysis of PI-stained cells revealed that HDAC8 PROTAC (1) increased the proportion of U-87 MG cells in the S Phase in a dose-dependent manner. In contrast, treating cells with HDAC8i (2), pomalidomide (3), or vorinostat at 10 µM did not result in any cell cycle arrest (Figure 5A). There was a significantly higher percentage of cells in the S phase in the samples that were treated with 10 μM HDAC8 PROTAC than in those treated with DMSO only (Figure 5B). Vorinostat increased the size of the sub-G1 population, indicating its cytotoxic effect (Figure 5C).
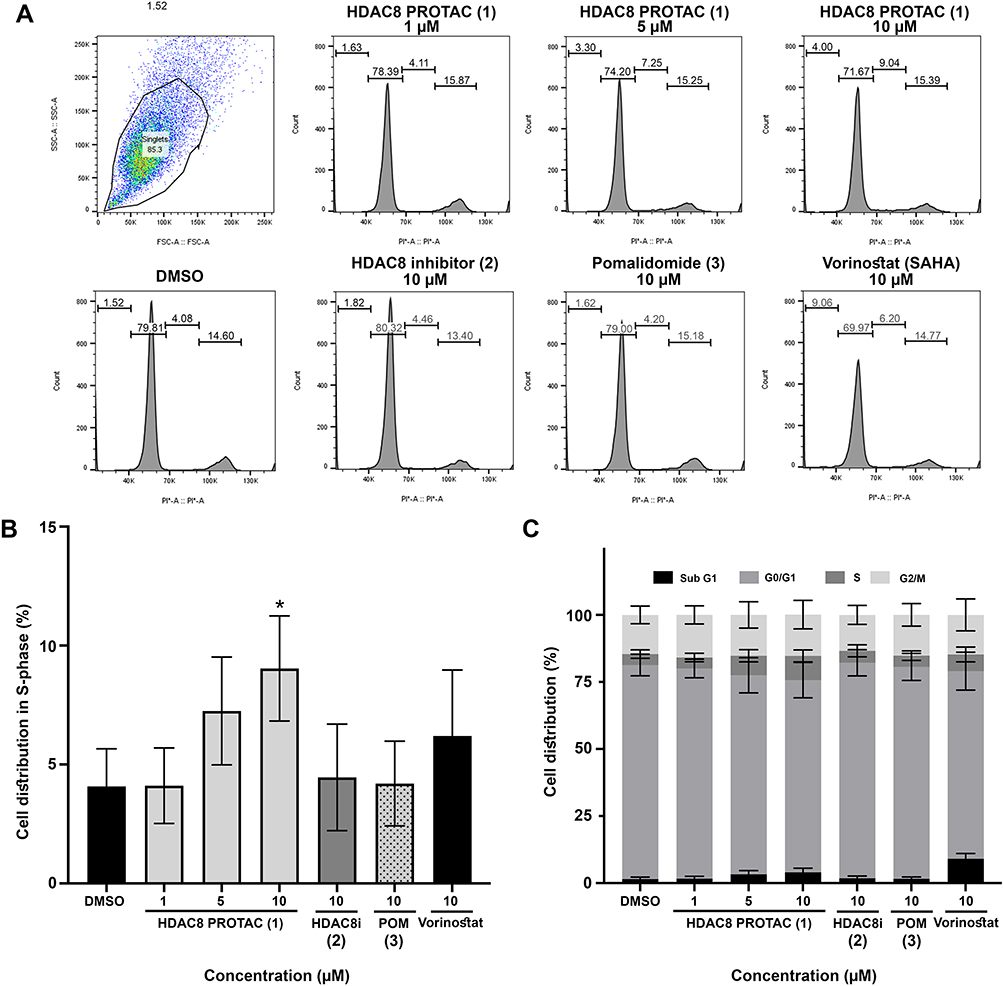 |
Figure 5 HDAC8 PROTAC (1) induced S-phase cell cycle arrest in glioblastoma cells. (A) Representative histograms of cell cycle progression (B) bar graphs of glioblastoma cell distribution in S-phase (C) bar graphs of glioblastoma cell cycle distribution after 72-h treatment with the HDAC8 PROTAC (1), HDAC8 inhibitor (2), pomalidomide (3), and vorinostat at indicated concentrations. Data are represented as the mean ± S.D. of five independent experiments. (* p < 0.05). |
To evaluate how HDAC8 PROTAC causes cell cycle arrest, the levels of HDAC8 and proteins associated with the cell cycle were assessed via Western blot after 72 h of treatment with HDAC8 PROTAC (1), HDAC8i (2), and pomalidomide (3) at 10 μM. The level of HDAC8 was lower in the cells treated with HDAC8 PROTAC (1). Among the treatments, only 10 μM HDAC8 PROTAC (1) resulted in significantly lower levels of Cdk1, Cdk2, Cdk4, and Cdk6, which are essential for cell cycle progression. The cells that were treated with HDAC8 PROTAC (1) at 10 μM also exhibited reduced cyclin B1 levels, a protein necessary for mitotic entry or the M phase; however, their cyclin A2 and cyclin E levels were unaffected (Figure 6). These results indicate that HDAC8 PROTAC (1) impacted on cell cycle regulation and mediated S-phase arrest by regulating the expression of Cdks and cyclins.
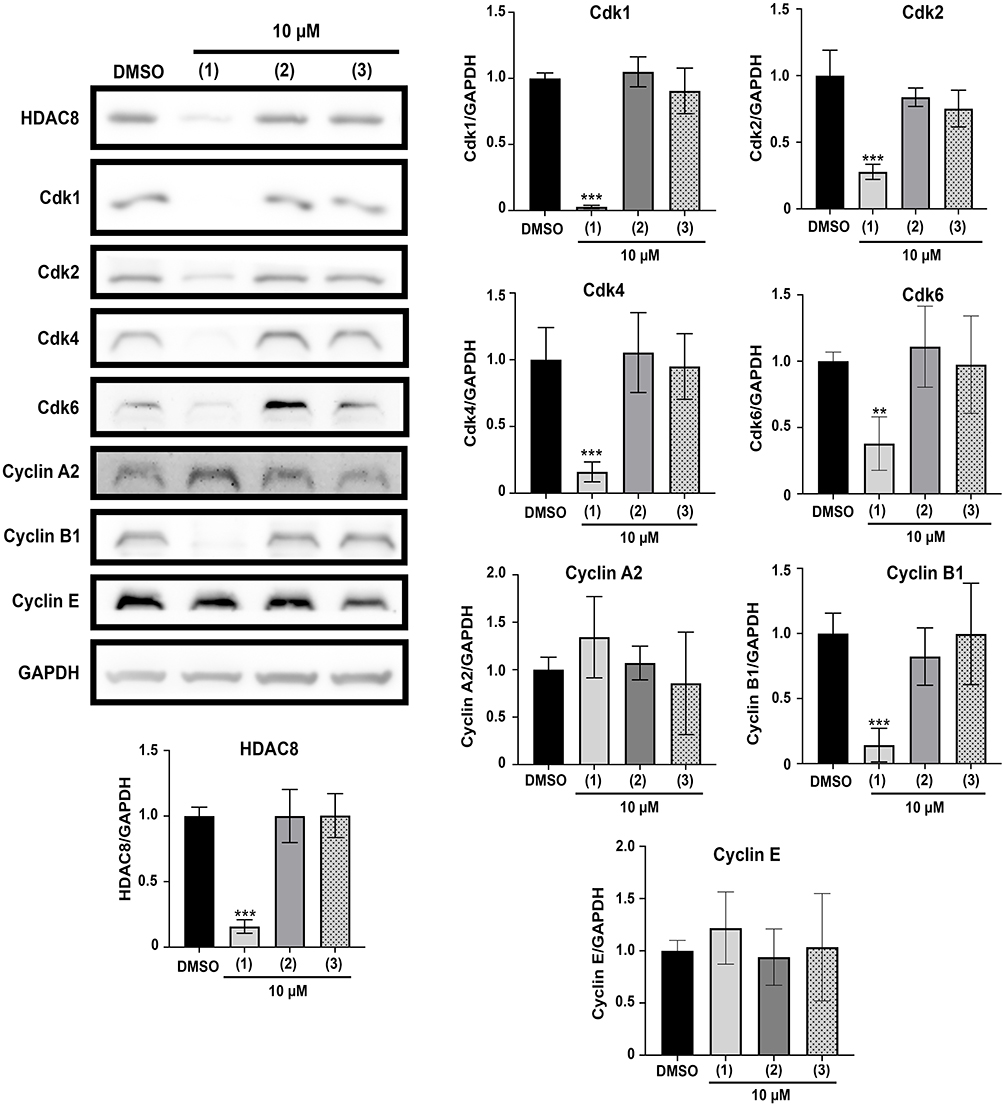 |
Figure 6 HDAC8 PROTAC (1) downregulated Cdk1, Cdk2, Cdk4, Cdk6, and Cyclin B1 in glioblastoma cells. Representative Western blots and bar graphs of HDAC8, Cdks, and cyclins compared to GAPDH after 72-h treatment with the HDAC8 PROTAC (1), HDAC8 inhibitor (2), and pomalidomide (3) at 10 μM. Data are represented as the mean ± S.D. of five independent experiments. (** p < 0.01, *** p < 0.001). |
HDAC8 PROTAC (1) Induced Apoptosis in Glioblastoma Cells
To determine whether the cytotoxic effect of HDAC8 PROTAC (1) in glioblastoma cells was mediated by the induction of apoptosis, we performed a flow cytometric analysis and live-cell imaging of cells treated with the test compounds. The flow cytometric analysis revealed that HDAC8 PROTAC (1) induced more apoptosis than DMSO alone (Figure 7A) and the other compounds (Figure 7B) after treatment with 10 µM for 72 h. At the same concentration, HDAC8 PROTAC (1) induced 1.3-fold more apoptosis than vorinostat (Figure 7B–C). HDAC8 PROTAC (1) also caused necrosis, albeit at a lower level (Figure 7D).
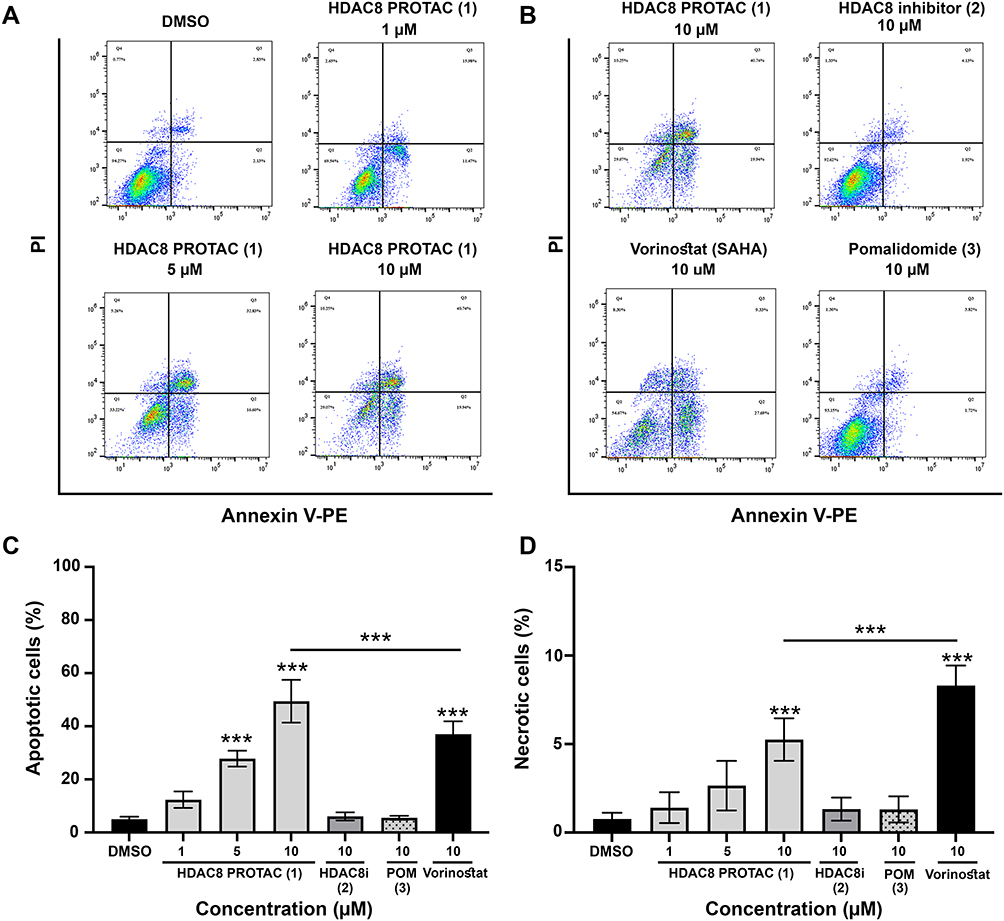 |
Figure 7 HDAC8 PROTAC (1) induced apoptosis in U-87 MG cells. Representative flow cytometric dot plots of Annexin V-positive cells after 72-h treatment with (A) HDAC8 PROTAC (1) at indicated concentrations and (B) after 72-h treatment with 10 μM of HDAC8 PROTAC (1), HDAC8i (2), pomalidomide (3), and vorinostat for 72 h. To ensure consistency and enable direct comparison, the same flow cytometry image representing apoptosis induced by 10 μM HDAC8 PROTAC (1) is shown in both panels A and B. (C) percentage of apoptotic cells and (D) percentage of necrotic cells. Data are represented as the mean ± S.D. of five independent experiments. (*** p < 0.001). |
Caspase-3 and caspase-7 play crucial roles in apoptosis, undergoing cleavage and activation during the apoptotic process. To confirm the effect of HDAC8 PROTAC (1) on the apoptotic pathway, we used live-cell imaging to detect caspase-3 and caspase-7 activity. The results showed that HDAC8 PROTAC (1) increased caspase-3/7 activity in a dose- and time-dependent manner, as reflected by the increase in fluorescence intensity (Figures 8A and B). Moreover, HDAC8 PROTAC (1) was a more potent inducer of caspase-3/7 activation than vorinostat. In contrast, neither HDAC8i (2) nor pomalidomide (3) induced caspase-3/7 activation (Figure 8C). These results indicate that HDAC8 PROTAC (1) triggered apoptosis in glioblastoma cells.
 |
Figure 8 HDAC8 PROTAC (1) activated caspase3/7 in U-87 MG cells. (A) Graph showed fluorescence intensity representing the activation of caspase-3/7 in U-87 MG cells every 3 h until 72 h of treatment with HDAC8 PROTAC (1) at indicated concentrations. (B) Representative fluorescence images of activated caspase-3/7 after treatment with DMSO and HDAC8 PROTAC (1) at 10 μM every 6 h until 24 h of treatment. (C) Graph showed fluorescence intensity representing the activation of caspase-3/7 in U-87 MG cells every 3 h until 72 h of treatment with 10 μM of HDAC8 PROTAC (1), HDAC8i (2), pomalidomide (3), and vorinostat. Data are represented as the mean ± S.D. of five independent experiments. |
Capacity of HDAC8 PROTAC (1) to Degrade HDAC8 in Glioblastoma Cells
To evaluate whether these effects are attributable to the HDAC8 degradation activity in the U-87 MG glioblastoma cell line, we conducted a Western blot analysis to assess the level of HDAC8 in cells treated with HDAC8 PROTAC (1) at varying concentrations or for different times. The results demonstrated that HDAC8 PROTAC (1) reduced the level of HDAC8 in U-87 MG cells in a time- and dose-dependent manner (Figures 9A–C), with a DC50 of 77.7 ± 24.12 nM (Figure 9D). To confirm that HDAC8 PROTAC (1) mediated HDAC8 degradation, U-87 MG cells were treated with HDAC8 PROTAC (1), HDAC8i (2), pomalidomide (3), or a combination of HDAC8i (2) and pomalidomide (3). As shown in Figures 9E and F, HDAC8 PROTAC (1) effectively decreased the level of HDAC8 in U-87 MG cells, whereas neither HDAC8i (2) or pomalidomide (3) alone nor the combination of these compounds reduced the level of HDAC8. These results indicate that the observed HDAC8 degradation was mediated by HDAC8 PROTAC (1), and not by its individual structural components. In addition, this degradation activity may contribute to cytotoxic effect and antiproliferative effect of HDAC8 PROTAC (1) in human glioblastoma cells.
 |
Figure 9 HDAC8 PROTAC (1) reduced level of HDAC8 in U-87 MG cells. (A) A representative Western blot detection of HDAC8 level in U-87 MG cells after treatment with HDAC8 PROTAC (1) at 10 µM for 0, 4, 8, 16, and 24 h. (B) A representative Western blot detection of HDAC8 level in U-87 MG cells after treatment with the HDAC8 PROTAC (1) at 0.001–10 µM for 24 h. (C) Optical density measurement of HDAC8 level compared to GAPDH level from Figure 9A. (D) A half-maximal degradation concentration (DC50) value was determined using a dose-response curve between HDAC8 PROTAC (1) concentration and the optical density of HDAC8 levels in blots. The DC50 value was the mean ± S.D. of five independent experiments. (E) A representative Western blot detection of HDAC8 levels in U-87 MG cells after treatment with HDAC8 PROTAC (1), the HDAC8i (2), pomalidomide (3), and the combination of the HDAC8i (2) with pomalidomide (3) (F) Optical density measurement of HDAC8 levels compared to GAPDH levels from Figure 9E. Data are represented as the mean ± S.D. of five independent experiments. (*** p < 0.001). |
HDAC8 PROTAC (1) Reduced Bcl-2 and Triggered ER Stress in Glioblastoma Cells
Since apoptosis is regulated by proteins from the Bcl-2 family, we next assessed the levels of pro-survival and pro-apoptotic Bcl-2 family proteins via Western blot analysis. As shown in Figure 10, treating glioblastoma cells with HDAC8 PROTAC (1) at 10 µM significantly decreased the levels of Bcl-2 and HDAC8 but had no effect on the level of Bax. Furthermore, the level of LC3, a key regulator of autophagy, was not affected. These results suggest that HDAC8 PROTAC (1) induced apoptosis by downregulating Bcl-2 without affecting autophagy in glioblastoma cells.
 |
Figure 10 HDAC8 PROTAC (1) decreased the expression of Bcl-2, an anti-apoptotic protein, in U-87 MG cells. Representative Western blots and bar graphs of HDAC8, Bcl-2, Bax and LC3 compared to GAPDH after 72-h treatment with the HDAC8 PROTAC (1), HDAC8i (2), and pomalidomide (3) at 10 μM. Data are represented as the mean ± S.D. of five independent experiments. (*** p < 0.001). |
The ER regulates protein folding and modification in cells, and disrupting the ER activates the unfolded protein response and triggers apoptosis. To determine whether ER stress also contributes to the apoptosis induced by HDAC8 PROTAC (1), we examined the expression of ER stress sensors via Western blot analysis. As shown in Figure 11, the levels of BiP and XBP1s, which are markers of ER stress and inositol-requiring enzyme 1 alpha (IRE1α) activation, respectively, were visibly increased following 72 h of treatment with HDAC8 PROTAC (1). Furthermore, the downstream ER stress mediator CHOP was upregulated in cells treated with HDAC8 PROTAC (1). In contrast, cells treated with HDAC8i (2) or pomalidomide (3) did not exhibit any changes in their levels of XBP1s, BiP, and CHOP. These results indicate that HDAC8 PROTAC (1) activated the IRE1α/XBP1s-mediated ER stress pathway and increased the level of CHOP in glioblastoma cells.
 |
Figure 11 HDAC8 PROTAC (1) increased the expression of XBP1s, BiP, and CHOP, protein-related to ER stress in U-87 MG cells. Representative Western blots and bar graphs of XBP1s, BiP, and CHOP after 72-h treatment with the HDAC8 PROTAC (1), HDAC8i (2), and pomalidomide (3) at 10 μM compared to GAPDH. Data are represented as the mean ± S.D. of five independent experiments. (** p < 0.01, *** p < 0.001). |
HDAC8 PROTAC (1) Activated the JNK Pathway in Glioblastoma Cells
Since IRE1α promotes apoptosis by activating the intracellular MAPK signaling pathway, including JNK, we next examined the involvement of this pathway in ER stress–induced apoptosis mediated by HDAC8 PROTAC (1). To this end, we analyzed p-JNK and p-ERK via Western blotting (Figure 12). The results showed that the level of p-JNK/JNK was significantly higher following 24 h of treatment with HDAC8 PROTAC (1). In contrast, there was no difference in the level of p-ERK/ERK after treatment with HDAC8 PROTAC (1), HDAC8i (2), pomalidomide (3), or DMSO only. These results imply that HDAC8 PROTAC (1) activated the IRE1α/XBP1s-mediated ER stress pathway, leading to the activation of the JNK intracellular signaling pathway.
 |
Figure 12 ER stress-induced apoptosis in U-87 MG cells caused by the HDAC8 PROTAC (1) through the activation of JNK. Representative Western blots and bar graphs of HDAC8, p-JNK/JNK, and p-ERK/ERK after 24-h treatment with the HDAC8 PROTAC (1), HDAC8i (2), and pomalidomide (3) at 10 μM. Data are represented as the mean ± S.D. of five independent experiments. (*** p < 0.001). |
Discussion
In this study, HDAC8 PROTAC (1) exhibited higher cytotoxicity than the conventional HDAC8 inhibitor (2) and vorinostat in glioblastoma cells, an effect that was primarily mediated by the induction of ER stress-mediated apoptosis via the IRE1α/XBP1s–JNK–CHOP pathway (Figure 13). To the best of our knowledge, this is the first time that HDAC8 PROTAC has demonstrated such activity. In addition, HDAC8 PROTAC (1) downregulated Cdk1, Cdk2, Cdk4, Cdk6, and cyclin B1, thereby effectively inhibiting cell proliferation and inducing S-phase arrest in glioblastoma cells. Notably, PHA were not susceptible to HDAC8 PROTAC (1), our results highlight its potential as a selective and targeted therapy for glioblastoma.
 |
Figure 13 Proposed mechanism of HDAC8 PROTAC (1) in U-87 MG glioblastoma cells. HDAC8 degradation mediated by HDAC8 PROTAC (1) selectively caused cytotoxic toward glioblastoma cells and inhibited glioblastoma cell growth by reducing Cdk1, Cdk2, Cdk4, Cdk6, and cyclin B1 leading to S-phase arrest in glioblastoma cells. In addition, the HDAC8 PROTAC (1) also activates IRE1α observed by increasing of BiP and XBP1s level. Then, the activated IRE1α/XBP1s signal activates JNK as shown by the increase of phosphorylated JNK. Next, phosphorylated JNK induces CHOP which downregulates Bcl-2 protein leading to apoptosis in U87-MG cells. Downward red arrow refers to downregulate of protein level, while upward red arrow refers to upregulate of protein level. This figure was created in BioRender. Chotitumnavee, (J) (2025) https://BioRender.com/j5c7j5q. |
The finding that HDAC8 PROTAC (1) effectively reduced the level of HDAC8 is consistent with findings from other studies that have shown that HDAC8 PROTACs reduce HDAC8 levels in various malignant cells, including hematopoietic cancer18,25–27 and solid tumor cancer cells.21–23,26,27 The HDAC8 degradation mediated by HDAC8 PROTAC (1) in glioblastoma cells was in nanomolar range which was comparable to the previously reported in Jurkat cells.18 Furthermore, HDAC8 PROTAC (1) mediated its cytotoxic effect in glioblastoma cells in the micromolar range, similar to the effects of other reported HDAC8 PROTACs in solid tumor cells. For example, HDAC8 PROTAC z16, developed by Zhao et al, has a cytotoxic effect in lung cancer cells (A549 cells) and colon cancer cells (HCT116 cells), with IC50 values of 7.7 μM and 1.4 μM, respectively.27 In addition, HDAC8 PROTAC SZUH280 is reportedly cytotoxic in lung cancer cells (A549 cells), with an IC50 of 9.55 μM.23
Interestingly, HDAC8 PROTAC (1) was found to be more potent in terms of its cytotoxicity and antiproliferative effects than vorinostat and HDAC8i (2) in U-87 MG cells. This finding suggests that the noncatalytic functions of HDAC8 are critical to glioblastoma progression, which aligns with previous studies that have shown that both the catalytic and noncatalytic functions of HDAC8 contribute to cancer development. For example, HDAC8 forms a complex with STAT3, a transcription repressor, to suppress the activity of the Bcl-2-modifying factor (Bmf) gene and interfere with HDAC1-triggered Bmf-mediated apoptosis in colon cancer.17 HDAC8 has also been shown to interact with enhancer of zeste homolog 2 protein, promoting insulin resistance and β-catenin activation in nonalcoholic fatty liver steatohepatitis–associated hepatocellular carcinoma progression.31 In triple-negative breast cancer (TNBC) cells, HDAC8 interacts with yin yang 1 promotes deacetylation of YY1 enabling YY1 to bind to the p53 promoter and enhance mutant p53 transcription, thereby contributing to oncogenic process in TNBC.32 In addition, HDAC8 cooperates with the mothers against decapentaplegic homolog 3/4 complex to suppress sirtuin7 and promote cell survival and migration in breast cancer cells.33 In glioblastoma cells, HDAC8 interacts with ADRM1 to regulate the O-6-methylguanine-DNA methyltransferase (MGMT) DNA repair protein and relates to TMZ resistance.14 This is the first report of HDAC8 potentially demonstrating noncatalytic function in glioblastoma cell survival, and further studies are required to validate this finding and elucidate the molecular mechanisms underlying the potential noncatalytic functions of HDAC8 in glioblastoma progression. Given that our findings indicate that both the catalytic and noncatalytic functions of HDAC8 are important for glioblastoma progression, HDAC8 PROTAC offers a therapeutic advantage over conventional HDAC8is.
Our HDAC8 PROTAC (1) modulated the levels of Cdks and cyclin B1, induced S-phase arrest, and reduced proliferation in glioblastoma cells. S-phase arrest is often triggered by DNA damage.34,35 During DNA damage, the p53 protein is activated, leading to the expression of the cyclin-dependent kinase inhibitor 1A (p21) protein. The p21 protein subsequently inhibits Cdks-cyclin complex and induces cell cycle arrest.36 Previous studies have shown that p53 is a substrate of HDAC8.37 In acute myeloid leukemia, HDAC8 forms an aberrant complex with core binding factor β-smooth muscle myosin heavy chain and deacetylates p53, resulting in the inactivation of p53.38 Therefore, our observed S-phase arrest may result from two mechanisms: the loss of Cdk2, Cdk1, and cyclin B1, which are essential for S-phase progression and completion, as well as G2/M phase initiation, and the disruption of HDAC8 function, which may restore p53 activity and p21-mediated cell cycle arrest.
Treating glioblastoma cells with HDAC8 PROTAC (1) was also found to induce apoptosis. Bcl-2 family members regulate mitochondrial membrane permeability and play key roles in both intrinsic and extrinsic apoptotic pathways.39–41 In this study, treating cells with HDAC8 PROTAC (1) significantly reduced Bcl-2, while the level of LC3, a key autophagy marker, was not affected, suggesting that apoptosis rather than autophagy was induced. Notably, ER stress is triggered by protein misfolding and IRE1α activation.42 IRE1α activation initiates apoptosis via apoptosis signal-regulating kinase 1-mediated activation of JNK43 and XBP1s-mediated activation of CHOP.44 Our results show that HDAC8 PROTAC activated JNK phosphorylation and increased the level of CHOP, which subsequently suppressed Bcl-2 expression and induced apoptosis in glioblastoma cells. Thus, it is likely that HDAC8 PROTAC (1) induces ER stress-mediated apoptosis in glioblastoma cells via the IRE1α/XBP1s–JNK–CHOP pathway as proposed in Figure 13.
Systemic toxicity due to off-target degradation in normal cells is a critical concern in the development of PROTAC-based therapeutic strategies.45,46 MGMT is a crucial enzyme for DNA repair and survival of glioblastoma cells.47 Previous study reported that dissociation of HDAC8-ADRM1 complex in U-87 MG cells, resulting in downregulation of MGMT triggering DNA damage and apoptosis in glioblastoma cells.14 Consistent with our finding, the loss of HDAC8 mediated by HDAC8 PROTAC (1) exhibited potent cytotoxicity effect against glioblastoma cells, while caused minimal toxicity toward the PHA. Taken together, this cytotoxic selectivity of HDAC8 PROTAC (1) might be attributed to its targeted degradation of HDAC8, which we demonstrated in an earlier study.18
Vorinostat, the first pan-HDACi to enter clinical trials, has demonstrated therapeutic benefits as both a monotherapy10 and in combination with standard treatment regimens.11 However, it is associated with substantial thrombocytopenia due to its nonselective inhibition of HDACs, particularly HDAC1 and HDAC2, which are essential for erythrocyte–megakaryocyte differentiation. Inactivation of HDAC1 and HDAC2 has induced thrombocytopenia and megakaryocyte apoptosis in other models.48 Additionally, HDAC6 inhibition has been associated with impaired proplatelet formation and, consequently, thrombocytopenia.49 Therefore, further studies are warranted to assess the effects of HDAC8 PROTAC on hematological cells and to determine its safety profile.
In this study, we investigated the pharmacological effects of our previously reported HDAC8 PROTAC (1) in glioblastoma cells. These results support HDAC8 PROTAC (1) as a promising therapeutic candidate for the treatment of glioblastoma. Although high-molecular-weight compounds, including PROTACs, generally show limited brain penetration, a brain-penetrant PROTAC is currently under clinical investigation. It is of interest whether the HDAC8-targeting PROTAC can cross the blood-brain barrier. However, our current studies are based solely on in vitro experiments. Further in vivo studies, including evaluations of potency, pharmacokinetics, brain penetration, and toxicities, are necessary to assess the therapeutic potential of HDAC8 PROTAC (1) and support its progression to clinical development.
Conclusion
Degradation of HDAC8 induced by HDAC8 PROTAC (1) caused potent and selective antiproliferative and cytotoxicity effect toward human glioblastoma cells by modulating the levels of Cdks and cyclins, suppressing proteins that regulate the cell cycle, and inducing S-phase arrest. It was also found to activate the IRE1α/XBP1s–JNK–CHOP pathway, downregulate Bcl-2, and induce ER stress-mediated apoptosis in human glioblastoma cells. Notably, HDAC8 PROTAC (1) exhibited greater selective cytotoxicity against cancer cells than primary human astrocytes. This limited toxicity of the HDAC8 PROTAC (1) in PHA suggested its safety and highlighted the potential of the HDAC8 PROTAC (1) for the treatment of glioblastoma.
Acknowledgments
We thank the Research Office and the Faculty of Dentistry at Mahidol University, the Chakri Naruebodindra Medical Institute, and the Comprehensive Analysis Center in SANKEN at the University of Osaka for their instrumental support. We also thank Ms. Chareerut Phruksaniyom, Ms. Supaporn Mala, Ms. Pichsinee Woonfak, and Ms. Kijyaporn Jantakarncharoen for their technical support. We thank Dr. Kristen Sadler from Scribendi (www.scribendi.com) for editing a draft of this manuscript.
Funding
This research project was funded by Mahidol University (Fundamental Fund: fiscal year 2024, FF-025/2567, by National Science Research and Innovation Fund [NSRF] and Scholarships for Academic and Supporting Staff Mobility: fiscal year 2023).
Disclosure
The author(s) report no conflicts of interest in this work.
References
1. Girardi F, Matz M, Stiller C, et al. Global survival trends for brain tumors, by histology: analysis of individual records for 556,237 adults diagnosed in 59 countries during 2000-2014 (Concord-3). Neuro Oncol. 2023;25(3):580–21. doi:10.1093/neuonc/noac217
2. Stupp R, Mason WP, van den Bent MJ, et al. Radiotherapy plus concomitant and adjuvant temozolomide for glioblastoma. N Engl J Med. 2005;352(10):987–996. doi:10.1056/NEJMoa043330
3. Tan Q, Zhang Z, Hui J, Zhao Y, Zhu L. Synthesis and anticancer activities of thieno[3,2-d]pyrimidines as novel HDAC inhibitors. Bioorg Med Chem. 2014;22(1):358–365. doi:10.1016/j.bmc.2013.11.021
4. Bian X, Liang Z, Feng A, Salgado E, Shim H. HDAC inhibitor suppresses proliferation and invasion of breast cancer cells through regulation of miR-200c targeting CRKL. Biochem Pharmacol. 2018;147:30–37. doi:10.1016/j.bcp.2017.11.008
5. Espinoza AF, Patel RH, Patel KR, et al. A novel treatment strategy utilizing panobinostat for high-risk and treatment-refractory hepatoblastoma. J Hepatol. 2024;80(4):610–621. doi:10.1016/j.jhep.2024.01.003
6. McClure JJ, Li X, Chou CJ. Advances and challenges of HDAC inhibitors in cancer therapeutics. Adv Cancer Res. 2018;138:183–211. doi:10.1016/bs.acr.2018.02.006
7. Beck A, Eberherr C, Hagemann M, et al. Connectivity map identifies HDAC inhibition as a treatment option of high-risk hepatoblastoma. Cancer Biol Ther. 2016;17(11):1168–1176. doi:10.1080/15384047.2016.1235664
8. Quintas-Cardama A, Santos FP, Garcia-Manero G. Histone deacetylase inhibitors for the treatment of myelodysplastic syndrome and acute myeloid leukemia. Leukemia. 2011;25(2):226–235. doi:10.1038/leu.2010.276
9. Perez T, Berges R, Maccario H, Oddoux S, Honore S. Low concentrations of vorinostat decrease EB1 expression in GBM cells and affect microtubule dynamics, cell survival and migration. Oncotarget. 2021;12(4):304–315. doi:10.18632/oncotarget.27892
10. Galanis E, Jaeckle KA, Maurer MJ, et al. Phase II trial of vorinostat in recurrent glioblastoma multiforme: a north central cancer treatment group study. J Clin Oncol. 2009;27(12):2052–2058. doi:10.1200/JCO.2008.19.0694
11. Galanis E, Anderson SK, Miller CR, et al. Phase I/II trial of vorinostat combined with temozolomide and radiation therapy for newly diagnosed glioblastoma: results of Alliance N0874/ABTC 02. Neuro Oncol.;20(4):546–556. doi:10.1093/neuonc/nox161.
12. Deardorff MA, Bando M, Nakato R, et al. HDAC8 mutations in Cornelia de Lange syndrome affect the cohesin acetylation cycle. Nature. 2012;489(7415):313–317. doi:10.1038/nature11316
13. Hua WK, Qi J, Cai Q, et al. HDAC8 regulates long-term hematopoietic stem-cell maintenance under stress by modulating p53 activity. Blood. 2017;130(24):2619–2630. doi:10.1182/blood-2017-03-771386
14. Santos-Barriopedro I, Li Y, Bahl S, Seto E. HDAC8 affects MGMT levels in glioblastoma cell lines via interaction with the proteasome receptor ADRM1. Genes Cancer. 2019;10(5–6):119–133. doi:10.18632/genesandcancer.197
15. Mormino A, Cocozza G, Fontemaggi G, et al. Histone-deacetylase 8 drives the immune response and the growth of glioma. Glia. 2021;69(11):2682–2698. doi:10.1002/glia.24065
16. Qian Y, Zhang J, Jung YS, Chen X. DEC1 coordinates with HDAC8 to differentially regulate TAp73 and DeltaNp73 expression. PLoS One. 2014;9(1):e84015. doi:10.1371/journal.pone.0084015
17. Kang Y, Nian H, Rajendran P, et al. HDAC8 and STAT3 repress BMF gene activity in colon cancer cells. Cell Death Dis. 2014;5(10):e1476. doi:10.1038/cddis.2014.422
18. Chotitumnavee J, Yamashita Y, Takahashi Y, et al. Selective degradation of histone deacetylase 8 mediated by a proteolysis targeting chimera (PROTAC). Chem Commun. 2022;58(29):4635–4638. doi:10.1039/d2cc00272h
19. Suzuki T, Muto N, Bando M, et al. Design, synthesis, and biological activity of NCC149 derivatives as histone deacetylase 8-selective inhibitors. ChemMedChem. 2014;9(3):657–664. doi:10.1002/cmdc.201300414
20. Marek M, Shaik TB, Heimburg T, et al. Characterization of histone deacetylase 8 (HDAC8) selective inhibition reveals specific active site structural and functional determinants. J Med Chem. 2018;61(22):10000–10016. doi:10.1021/acs.jmedchem.8b01087
21. Darwish S, Ghazy E, Heimburg T, et al. Design, synthesis and biological characterization of histone deacetylase 8 (HDAC8) proteolysis targeting chimeras (PROTACs) with anti-neuroblastoma activity. Int J Mol Sci. 2022;23(14). doi:10.3390/ijms23147535
22. Sun Z, Deng B, Yang Z, et al. Discovery of pomalidomide-based PROTACs for selective degradation of histone deacetylase 8. Eur J Med Chem. 2022;239:114544. doi:10.1016/j.ejmech.2022.114544
23. Huang J, Zhang J, Xu W, et al. Structure-based discovery of selective histone deacetylase 8 degraders with potent anticancer activity. J Med Chem. 2023;66(2):1186–1209. doi:10.1021/acs.jmedchem.2c00739
24. Xiao Y, Hale S, Awasthee N, et al. HDAC3 and HDAC8 PROTAC dual degrader reveals roles of histone acetylation in gene regulation. Cell Chem Biol. 2023;30(11):1421–1435e12. doi:10.1016/j.chembiol.2023.07.010
25. Xiao Y, Awasthee N, Liu Y, et al. Discovery of a highly potent and selective HDAC8 degrader: advancing the functional understanding and therapeutic potential of HDAC8. J Med Chem. 2024;67(15):12784–12806. doi:10.1021/acs.jmedchem.4c00761
26. Zhao C, Chen D, Suo F, Setroikromo R, Quax WJ, Dekker FJ. Discovery of highly potent HDAC8 PROTACs with anti-tumor activity. Bioorg Chem. 2023;136:106546. doi:10.1016/j.bioorg.2023.106546
27. Zhao C, Zhang J, Zhou H, Setroikromo R, Poelarends GJ, Dekker FJ. Exploration of hydrazide-based HDAC8 PROTACs for the treatment of hematological malignancies and solid tumors. J Med Chem. 2024;67(16):14016–14039. doi:10.1021/acs.jmedchem.4c00836
28. Balasubramanian S, Ramos J, Luo W, Sirisawad M, Verner E, Buggy JJ. A novel histone deacetylase 8 (HDAC8)-specific inhibitor PCI-34051 induces apoptosis in T-cell lymphomas. Leukemia. 2008;22(5):1026–1034. doi:10.1038/leu.2008.9
29. An P, Chen F, Li Z, et al. HDAC8 promotes the dissemination of breast cancer cells via AKT/GSK-3beta/Snail signals. Oncogene. 2020;39(26):4956–4969. doi:10.1038/s41388-020-1337-x
30. Oehme I, Deubzer HE, Wegener D, et al. Histone deacetylase 8 in neuroblastoma tumorigenesis. Clin Cancer Res. 2009;15(1):91–99. doi:10.1158/1078-0432.CCR-08-0684
31. Tian Y, Wong VW, Wong GL, et al. Histone deacetylase HDAC8 promotes insulin resistance and beta-catenin activation in NAFLD-associated hepatocellular carcinoma. Cancer Res. 2015;75(22):4803–4816. doi:10.1158/0008-5472.CAN-14-3786
32. Wang ZT, Chen ZJ, Jiang GM, et al. Histone deacetylase inhibitors suppress mutant p53 transcription via HDAC8/YY1 signals in triple negative breast cancer cells. Cell Signal. 2016;28(5):506–515. doi:10.1016/j.cellsig.2016.02.006
33. Tang X, Li G, Su F, et al. HDAC8 cooperates with SMAD3/4 complex to suppress SIRT7 and promote cell survival and migration. Nucleic Acids Res. 2020;48(6):2912–2923. doi:10.1093/nar/gkaa039
34. Martinez J, Georgoff I, Martinez J, Levine AJ. Cellular localization and cell cycle regulation by a temperature-sensitive p53 protein. Genes Dev. 1991;5(2):151–159. doi:10.1101/gad.5.2.151
35. Chen J. The cell-cycle arrest and apoptotic functions of p53 in tumor initiation and progression. Cold Spring Harb Perspect Med. 2016;6(3):a026104. doi:10.1101/cshperspect.a026104
36. Engeland K. Cell cycle regulation: p53-p21-RB signaling. Cell Death Differ. 2022;29(5):946–960. doi:10.1038/s41418-022-00988-z
37. Yan W, Liu S, Xu E, et al. Histone deacetylase inhibitors suppress mutant p53 transcription via histone deacetylase 8. Oncogene. 2013;32(5):599–609. doi:10.1038/onc.2012.81
38. Qi J, Singh S, Hua WK, et al. HDAC8 inhibition specifically targets inv(16) acute myeloid leukemic stem cells by restoring p53 acetylation. Cell Stem Cell. 2015;17(5):597–610. doi:10.1016/j.stem.2015.08.004
39. van Gurp M, Festjens N, van Loo G, Saelens X, Vandenabeele P. Mitochondrial intermembrane proteins in cell death. Biochem Biophys Res Commun. 2003;304(3):487–497. doi:10.1016/s0006-291x(03)00621-1
40. Gottlieb E, Armour SM, Harris MH, Thompson CB. Mitochondrial membrane potential regulates matrix configuration and cytochrome c release during apoptosis. Cell Death Differ. 2003;10(6):709–717. doi:10.1038/sj.cdd.4401231
41. Pihan P, Carreras-Sureda A, Hetz C. BCL-2 family: integrating stress responses at the ER to control cell demise. Cell Death Differ. 2017;24(9):1478–1487. doi:10.1038/cdd.2017.82
42. Cubillos-Ruiz JR, Bettigole SE, Glimcher LH. Tumorigenic and Immunosuppressive effects of endoplasmic reticulum stress in cancer. Cell. 2017;168(4):692–706. doi:10.1016/j.cell.2016.12.004
43. Kim I, Shu CW, Xu W, et al. Chemical biology investigation of cell death pathways activated by endoplasmic reticulum stress reveals cytoprotective modulators of ASK1. J Biol Chem. 2009;284(3):1593–1603. doi:10.1074/jbc.M807308200
44. Oyadomari S, Mori M. Roles of CHOP/GADD153 in endoplasmic reticulum stress. Cell Death Differ. 2004;11(4):381–389. doi:10.1038/sj.cdd.4401373
45. Jia Q, Zhang Y, Liu F, et al. Cell-specific degradation of histone deacetylase using warhead-caged proteolysis targeting chimeras. Anal Chem. 2023;95(45):16474–16480. doi:10.1021/acs.analchem.3c01236
46. Bekes M, Langley DR, Crews CM. PROTAC targeted protein degraders: the past is prologue. Nat Rev Drug Discov. 2022;21(3):181–200. doi:10.1038/s41573-021-00371-6
47. Butler M, Pongor L, Su YT, et al. MGMT status as a clinical biomarker in glioblastoma. Trends Cancer. 2020;6(5):380–391. doi:10.1016/j.trecan.2020.02.010
48. Wilting RH, Yanover E, Heideman MR, et al. Overlapping functions of Hdac1 and Hdac2 in cell cycle regulation and haematopoiesis. EMBO J. 2010;29(15):2586–2597. doi:10.1038/emboj.2010.136
49. Messaoudi K, Ali A, Ishaq R, et al. Critical role of the HDAC6-cortactin axis in human megakaryocyte maturation leading to a proplatelet-formation defect. Nat Commun. 2017;8(1):1786. doi:10.1038/s41467-017-01690-2
 © 2026 The Author(s). This work is published and licensed by Dove Medical Press Limited. The
full terms of this license are available at https://www.dovepress.com/terms
and incorporate the Creative Commons Attribution
- Non Commercial (unported, 4.0) License.
By accessing the work you hereby accept the Terms. Non-commercial uses of the work are permitted
without any further permission from Dove Medical Press Limited, provided the work is properly
attributed. For permission for commercial use of this work, please see paragraphs 4.2 and 5 of our Terms.
© 2026 The Author(s). This work is published and licensed by Dove Medical Press Limited. The
full terms of this license are available at https://www.dovepress.com/terms
and incorporate the Creative Commons Attribution
- Non Commercial (unported, 4.0) License.
By accessing the work you hereby accept the Terms. Non-commercial uses of the work are permitted
without any further permission from Dove Medical Press Limited, provided the work is properly
attributed. For permission for commercial use of this work, please see paragraphs 4.2 and 5 of our Terms.