Back to Journals » International Journal of Nanomedicine » Volume 12
Tailored nanostructured platforms for boosting transcorneal permeation: Box–Behnken statistical optimization, comprehensive in vitro, ex vivo and in vivo characterization
Received 30 August 2017
Accepted for publication 29 September 2017
Published 30 October 2017 Volume 2017:12 Pages 7947—7962
DOI https://doi.org/10.2147/IJN.S150366
Checked for plagiarism Yes
Review by Single anonymous peer review
Peer reviewer comments 2
Editor who approved publication: Dr Thomas Webster
Ibrahim Elsayed,1,2 Sinar Sayed1
1Department of Pharmaceutics and Industrial Pharmacy, Faculty of Pharmacy, Cairo University, Cairo, Egypt; 2Department of Pharmaceutical Sciences, College of Pharmacy, Gulf Medical University, Ajman, United Arab Emirates
Abstract: Ocular drug delivery systems suffer from rapid drainage, intractable corneal permeation and short dosing intervals. Transcorneal drug permeation could increase the drug availability and efficiency in the aqueous humor. The aim of this study was to develop and optimize nanostructured formulations to provide accurate doses, long contact time and enhanced drug permeation. Nanovesicles were designed based on Box–Behnken model and prepared using the thin film hydration technique. The formed nanodispersions were evaluated by measuring the particle size, polydispersity index, zeta potential, entrapment efficiency and gelation temperature. The obtained desirability values were utilized to develop an optimized nanostructured in situ gel and insert. The optimized formulations were imaged by transmission and scanning electron microscopes. In addition, rheological characters, in vitro drug diffusion, ex vivo and in vivo permeation and safety of the optimized formulation were investigated. The optimized insert formulation was found to have a relatively lower viscosity, higher diffusion, ex vivo and in vivo permeation, when compared to the optimized in situ gel. So, the lyophilized nanostructured insert could be considered as a promising carrier and transporter for drugs across the cornea with high biocompatibility and effectiveness.
Keywords: thin-film hydration, in situ, insert, confocal, transcorneal, tenoxicam
Introduction
Tenoxicam is a nonsteroidal anti-inflammatory drug which belongs to the oxicam class.1 It is used in the symptomatic control of joint and musculoskeletal diseases such as rheumatoid arthritis and osteoarthritis.2 It is administered through various routes such as oral, intramuscular, intravenous and rectal, all with the same dose (20 mg). After oral administration, it is completely absorbed (bioavailability ~99%), approaching the maximum plasma concentration after 2 h in the case of fasting conditions, while food may lead to a delayed absorption for about 6 h.3 It has about 98.5% plasma protein binding, which leads to its extended elimination half-life (60–70 h).4 Tenoxicam could be used for the prevention and treatment of ocular inflammatory disorders.5,6 Biodistribution of tenoxicam was previously studied after intramuscular injection in rabbits, and it was found that only 5% of the administered drug was distributed into the vitreous and aqueous humor with very low Cmax (about 2.5% of its value in the plasma).7
Transcorneal permeation of topically applied formulations is generally restricted by different physical and biologic obstacles. Immediate blinking may lead to removal of about 95% of the applied volume.8 Furthermore, the nasolacrimal pathway can uptake a considerable portion of the dose to the systemic circulation, leading to possible side effects.9 The cornea as a physical barrier is composed of three layers: epithelium, stroma and endothelium. The epithelium consists of five to seven layers of tightly connected cells allowing only the passage of small lipophilic molecules.10 The stroma is a watery thick layer, while the endothelium is composed of a thin layer of cells; so, both layers are not considered a significant obstacle against drug permeation.11 Permeation through the cornea is dependent on drug lipophilicity and molecular weight. Increasing the drug or the nanoformulation partition coefficient could increase the drug permeability.12 On the other hand, drugs with molecular weight larger than 10°A may not be able to cross the cornea at a measurable rate and extent.10
Nanovesicles are widely used to enhance drug permeation through the cornea. Liposomes have been used for encapsulation and delivery of various drugs, for example, acetazolamide, acyclovir and ibuprofen, to the eye.13–15 Mucoadhesive liposomes have been developed through incorporation of chitosan, carbopol and xanthan gum to increase contact to the corneal surface.16–19 Niosomes were also investigated as an ocular nanocarrier for several active ingredients such as timolol maleate, naltrexone hydrochloride, ketoconazole and natamycin.20–23 Other nanovesicles have been developed and optimized for enhancement of the corneal permeation (eg, bilosomes and transfersomes).24,25 All these trials have succeeded to different extents to permeate active ingredients through the cornea. However, they are still suffering from the conventional drawbacks of aqueous nanodispersion, including the relatively low physical stability during storage, inaccurate dosing especially for delivering potent drugs and the short ocular retention time after application.26–28
In situ gelling systems had been developed to allow the patient to administer an accurate dose, and then, sol–gel transformation is taking place as it applied to the physiologic conditions. Gelling of these systems takes place in the presence of physical or chemical stimulus.29 Pluronics have the ability to form a gel at physiologic temperature in a tailored pattern based on the type and concentration of the applied polymer solution.30 Gellan gum (GG) solutions form gel due to formation of insoluble polymer with the divalent ions present in the eye.31 On the other hand, ocular inserts could be considered as another carrier to retain the active ingredient for a prolonged period in the cul-de-sac to overcome one of the main obstacles for the transcorneal permeation. Poly(acrylic) acid and poly(lactic co-glycolic) acid were previously used as insert matrix to release the drug in a sustained pattern.32,33 Conversely, soluble lyophilized inserts have been formulated to maintain the drug stability during shelf-life and allow administration of an accurate dose upon instillation into the eyes.34
The aim of this study is to develop and optimize two types of novel nanostructured formulations. The first is a nanostructured in situ gel, in which the drug is carried in lipid nanovesicles to facilitate corneal permeation. Upon application into the eye, the nanodispersion will be converted into gel to increase the contact time with the corneal surface and minimize immediate drainage. The second formulation is a nanostructured insert, where the nanovesicles are kept in lyophilized matrices. This could help the patient to administer accurate doses. Moreover, the inserts could be rapidly reconstituted after instillation into the eyes to produce the original nanodispersion.
Materials and methods
Materials
Tenoxicam was kindly gifted by El Kahira Pharmaceutical Company (Cairo, Egypt). Pluronic F127 (PF127), glyceryl tripalmitate (GTP), trehalose dihydrate, and GG were purchased from Sigma Aldrich Co. (St Louis, MO, USA). Absolute ethanol, methanol, chloroform, disodium hydrogen phosphate and potassium dihydrogen phosphate were purchased from El Nasr Pharmaceutical Company (Cairo, Egypt). All other chemicals were of analytical grade and used as received without any further purification.
Preparation of the nanostructured formulations
Tenoxicam-loaded nanostructured formulations were prepared using a modified thin-film hydration technique.35,36 Briefly, the drug (20 mg), Pluronic F127 (PF127) and GTP were dissolved in 10 mL chloroform/methanol mixture in a ratio of 2:1 v/v. The prepared solution was fed into a Rotavap flask (Heidolph VV 2000; Heidolph, Burladingen, Germany) rotating at 120 rpm to be evaporated under reduced pressure at the temperature 60°C±0.5°C for 15 min.37 GG aqueous solution (10 mL) was added to hydrate the formed film at the same temperature and rotation speed, for 1 h under atmospheric pressure. The resulting vesicles were sonicated for 1 min in a bath sonicator to reduce their size and stored at 4°C till further characterization.
Statistical planning
Using Design-Expert™ 7 software, Box–Behnken model was employed for the design of 13 formulations. This was based on three studied independent factors: the concentrations of GTP (A), PF127 (B) and GG (C), as demonstrated in Table 1. Two sets of responses were established to develop a pair of optimized formulations. The first set was composed of three responses, particle size (PS: Y1), zeta potential (ZP: Y2) and entrapment efficiency (EE: Y3), to optimize a nanostructured formulation (Pre-insert: PRE-I) to be lyophilized for the development of the ocular insert. The second set had four responses, PS, ZP, EE in addition to gelation temperature (GT: Y4), employed for the optimization of a nanostructured in situ gel (optimized in situ gel: OIG). Factorial analysis was performed for each response at a confidence limit of 0.05. Desirability was used for the simultaneous optimization of the measured responses.38,39
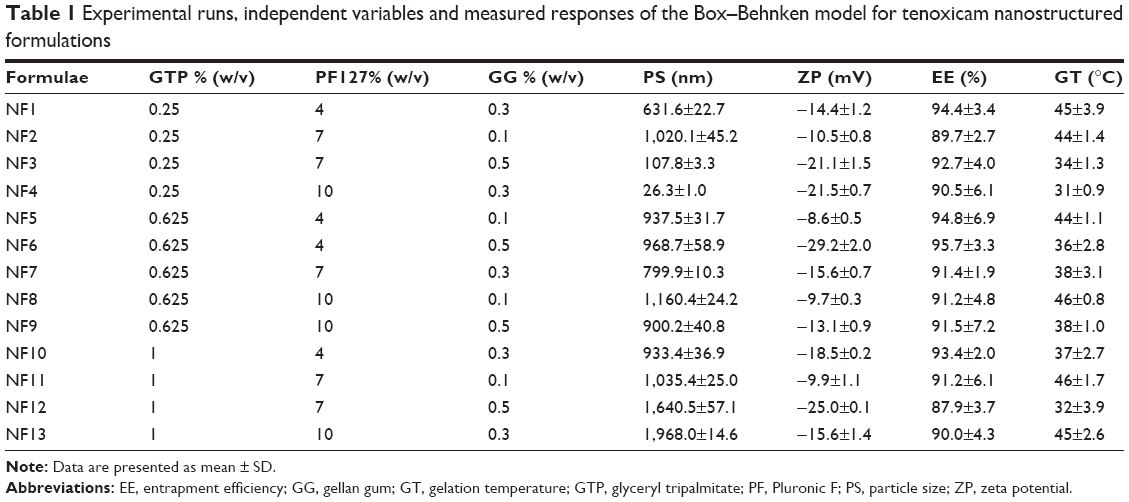 | Table 1 Experimental runs, independent variables and measured responses of the Box–Behnken model for tenoxicam nanostructured formulations |
Characterization of the prepared nanostructured formulations
PS, polydispersity index (PDI) and ZP
Samples from each formula were diluted five times with double-distilled water.40 The diluted samples were analyzed using dynamic light scattering technique (Zetasizer; Malvern Instruments Ltd, Worcestershire, UK) for the measurement of PS, PDI and ZP. Each analysis was repeated three times and the mean ± SD values were recorded.
Entrapment efficiency
The ability of the prepared nanovesicles to encapsulate tenoxicam was determined by centrifugation of samples taken from each formulation (cooling centrifuge; Beckman Coulter, Fullerton, CA, USA) performed for 1 h at a temperature of 4°C and a rotation speed of 15,000 rpm. The clear supernatant was separated with a micropipette and diluted with ethanol. The diluted supernatant was analyzed for its drug content using an ultraviolet spectrophotometer (model UV-1601 PC; Shimadzu, Kyoto, Japan). Analysis was done at predetermined λmax (368 nm) and the unentrapped drug amount was calculated based on the previously constructed calibration curve. Finally, the EE amount was calculated using the following equation:41
|
|
Gelation temperature
Each formulation was mixed with artificial tears (Orchatears Plus; Orchidia Pharmaceutical Industries, Cairo, Egypt) in the ratio of 1:20 v/v using a magnetic stirrer hotplate at a speed of 350 rpm.42 The temperature at which the magnet stopped was measured using a thermometer and counted as the GT.43,44 Each measurement was performed in triplicate and the mean ± SD values were tabulated.
Preparation and characterization of the ocular inserts
Trehalose (2.5% or 5% w/v) as a cryoprotectant was added to different samples of the PRE-I formula to prepare the formulations L2 and L3, respectively. A trehalose-free PRE-I sample (L1) was taken as a reference to investigate whether the cryoprotectant was required. Constant volume from each sample (0.1 mL) was accurately transferred into a polyethylene blister (diameter: 5 mm) and frozen overnight at −20°C. Later, the frozen samples were subjected to lyophilization in a freeze dryer (Novalyphe-NL 500; Savant Instruments Corp., Hyderabad, India) running at a pressure of 7×10⁻² mbar and a temperature of −45°C for 24 h.45 The frozen samples were physically investigated regarding their color, shape and consistency. PS, ZP and EE were analyzed for each lyophilized formula after reconstitution using distilled water with the original dried volume.
Imaging
Transmission electron microscopy (TEM)
One drop was taken from the diluted OIG formula and placed over a copper grid coated with carbon. Then, it was negatively stained by adding one drop of phosphotungstic acid aqueous solution (1% w/v).46 After air drying of the stained samples, they were visualized using TEM (JEM-2100; JEOL, Tokyo, Japan) operating at 100 kV.
Scanning electron microscope (SEM)
The morphologic characteristics of the selected lyophilized formulation (L3) were investigated by imaging of its surface using field emission SEM (Quanta 250 FEG; FEI, Brno-Černovice, Czech Republic). The SEM was equipped with energy-dispersive X-ray spectroscopy (Edax Ametek, Mahwah, NJ, USA) and a compact cold cathode gauge (Pfeiffer, Asslar, Germany). Samples were tested at low vacuum and without prior gold sputtering.47
Rheological characterization
Viscosity is an important parameter to be evaluated to characterize the prepared nanostructured formulations. The OIG formula was heated to 32°C after mixing with artificial tears in a ratio of 1:20 v/v to form a gel, while the selected lyophilized formula (L3) was reconstituted using artificial tears to restore its original volume. After that, 1 mL was taken from each formula and filled into rheometer plate equipped with spindle CPE-41. The torque was adjusted to be within the accepted range (10%–100%) under a rotation speed that ranged from 0.3 to 12 rpm.48 The shear stress and viscosity were determined at each shear rate value and the results were fitted to the power law model (Equation 2) to determine the rheological pattern of each formula:
τ = Kγn |
|
where τ is the shear stress (dyne/cm2), K is the consistency index (dyne/cm2.sn), γ is the rate of shear (s−1) and n is the flow index. The latter value could be approximately equal to 1 in the case of Newtonian flow, whereas it indicates a shear thinning system if its value is less than 1. On the other hand, systems with shear thickening behavior could have a flow index value exceeding 1.49
In vitro release
The drug release profiles from the OIG and the selected lyophilized formulations, compared to the drug diffusion from its aqueous solution, were investigated through dialysis membranes (typical molecular weight cut-off 14,000 Da; Sigma-Aldrich Co.) after soaking overnight in the diffusion medium.50 The dialysis membrane was fitted into a Franz diffusion cell having an acceptor capacity of 20 mL filled with PBS (pH 7.4) and rotating at 100 rpm, and the temperature of the surrounding medium was adjusted to 32°C.51,52 One drop of the OIG formula, one insert of the selected lyophilized formula, or an equivalent volume of the drug solution in PBS was added to 2 mL artificial tears and the diluted samples were filled into the donor compartment. Samples (0.2 mL) were withdrawn through the sampling port using a tuberculin syringe at the time intervals 0.5, 1, 2, 4, 5, 6, 8, 12 and 24 h and then replaced with fresh medium to maintain a constant volume. Each sample was poured into a disposable microcuvette and analyzed at the predetermined tenoxicam λmax (368 nm). The drug diffusion from each formula, in addition to the drug solution was determined three times and the mean ± SD was calculated. The obtained diffusion profiles were compared to each other utilizing the similarity factor (f2) calculated from the following equation:53
|
|
where n is the number of samples withdrawn and T and R are the % of drug diffusing at each time interval (j) from the test and reference formulations, respectively. Furthermore, the data diffusion was fitted into the zero, first and Higuchi models to determine the highest coefficient of determination (r2).54 Consequently, the most suitable model was used to calculate the diffusion half-life (t1/2) of each profile as an indicator for the diffusion rate. Finally, the calculated half-lives were statistically compared by applying one-way analysis of variance (ANOVA) followed by post hoc test for the multiple comparison using SPSS 19 software® (IBM Corporation, Armonk, NY, USA).
Ex vivo permeation
The study was first revised and approved by the ethics committee, Faculty of Pharmacy, Cairo University (PI 1951) and complied with the Guide for Care and Use of Laboratory Animals published by the US National Institute of Health (NIH Publication No 85-23, revised 2011). Male albino rabbits (weight 2–3 kg) were used for the study after anesthetizing them by intramuscular injection of 35 mg/kg ketamine and 5 mg/kg xylazine. Then, the rabbits were decapitated to remove the cornea and sclera, which were washed using artificial tears solution and immediately mounted on the acceptor cell filled with 20 mL PBS, whereas the central transparent cornea only was exposed to the permeation medium. After that, the donor cell was fixed and filled with the 2 mL artificial tears solution containing one drop of the OIG formula, one disk of the selected lyophilized formula or one drop of the drug solution in PBS (pH 7.4). The permeation medium was thermostatically kept at a temperature of 32°C under a rotation speed of 100 rpm. Samples were withdrawn from the acceptor cell using a tuberculin syringe at the same time intervals employed in the in vitro diffusion study. The collected samples were filtered using 0.45 μm membrane filter. Afterward, the permeated drug at each time interval was analyzed using high-performance liquid chromatography (Shimadzu, Tokyo, Japan) equipped with Hypersil C18 column (150×4.6 mm, 5 μm) and an ultraviolet detector at the same predetermined λmax (368 nm). The mobile phase was composed of 0.05 M sodium phosphate, pH 2.8:acetonitrile (55:45 v/v), running with a flow rate 1 mL/min.55 Reported results are the amount permeated at each time interval (average of triplicates) ± SD. The diffusion (P2; h−1), partition (P1; cm) and permeability (KP; cm/h) coefficients were calculated using the following equations:56
|
|

|
|

Kp = P1.P2 |
|
where TL is the lag time determined from the linear regression x-intercept of the time–amount of drug permeated correlation, A (cm2) is the corneal surface area exposed to the permeation medium and C0 is the initial drug concentration in the donor cell.
In vivo investigations
Histopathologic evaluation
The biocompatibility of the optimized formulations was evaluated and compared to the drug solution. One drop of OIG formula, an insert of the L3 formula and one drop of normal saline were instilled in both eyes of each of the three male albino rabbits (2–3 kg) used in the study. The dosing was twice daily for 1 week.24 After that, the animals were anesthetized and then decapitated under the same conditions followed for the ex vivo permeation study. The corneas were excised from the eyeball, washed by artificial tears and stored overnight in formalin saline solution (10% v/v). Specimens were dehydrated by alcohol, fixed in melted paraffin and left to solidify in the form of cubic blocks. Microtome was used to prepare skinny slices (~2 mm), which were deparaffinized and pigmented by hematoxylin and eosin. Finally, the stained samples were visualized using a digital microscope (DMS1000 B; Leica, Cambridge, UK).
Confocal laser scanning microscopy (CLSM)
The drug in the optimized formulations was replaced by 0.1% w/w Rhodamine B (RhB) to be visualized under CLSM (LSM 710; Carl Zeiss, Jena, Germany). The RhB-loaded formulations (100 μL) were instilled, each in both eyes of a male albino rabbit (2–3 kg), and compared to the RhB aqueous solution. After 6 h, the animals were killed by decapitation after being anesthetized.57 The clear corneas were carefully excised, washed, stored in artificial tears and imaged on the same day. RhB was fluorescently visualized by excitation at 485 and 595 nm using argon and helium–neon lasers, respectively. Confocal images were processed and rectified using LSM software version 4.2 (Carl Zeiss MicroImaging, Jena, Germany).24 Imaging started from the outer corneal surface with the z-stack mode in the directions xy and xz. Layer by layer was imaged with 2 mm increments till the characteristic color of RhB disappeared.
Results and discussion
Preparation of the nanostructured formulations
GTP was used to sustain the drug release from the prepared nanovesicles, in addition to giving a tailored environment for entrapment of different drugs with different characteristics in combination with the hydrophilic PF127.58 On the other hand, PF127 was added as a primary stabilizer for the formed nanovesicles and acts by reduction of their surface tension.59 The incorporation of GG was important to act as a secondary physical stabilizer by increasing the viscosity and negative charge induction.60 Furthermore, PF127 and GG had a common role of enhancing in situ gelling together, within the eye physiologic conditions. The ophthalmic temperature and ions could initiate the gelling of PF127 and GG aqueous liquid, respectively, upon ocular application.61 The simultaneous utilization of thermosensitive and ion-based in situ gelling techniques was supposed to fasten and facilitate the gel formation at lower concentrations of excipients and, therefore, decrease the possible irritation or high viscosity arising from using a large amount of PF127 or GG, respectively. Regarding the preparation techniques, the method was slightly modified to allow the incorporation of all ingredients as GG solution was utilized for hydration of the formed film.
Characterization of the prepared nanostructured formulations
PS, PDI and ZP
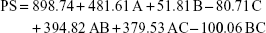
PS of the formulations lay within the range 26.3–1,968.0 nm, as displayed in Table 1. More than 50% of the formulations had a PS in the nano-range. The smallest vesicles were observed in the formula NF4 composed of 0.5% GTP, 10% PF127 and 0.3% GG, whereas the largest ones were noticed in the formula NF13 containing 1% GTP, 10% PF127 and 0.3% GG. This could give an indication about the effect of increasing GTP on the vesicular size growth and/or aggregation. To ensure the significance of each factor on the PS, two-factor interaction was utilized as an analysis model with a significance p<0.0001. Factorial ANOVA was validated through calculation of the adjusted, predicted R2 and adequate precision. The difference between the adjusted (0.9111) and predicted (0.8025) R2 was reasonable with adequate precision value of 21.34, indicating the model’s ability to navigate the design space with acceptable signal-to-noise ratio.62 Moreover, lack of fit was statistically nonsignificant (p=0.0895), revealing that the data were fitting within the employed model.63 The polynomial equation describing the effect of different factors on the PS was as follows:
|
|
Factorial ANOVA denoted that GTP concentration was the only factor having a significant effect on the PS (p<0.0001) with significant interactions with each of the PF127 and GG concentrations (p=0.0002 for both). On the contrary, the concentrations of PF127 and GG had no effect, with p values of 0.3084 and 0.1256, respectively. Figure 1A demonstrates the increase in PS upon increasing the GTP concentration, especially at a high level of PF127. Similar observations were previously reported by Lason et al who noticed a direct relation between the lipid concentration and the PS of the lipid nanoformulations.64
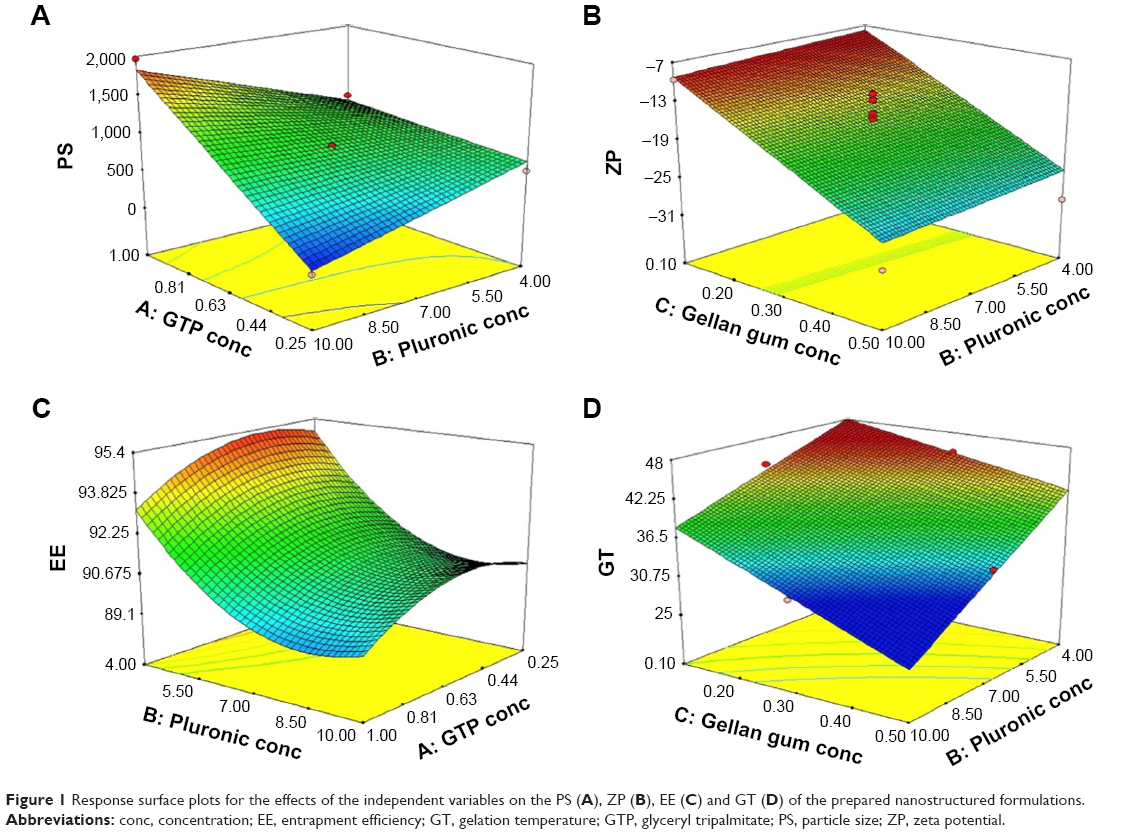 | Figure 1 Response surface plots for the effects of the independent variables on the PS (A), ZP (B), EE (C) and GT (D) of the prepared nanostructured formulations. |
The values of PDI ranged between 0.3 and 0.5 (data not shown) for all formulations. This indicates that the prepared nanodispersions were polydisperse, but within the acceptable limits.65,66 This parameter was not used as a response in the factorial analysis as the obtained PDI values failed to yield a valid statistical model, indicating that the studied factors had no significant effect on the PDI.
The ZP values lay in the range from −8.57 to −30.05 mV, as demonstrated in Table 1. High ZP is more desirable during optimization of nanovesicles and nanoparticles. The presence of potential similar charges could protect against agglomeration of the prepared nanovesicular formulations through generation of adequate repulsive forces.67 The negative charges originally came from the lone electron pairs present within the tenoxicam structure on the hydroxyl, carbonyl, sulfonyl, thienyl and secondary amine groups.68 The linear model was the best fit for the factorial analysis of the obtained ZP values with a p-value <0.0001. The model was validated through determination of the values of adjusted and predicted R2, which were found to be in reasonable agreement with each other (0.7620 and 0.6454, respectively). In addition, the adequate precision was >4 (11.67), indicating the model’s capability to navigate and cover the design space. Finally, the lack of fit was nonsignificant (p=0.0798) showing that the measured effects were valid.69 The linear equation representing the effects of the studied factors on the measured ZP was as follows:
ZP = 16.82 + 0.16 A + 0.77 B + 8.35C |
|
GG was the only factor having a significant effect on the ZP values (p<0.0001). Increasing GG led to increase in the ZP, wherein the highest values were observed at the highest level of GG (0.5%), as shown in Figure 1B. This might be due to the anionic nature of GG encouraging its use as a negative charge inducer for stabilization of different nanoparticles.60,70 On the other hand, the nonionic characteristic of both GTP and PF127 could explain their nonsignificant effect on the ZP values.71
Entrapment efficiency
Relatively high EEs were observed with a minimum value of 87.90% and a maximum value of 95.74%, as displayed in Table 1. This could be attributed to the relatively high partition coefficient of tenoxicam forcing it to escape from the aqueous environment, in addition to the presence of lipophilic GTP and hydrophilic PF127 in different ratios in the composition of nanovesicles, which configure a tailored environment adequate for entrapment of the employed drug.72 Quadratic model was selected for the factorial analysis of the obtained data and validation was confirmed as mentioned (adjusted R2=0.9635, predicted R2=0.8223, adequate precision =25.73 and lack of fit p=0.1495). The polynomial equation describing the selected quadratic model was as follows:
|
|
There was a significant effect of the GTP and PF127 concentrations and their squared terms on the EE values with a significant interaction between the GTP and the GG concentrations (p<0.05). On the contrary, GG concentration had no statistically significant effect on EE (p=0.6418). The intermediate percentage of GTP was the optimum for the entrapment of tenoxicam, while increasing PF127 promoted the drug escape from the nanovesicles, as illustrated in Figure 1C. This could be explained in the context of the possible formation of separate PF127 micelles containing certain drug fractions instead of achievement of extra stabilization of the already formed nanovesicles.73 Moreover, increasing the surfactant concentration could disrupt the nanovesicular membrane, making it more permeable and leaky and, thus, facilitating the drug escape.74
Gelation temperature
Gelation temperatures arrayed between 31°C and 48°C, as shown in Table 1. Two-factor interaction model was used for analysis of the measured values. The model was valid and able to navigate the design space. There was no need for model reduction or removal of outliers (adjusted R2=0.9635, predicted R2=0.9102, adequate precision =25.52 and lack of fit p=0.0732). The factorial ANOVA was conducted and the resultant polynomial equation was as follows:
|
|
The GT values were statistically affected by the concentrations of PF127 and GG with significant interactions between the effect of concentration of PF127 and the other two factors (concentrations of GTP and GG). It can be observed from Figure 1D that increasing GG and/or PF127 could lead to a clear decrease in the GT. The impact of the two significant factors on the GT matched our expectations during the experimental design due to the ability of PF127 and GG to enhance in situ thermal and ionic gelation, respectively.75
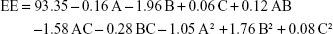
Statistical optimization
Selection of the optimized formulations was dependent on the desirability function which allowed consideration of all responses at the same time.69 Minimizing the PS and maximizing each of the ZP and EE were the common targets for preparing both PRE-I and OIG formulations. In addition, minimizing the GT was desired for the development of OIG, as the lowest obtained value was 31°C which was very close to the corneal surface temperature.76 The PRE-I and OIG formulations were similar in their content of GTP (0.25%) and GG (0.5%) with the desirability values of 0.905 and 0.917, respectively, as shown in Figure 2. The only difference was in the PF127 percentages, which were 6.53% in PRE-I and 10% in OIG. The optimized formulations were prepared and re-examined for their previously considered parameters. The obtained results, shown in Table 2, supported their involvement in the subsequent formulation and/or characterization.
 | Figure 2 Desirability values for the development of OIG (A and B) and PRE-I (C and D) formulations. |
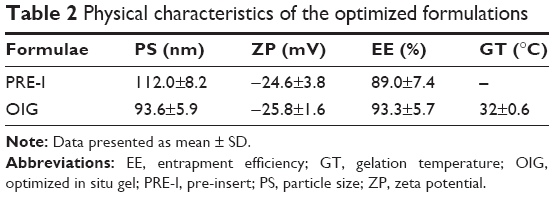 | Table 2 Physical characteristics of the optimized formulations |
Characterization of the ocular inserts
The lyophilized formulations had almost the same ZP and EE with no significant difference (p>0.05), as illustrated in Figure 3. Similar findings were previously recorded by Souza et al while investigating the effect of trehalose on the physical characteristics of topotecan-loaded lipid nanoparticles.77 On the other hand, the nanovesicular size significantly increased (p<0.001) upon lyophilization in the absence of trehalose, revealing the need for a cryoprotectant. These results opposed the previous conclusions stated by El-Dahmy et al78 and Szleifer et al79 that Pluronic itself could act as a cryoprotectant through its long polyethylene oxide chains. So, Pluronics might be able to exert a steric hindrance preventing the nanoparticles’ agglomeration. In our nanovesicles, the employed percentages of Pluronic (4%–10%) might not be enough to act as a cryoprotectant due to its incorporation into the vesicular structure as a primary stabilizer. Addition of trehalose significantly reduced the PS, and the presence of 5% trehalose in L3 formula was effective to regain the original PS measured before lyophilization (p=0.094). The same percentage of trehalose was previously recorded as an optimum for stabilization of several nanoparticle formulations.80–82 Finally, the L3 formula containing 5% trehalose was selected as a candidate for the subsequent characterization.
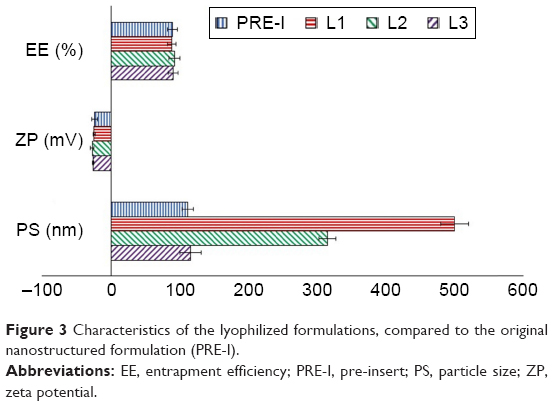 | Figure 3 Characteristics of the lyophilized formulations, compared to the original nanostructured formulation (PRE-I). |
Imaging by TEM and SEM
The OIG formula was visualized using TEM to study its morphologic characteristics. The nanovesicular surfaces were relatively smooth and spherical. The nanovesicles were well scattered without almost any aggregations, and their size was in the range of 100 nm, as demonstrated in Figure 4. This diameter was in line with the previously measured size using the Zetasizer. This could be adequate for enhancing the drug corneal permeation either through intercellular or intracellular pathways.83 On the other hand, the lyophilized formula L3 containing 5% trehalose as a cryoprotectant was imaged using SEM. It can be observed from Figure 5 that the lyophilized matrix was highly porous and this could allow the rapid reconstitution within the limited tear fluid after application into the eye.84
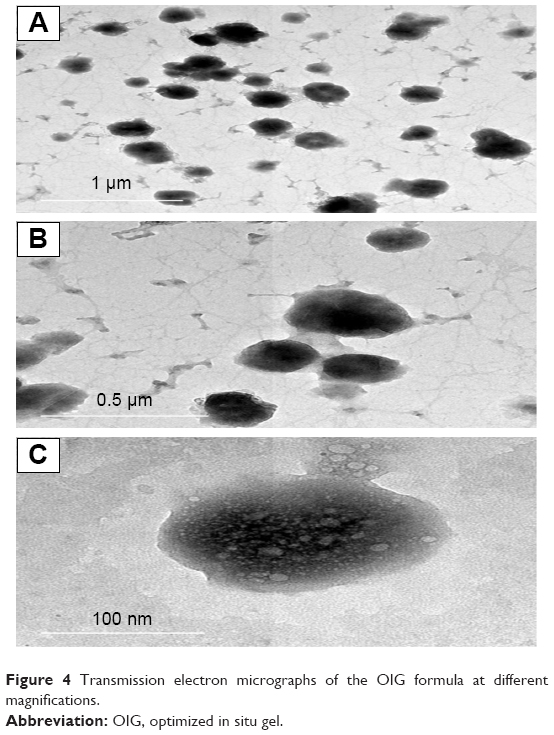 | Figure 4 Transmission electron micrographs of the OIG formula at different magnifications. |
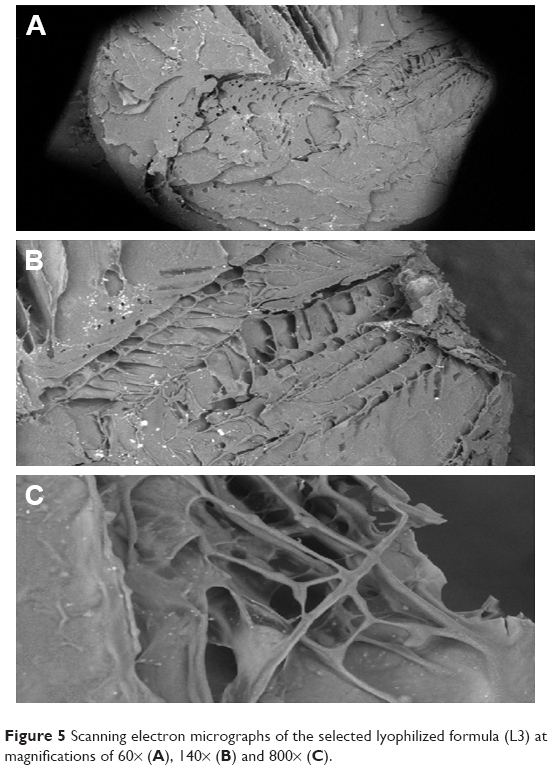 | Figure 5 Scanning electron micrographs of the selected lyophilized formula (L3) at magnifications of 60× (A), 140× (B) and 800× (C). |
Rheological characterization
The rheological characteristics of the OIG and the selected lyophilized L3 formulations were investigated to predict their in vivo behavior. It was found that the flow index values were lower than unity in all tested samples, indicating the pseudoplastic behavior of the formulated nanodispersions, as demonstrated in Figure 6A. This result was confirmed by studying the direct relation between the rate of shear and viscosity, as illustrated in Figure 6B. This could be useful, especially in the OIG formula, by keeping the dispersion at a relatively high viscosity during storage and, thus, minimizing the possibility of nanovesicular sedimentation and aggregation.85 Moreover, this viscosity can be reduced by shaking before use to enable dripping of the required dose. After application into the eye, the viscosity is supposed to rise again due to the in situ gelling which could be noticed by comparing the viscosity of the OIG formula before and after gelling at each rate of shear. Furthermore, it could be concluded that the viscosity of the reconstituted L3 formula was lower than that of the OIG formula. This might be due to the presence of more PF127 in the OIG formula, which could lead to its higher viscosity.86
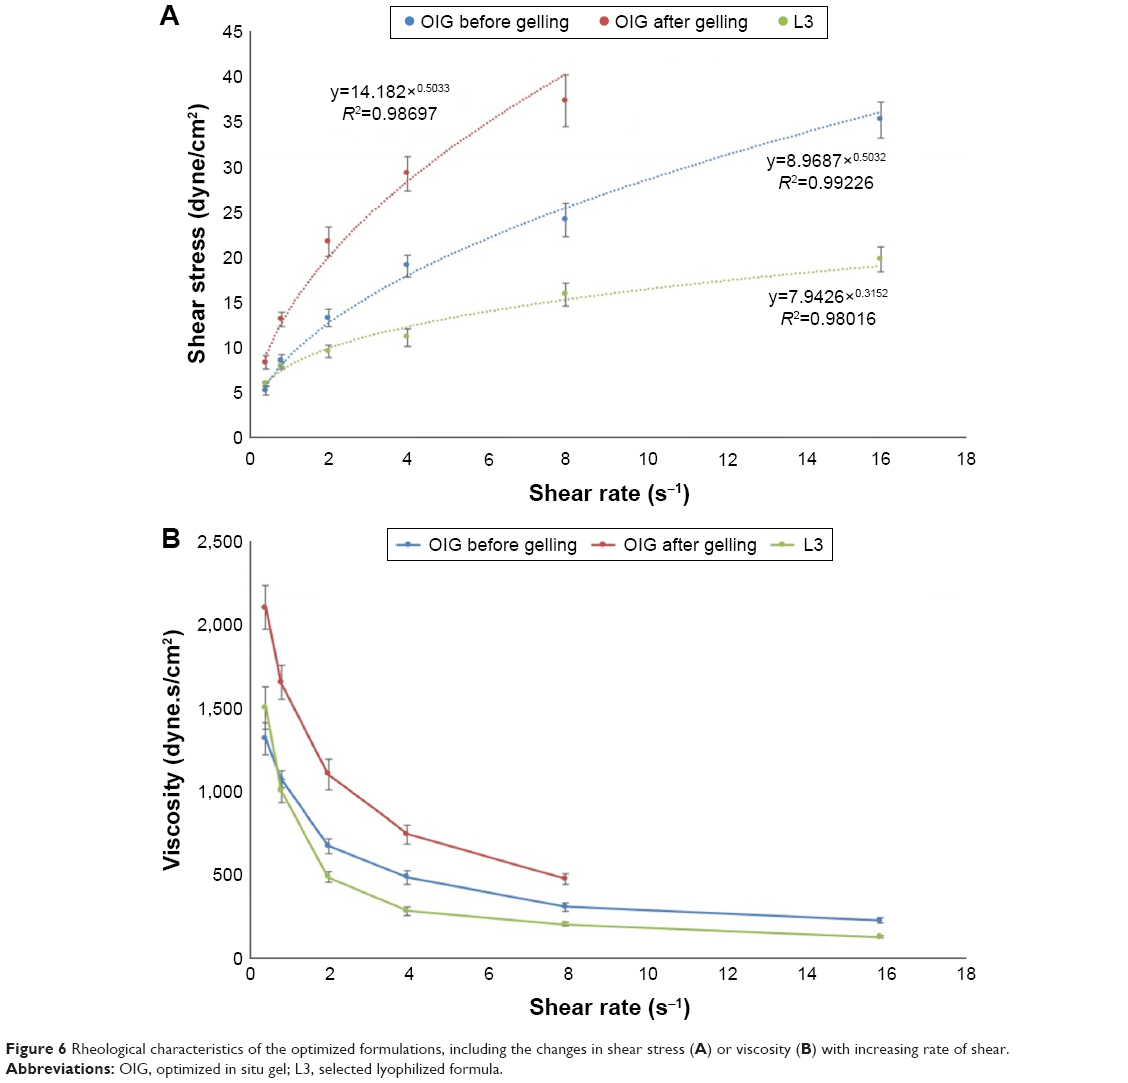 | Figure 6 Rheological characteristics of the optimized formulations, including the changes in shear stress (A) or viscosity (B) with increasing rate of shear. |
In vitro release
The drug release profiles from the OIG and L3 formulations were investigated and compared to the drug diffusion from its aqueous solution, as shown in Figure 7. It can be observed from the displayed data that the drug diffused from the drug solution with a rate faster than the investigated formulations. This could be statistically confirmed by calculating the similarity factor (f2), which was 10 and 23 upon comparing the drug solution profile to the formulas OIG and L3, respectively. This could be because of the lipophilic nature of the nanovesicles due to the presence of GTP which limited the water diffusion into the vesicles and, subsequently, slowed the drug release.87 Moreover, the drug release from the OIG formula was significantly slower than that from L3 with a similarity factor 33. The drug release kinetics were studied and found to be best fitted to Higuchi diffusion equation with R2>0.9, and higher than its respective values, representing the zero and/or the first release kinetics. The release half-life was statistically higher in the case of the OIG formula (1.66 h) when compared to the L3 formula (1.48 h), with p<0.05. This could be correlated to the higher viscosity measured in the case of the OIG formula, which might slow down the drug release according to Fick’s law of diffusion.88
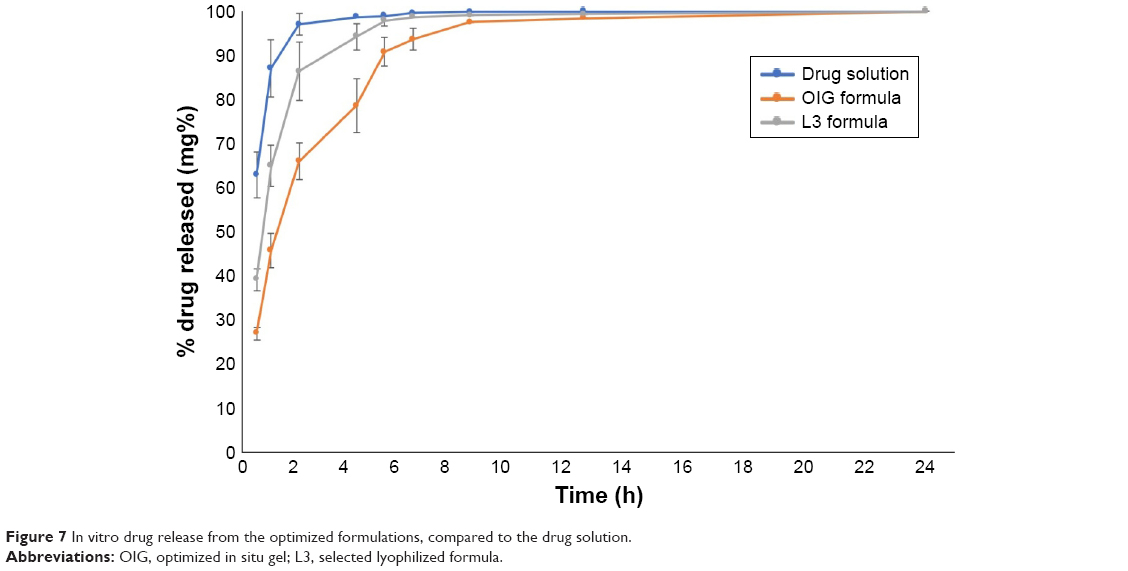 | Figure 7 In vitro drug release from the optimized formulations, compared to the drug solution. |
Ex vivo permeation
The drug permeation from the drug solution, OIG, and L3 formulations was measured at different time intervals as demonstrated in Figure 8. It can be observed that each of the investigated formulations had a flux significantly higher than the drug solution, with higher diffusion, partition and permeability coefficients. These results were in opposition to the high in vitro drug diffusion rate from the drug solution. From this, it could be concluded that the in vitro drug release/diffusion was not an ideal predictive tool for the ex vivo and in vivo permeation behavior. On the other hand, the high permeation from the optimized formulations could be explained by their nanosize in addition to the presence of PF127 acting as a permeation enhancer through the cornea.89 Furthermore, the selected lyophilized formula (L3) showed a higher drug permeation rate and extent than the OIG formulation. The low ex vivo drug permeation rate and extent from the OIG formula could be an expected consequence of its previously observed slow in vitro release and its high viscosity which might minimize the drug release and permeation.
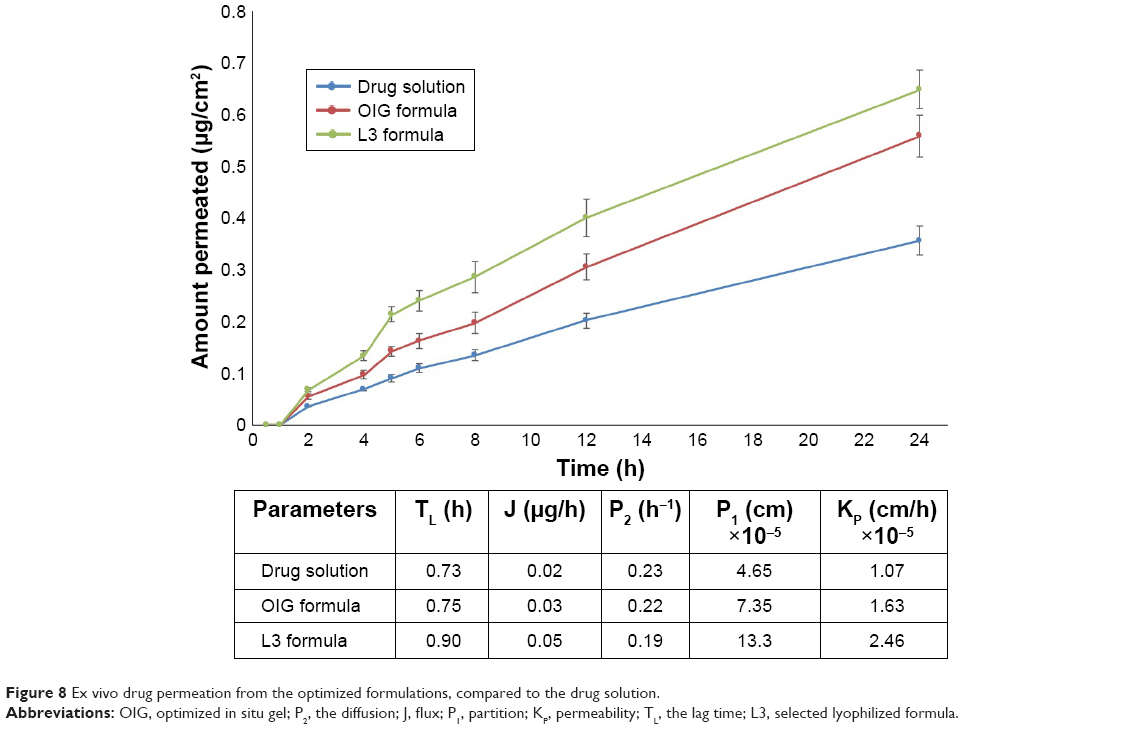 | Figure 8 Ex vivo drug permeation from the optimized formulations, compared to the drug solution. |
In vivo investigations
Histopathologic evaluation
The corneal tissues were imaged after 1 week of exposure to the optimized formulations and normal saline to investigate the safety and biocompatibility of the employed excipients. The corneal images captured by light microscope are demonstrated in Figure 9. The corneal tissue treated by normal saline solution was considered as a negative control and is demonstrated in Figure 9A with normal stratified epithelium and stromal layer. Moreover, Figure 9B and C reveals the absence of any alteration or inflammation signs within the corneal structure. This could be confirmed by the previous results observed by Al Khateb et al on investigating the safety of 20% PF127 in situ gel after ocular instillation.90 Consequently, our percentages of PF127 (either 6.53% in the L3 formula or 10% in the OIG) were <20% and consequently had no negative effect on the corneal tissues. Furthermore, the other components used (GTP, GG and trehalose) were previously found to be biocompatible and suitable for the ocular application.91
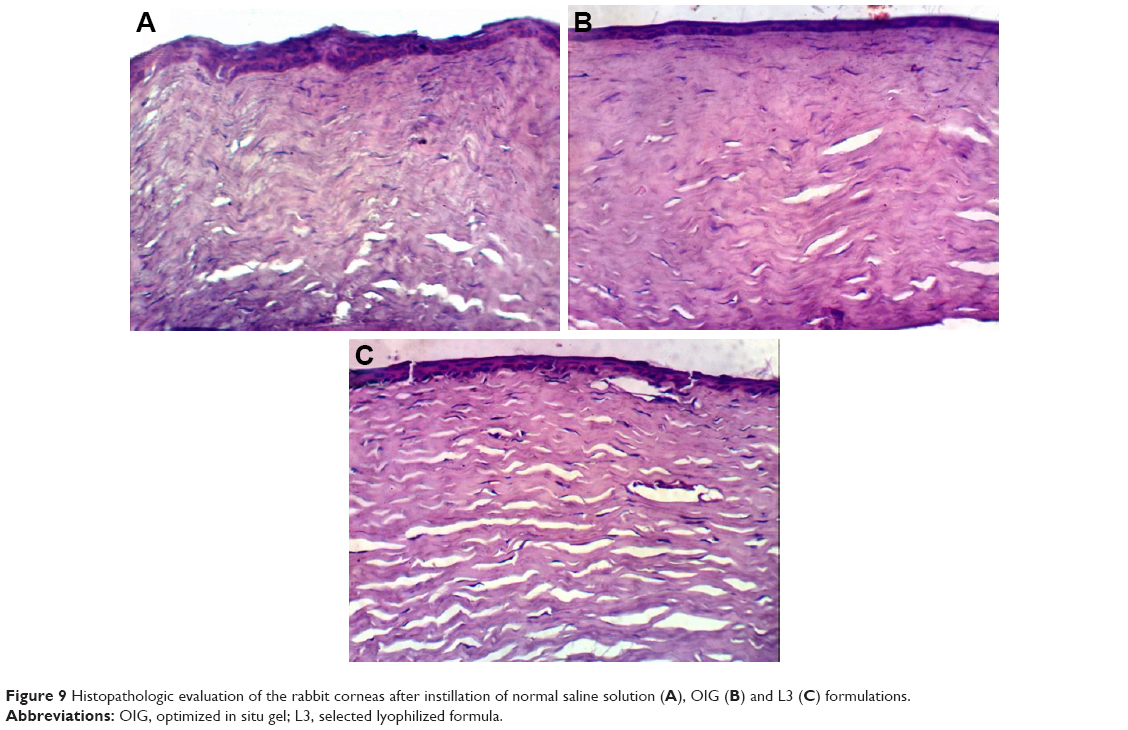 | Figure 9 Histopathologic evaluation of the rabbit corneas after instillation of normal saline solution (A), OIG (B) and L3 (C) formulations. |
Confocal laser scanning microscopy
CLSM was utilized for imaging the corneal layers and evaluating the abilities of formulations to enhance the drug permeation without any mechanical slicing of the investigated tissues. RhB was used as an indicator for its fluorescent visualization by CLSM. It can be noticed from Figure 10A that the RhB solution was detected at a depth of 12 μm, while the optimized formulations (OIG and L3) enhanced the deep penetration of RhB down to 16 and 26 μm, respectively, as demonstrated in Figure 10B and C. This was in agreement with the ex vivo permeation results with the same order of permeation enhancement (L3 > OIG > aqueous solution). The obtained results are comparable to the previously recorded RhB permeation (18 μm) loaded in Tri/Tetra-block copolymeric nanocarriers in a study conducted by Salama and Shamma.57
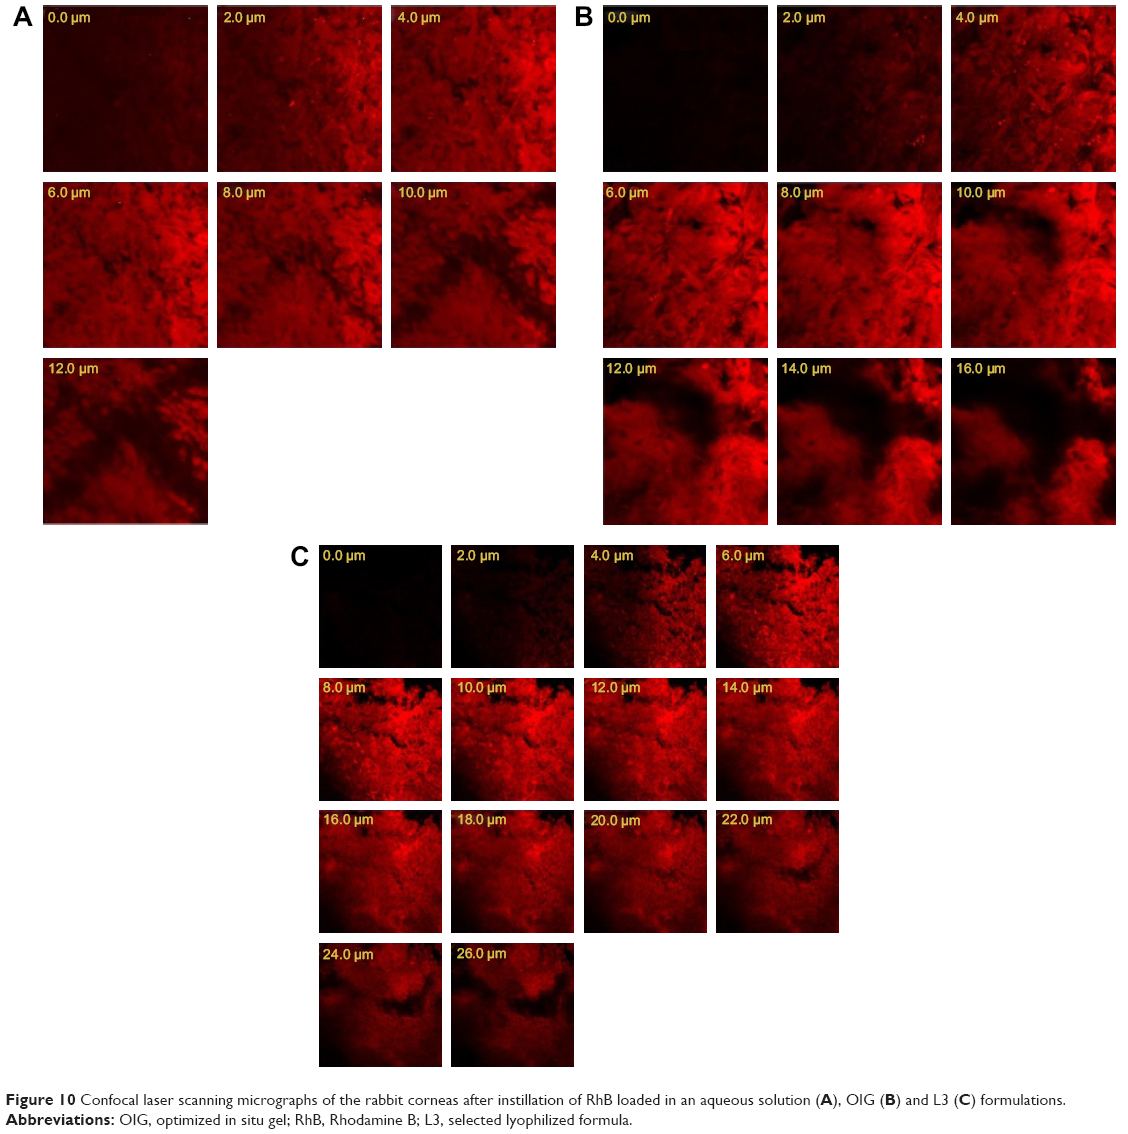 | Figure 10 Confocal laser scanning micrographs of the rabbit corneas after instillation of RhB loaded in an aqueous solution (A), OIG (B) and L3 (C) formulations. |
Conclusion
In this study, nanostructured in situ gels as well as inserts were fabricated as novel systems for the ocular delivery of tenoxicam. The nanovesicles were successfully prepared using simple modified thin film hydration technique and designed based on Box–Behnken model. The optimized insert formulation showed superiority in the drug diffusion, ex vivo and in vivo permeation, when compared to the OIG formulation. Consequently, the prepared lyophilized nanostructured insert could be considered as a promising ocular delivery carrier with high biocompatibility and efficiency.
Acknowledgment
We acknowledge the Central Laboratory of Nanotechnology and Advanced Materials (NAMCL), National Institute for Agricultural Research, Cairo University for helping us in the imaging of rabbit corneas using confocal scanning laser microscope.
Disclosure
The authors report no conflicts of interest in this work.
References
Eren OT, Armağan R, Talmaç MA. Nonsteroidal Anti-inflammatory Drugs (NSAIDs) and Corticosteroids. In: Korkusuz F, editor. Musculoskeletal Research and Basic Science. Amsterdam: Springer; 2016:683–693. | ||
Brayfield A. Martindale: The Complete Drug Reference. NY: Pharmaceutical Press; 2014. | ||
Moffat AC. Clarke’s Analysis of Drugs and Poisons. NY: Pharmaceutical Press; 2011. | ||
Madni MA, Raza A, Abbas S, et al. Determination of tenoxicam in the plasma by reverse phase HPLC method using single step extraction technique: a reliable and cost effective approach. Acta Pol Pharm. 2016;73(5):1129–1134. | ||
Bandyopadhyay R, Eveleth D, Van Haarlem T, et al. Inventors; Google Patents, assignee. Method of using COX-2 inhibitors in the treatment and prevention of ocular COX-2 mediated disorders. US 20020128267 A1. 2002 Sep 12. | ||
Cagle G, Abshire RL, Stroman DW, et al. Inventors; Google Patents, assignee. Methods of treating ophthalmic, otic and nasal infections and attendant inflammation. US 6395746 B1. 2002 May 28. | ||
Del Puppo M, Kienle MG, Ratiglia R, et al. Intraocular and plasma kinetics of tenoxicam in rabbits. Graefes Arch Clin Exp Ophthalmol. 1993;231(2):115–117. | ||
Gratieri T, Santer V, Kalia YN. Basic principles and current status of transcorneal and transscleral iontophoresis. Expert Opin Drug Deliv. 2017;14(9):1091–1102. | ||
Thassu D, Chader GJ. Ocular Drug Delivery Systems: Barriers and Application of Nanoparticulate Systems. FL: CRC Press; 2012. | ||
Prausnitz MR, Noonan JS. Permeability of cornea, sclera, and conjunctiva: a literature analysis for drug delivery to the eye. J Pharm Sci. 1998;87(12):1479–1488. | ||
Gaudana R, Ananthula HK, Parenky A, Mitra AK. Ocular drug delivery. AAPS J. 2010;12(3):348–360. | ||
Schoenwald RD, Ward RL. Relationship between steroid permeability across excised rabbit cornea and octanol-water partition coefficients. J Pharm Sci. 1978;67(6):786–788. | ||
Habib FS, Fouad EA, Abdel-Rhaman MS, Fathalla D. Liposomes as an ocular delivery system of fluconazole: in-vitro studies. Acta Ophthalmol. 2010;88(8):901–904. | ||
Law SL, Huang KJ, Chiang CH. Acyclovir-containing liposomes for potential ocular delivery: corneal penetration and absorption. J Control Release. 2000;63(1–2):135–140. | ||
El-Gazayerly ON, Hikal AH. Preparation and evaluation of acetazolamide liposomes as an ocular delivery system. Int J Pharm. 1997;158(2):121–127. | ||
Zhang J, Liang X, Li X, et al. Ocular delivery of cyanidin-3-glycoside in liposomes and its prevention of selenite-induced oxidative stress. Drug Dev Ind Pharm. 2016;42(4):546–553. | ||
Chen H, Pan H, Li P, et al. The potential use of novel chitosan-coated deformable liposomes in an ocular drug delivery system. Colloids Surf B Biointerfaces. 2016;143:455–462. | ||
Takeuchi H, Matsui Y, Yamamoto H, Kawashima Y. Mucoadhesive properties of carbopol or chitosan-coated liposomes and their effectiveness in the oral administration of calcitonin to rats. J Control Release. 2003;86(2–3):235–242. | ||
Chiou CJ, Tseng LP, Deng MC, et al. Mucoadhesive liposomes for intranasal immunization with an avian influenza virus vaccine in chickens. Biomaterials. 2009;30(29):5862–5868. | ||
Vyas SP, Mysore N, Jaitely V, Venkatesan N. Discoidal niosome based controlled ocular delivery of timolol maleate. Pharmazie. 1998;53(7):466–469. | ||
Abdelkader H, Ismail S, Kamal A, Alany RG. Design and evaluation of controlled-release niosomes and discomes for naltrexone hydrochloride ocular delivery. J Pharm Sci. 2011;100(5):1833–1846. | ||
Abdelbary GA, Amin MM, Zakaria MY. Ocular ketoconazole-loaded proniosomal gels: formulation, ex vivo corneal permeation and in vivo studies. Drug Deliv. 2017;24(1):309–319. | ||
Paradkar MU, Parmar M. Formulation development and evaluation of Natamycin niosomal in-situ gel for ophthalmic drug delivery. J Drug Deliv Sci Technol. 2017;39:113–122. | ||
Abdelbary AA, Abd-Elsalam WH, Al-Mahallawi AM. Fabrication of novel ultradeformable bilosomes for enhanced ocular delivery of terconazole: in vitro characterization, ex vivo permeation and in vivo safety assessment. Int J Pharm. 2016;513(1–2):688–696. | ||
González-Rodríguez ML, Arroyo CM, Cózar-Bernal MJ, et al. Deformability properties of timolol-loaded transfersomes based on the extrusion mechanism. Statistical optimization of the process. Drug Dev Ind Pharm. 2016;42(10):1683–1694. | ||
Rodriguez Villanueva J, Rodriguez Villanueva L. Turning the screw even further to increase microparticle retention and ocular bioavailability of associated drugs: the bioadhesion goal. Int J Pharm. 2017;531(1):167–178. | ||
Grimaldi N, Andrade F, Segovia N, et al. Lipid-based nanovesicles for nanomedicine. Chem Soc Rev. 2016;45(23):6520–6545. | ||
Duxfield L, Sultana R, Wang R, et al. Ocular delivery systems for topical application of anti-infective agents. Drug Dev Ind Pharm. 2016;42(1):1–11. | ||
M A Fathalla Z, Vangala A, Longman M, et al. Poloxamer-based thermoresponsive ketorolac tromethamine in situ gel preparations: design, characterisation, toxicity and transcorneal permeation studies. Eur J Pharm Biopharm. 2017;114:119–134. | ||
Patel N, Thakkar V, Metalia V, Baldaniya L, Gandhi T, Gohel M. Formulation and development of ophthalmic in situ gel for the treatment ocular inflammation and infection using application of quality by design concept. Drug Dev Ind Pharm. 2016;42(9):1406–1423. | ||
Fernández-Ferreiro A, Silva-Rodríguez J, Otero-Espinar FJ, et al. In vivo eye surface residence determination by high-resolution scintigraphy of a novel ion-sensitive hydrogel based on gellan gum and kappa-carrageenan. Eur J Pharm Biopharm. 2017;114:317–323. | ||
Mealy JE, Fedorchak MV, Little SR. In vitro characterization of a controlled-release ocular insert for delivery of brimonidine tartrate. Acta Biomater. 2014;10(1):87–93. | ||
Hornof M, Weyenberg W, Ludwig A, Bernkop-Schnürch A. Mucoadhesive ocular insert based on thiolated poly (acrylic acid): development and in vivo evaluation in humans. J Control Release. 2003;89(3):419–428. | ||
Refai H, Tag R. Development and characterization of sponge-like acyclovir ocular minitablets. Drug Deliv. 2011;18(1):38–45. | ||
Samad A, Sultana Y, Aqil M. Liposomal drug delivery systems: an update review. Curr Drug Deliv. 2007;4(4):297–305. | ||
Doppalapudi S, Jain A, Chopra DK, Khan W. Psoralen loaded liposomal nanocarriers for improved skin penetration and efficacy of topical PUVA in psoriasis. Eur J Pharm Sci. 2017;96:515–529. | ||
Shamma RN, Elsayed I. Transfersomal lyophilized gel of buspirone HCl: formulation, evaluation and statistical optimization. J Liposome Res. 2013;23(3):244–254. | ||
Ferreira SL, Bruns RE, Ferreira HS, et al. Box-Behnken design: an alternative for the optimization of analytical methods. Anal Chim Acta. 2007;597(2):179–186. | ||
Yang R, Nam K, Kim SW, et al. Factorial design based multivariate modeling and optimization of tunable bioresponsive arginine grafted poly (cystaminebis (acrylamide)-diaminohexane) polymeric matrix based nanocarriers. Mol Pharm. 2017;14(1):252–263. | ||
Surianarayanan R, Shivakumar HG, Vegesna NSKV, Srivastava A. Effect of sample concentration on the characterization of liposomes using dynamic light scattering technique. Pharm Methods. 2016;7(1):70–74. | ||
Chang R, Yang J, Ge S, et al. Synthesis and self-assembly of octenyl succinic anhydride modified short glucan chains based amphiphilic biopolymer: micelles, ultrasmall micelles, vesicles, and lutein encapsulation/release. Food Hydrocoll. 2017;67:14–26. | ||
Liu Z, Li J, Nie S, Liu H, Ding P, Pan W. Study of an alginate/HPMC-based in situ gelling ophthalmic delivery system for gatifloxacin. Int J Pharm. 2006;315(1–2):12–17. | ||
Wei G, Xu H, Ding PT, Li SM, Zheng JM. Thermosetting gels with modulated gelation temperature for ophthalmic use: the rheological and gamma scintigraphic studies. J Control Release. 2002;83(1):65–74. | ||
Choia HG, Jungb JH, Ryub JM, Yoonb SJ, Oha YK, Kima CK. Development of in situ-gelling and mucoadhesive acetaminophen liquid suppository. Int J Pharm. 1998;165(1):33–44. | ||
ElKasabgy NA, Elsayed I, Elshafeey AH. Design of lipotomes as a novel dual functioning nanocarrier for bioavailability enhancement of lacidipine: in-vitro and in-vivo characterization. Int J Pharm. 2014;472(1–2):369–379. | ||
Liao J, Wei X, Ran B, Peng J, Qu Y, Qian Z. Polymer hybrid magnetic nanocapsules encapsulating IR820 and PTX for external magnetic field-guided tumor targeting and multifunctional theranostics. Nanoscale. 2017;9(7):2479–2491. | ||
Faith D, Horsfield CJ, Nazarov W. Characterization of pore size of trimethylol propane triacrylate (TMPTA) polymer foam by pulsed sputter coating and SEM analysis. J Mater Sci. 2006;41(13):3973–3977. | ||
Morsi NM, Abdelbary GA, Ahmed MA. Silver sulfadiazine based cubosome hydrogels for topical treatment of burns: development and in vitro/in vivo characterization. Eur J Pharm Biopharm. 2014;86(2):178–189. | ||
Ye F, Miao M, Lu K, Jiang B, Li X, Cui SW. Structure and physicochemical properties for modified starch-based nanoparticle from different maize varieties. Food Hydrocoll. 2017;67:37–44. | ||
Rathod LV, Kapadia R, Sawant KK. A novel nanoparticles impregnated ocular insert for enhanced bioavailability to posterior segment of eye: In vitro, in vivo and stability studies. Mater Sci Eng C Mater Biol Appl. 2017;71:529–540. | ||
Nagarwal RC, Kumar R, Pandit JK. Chitosan coated sodium alginate-chitosan nanoparticles loaded with 5-FU for ocular delivery: in vitro characterization and in vivo study in rabbit eye. Eur J Pharm Sci. 2012;47(4):678–685. | ||
Balzus B, Sahle FF, Hönzke S, et al. Formulation and ex vivo evaluation of polymeric nanoparticles for controlled delivery of corticosteroids to the skin and the corneal epithelium. Eur J Pharm Biopharm. 2017;115:122–130. | ||
Al-mahallawi AM, Khowessah OM, Shoukri RA. Enhanced non invasive trans-tympanic delivery of ciprofloxacin through encapsulation into nano-spanlastic vesicles: Fabrication, in-vitro characterization, and comparative ex-vivo permeation studies. Int J Pharm. 2017;522(1–2):157–164. | ||
de Oliveira Vercik LC, Vercik A, da Silva Rigo EC. Kinetics of silver nanoparticle release from chitosan spheres. MRS Advances. 2017;2(19–20):1089–1094. | ||
Kim T, Kang E, Chun I, Gwak H. Pharmacokinetics of formulated tenoxicam transdermal delivery systems. J Pharm Pharmacol. 2008;60(1):135–138. | ||
Sanchez-Lopez E, Egea MA, Cano A, et al. PEGylated PLGA nanospheres optimized by design of experiments for ocular administration of dexibuprofen-in vitro, ex vivo and in vivo characterization. Colloids Surf B Biointerfaces. 2016;145:241–250. | ||
Salama AH, Shamma RN. Tri/tetra-block co-polymeric nanocarriers as a potential ocular delivery system of lornoxicam: in-vitro characterization, and in-vivo estimation of corneal permeation. Int J Pharm. 2015;492(1–2):28–39. | ||
Venkateswarlu V, Manjunath K. Preparation, characterization and in vitro release kinetics of clozapine solid lipid nanoparticles. J Control Release. 2004;95(3):627–638. | ||
Caddeo C, Manca ML, Matos M, et al. Functional response of novel bioprotective poloxamer-structured vesicles on inflamed skin. Nanomedicine. 2017;13(3):1127–1136. | ||
Dhar S, Murawala P, Shiras A, Pokharkar V, Prasad BL. Gellan gum capped silver nanoparticle dispersions and hydrogels: cytotoxicity and in vitro diffusion studies. Nanoscale. 2012;4(2):563–567. | ||
Morsi N, Ibrahim M, Refai H, El Sorogy H. Nanoemulsion-based electrolyte triggered in situ gel for ocular delivery of acetazolamide. Eur J Pharm Sci. 2017;104:302–314. | ||
Baş D, Boyaci IH. Modeling and optimization I: usability of response surface methodology. J Food Eng. 2007;78(3):836–845. | ||
Vuchkov IN, Boyadjieva NL. Quality Improvement with Design of Experiments: A Response Surface Approach. Amsterdam: Springer; 2013. | ||
Lason E, Sikora E, Ogonowski J. Influence of process parameters on properties of Nanostructured Lipid Carriers (NLC) formulation. Acta Biochim Pol. 2013;60(4):773–777. | ||
Aditya NP, Macedo AS, Doktorovova S, et al. Development and evaluation of lipid nanocarriers for quercetin delivery: A comparative study of solid lipid nanoparticles (SLN), nanostructured lipid carriers (NLC), and lipid nanoemulsions (LNE). Food Sci Technol. 2014;59(1):115–121. | ||
Izquierdo P, Feng J, Esquena J, et al. The influence of surfactant mixing ratio on nano-emulsion formation by the pit method. J Colloid Interface Sci. 2005;285(1):388–394. | ||
Freitas C, Müller RH. Effect of light and temperature on zeta potential and physical stability in solid lipid nanoparticle (SLN™) dispersions. Int J Pharm. 1998;168(2):221–229. | ||
Chakraborty H, Devi PG, Sarkar M, et al. New functions of old drugs aureolic acid group of anticancer antibiotics and non-steroidal anti-inflammatory drugs. In: Choudhary MI, Perry G, editors. Recent Advances in Medicinal Chemistry. Amsterdam: Elsevier Science; 2015:3–55. | ||
Bezerra MA, Santelli RE, Oliveira EP, Villar LS, Escaleira LA. Response surface methodology (RSM) as a tool for optimization in analytical chemistry. Talanta. 2008;76(5):965–977. | ||
Vial S, Reis RL, Oliveira JM. Recent advances using gold nanoparticles as a promising multimodal tool for tissue engineering and regenerative medicine. Curr Opin Solid State Mater Sci. 2017;21(2):92–112. | ||
White B, Banerjee S, O’Brien S, Turro NJ, Herman IP. Zeta-potential measurements of surfactant-wrapped individual single-walled carbon nanotubes. J Phys Chem C. 2007;111(37):13684–13690. | ||
Yeh MK, Chang LC, Chiou AH. Improving tenoxicam solubility and bioavailability by cosolvent system. AAPS PharmSciTech. 2009;10(1):166–171. | ||
Yusuf M, Sharma V, Pathak K. Nanovesicles for transdermal delivery of felodipine: Development, characterization, and pharmacokinetics. Int J Pharm Investig. 2014;4(3):119–130. | ||
El Maghraby GM, Williams AC, Barry BW. Oestradiol skin delivery from ultradeformable liposomes: refinement of surfactant concentration. Int J Pharm. 2000;196(1):63–74. | ||
Dewan M, Sarkar G, Bhowmik M, et al. Effect of gellan gum on the thermogelation property and drug release profile of Poloxamer 407 based ophthalmic formulation. Int J Biol Macromol. 2017;102:258–265. | ||
Sniegowski M, Erlanger M, Velez-Montoya R, Olson JL. Difference in ocular surface temperature by infrared thermography in phakic and pseudophakic patients. Clin Ophthalmol. 2015;9:461–466. | ||
Souza LG, Silva EJ, Martins AL, et al. Development of topotecan loaded lipid nanoparticles for chemical stabilization and prolonged release. Eur J Pharm Biopharm. 2011;79(1):189–196. | ||
El-Dahmy RM, Elsayed I, Elshafeey AH, Gawad NA, El-Gazayerly ON. Optimization of long circulating mixed polymeric micelles containing vinpocetine using simple lattice mixture design, in vitro and in vivo characterization. Int J Pharm. 2014;477(1–2):39–46. | ||
Szleifer I, Gerasimov OV, Thompson DH. Spontaneous liposome formation induced by grafted poly(ethylene oxide) layers: theoretical prediction and experimental verification. Proc Natl Acad Sci U S A. 1998;95(3):1032–1037. | ||
Kalaria DR, Sharma G, Beniwal V, Ravi Kumar MN. Design of biodegradable nanoparticles for oral delivery of doxorubicin: in vivo pharmacokinetics and toxicity studies in rats. Pharm Res. 2009;26(3):492–501. | ||
Jain AK, Swarnakar NK, Godugu C, Singh RP, Jain S. The effect of the oral administration of polymeric nanoparticles on the efficacy and toxicity of tamoxifen. Biomaterials. 2011;32(2):503–515. | ||
Chacon M, Molpeceres J, Berges L, Guzmán M, Aberturas MR. Stability and freeze-drying of cyclosporine loaded poly(D,L lactide-glycolide) carriers. Eur J Pharm Sci. 1999;8(2):99–107. | ||
Chaurasia SS, Lim RR, Lakshminarayanan R, Mohan RR. Nanomedicine approaches for corneal diseases. J Funct Biomater. 2015;6(2):277–298. | ||
Ramos Yacasi GR, Calpena Campmany AC, Egea Gras MA, Espina García M, García López ML. Freeze drying optimization of polymeric nanoparticles for ocular flurbiprofen delivery: effect of protectant agents and critical process parameters on long-term stability. Drug Dev Ind Pharm. 2017;43(4):637–651. | ||
Chan J, Maghraby GM, Craig JP, Alany RG. Phase transition water-in-oil microemulsions as ocular drug delivery systems: in vitro and in vivo evaluation. Int J Pharm. 2007;328(1):65–71. | ||
Soliman GM, Fetih G, Abbas AM. Thermosensitive bioadhesive gels for the vaginal delivery of sildenafil citrate: in vitro characterization and clinical evaluation in women using clomiphene citrate for induction of ovulation. Drug Dev Ind Pharm. 2017;43(3):399–408. | ||
Jenning V, Schäfer-Korting M, Gohla S. Vitamin A-loaded solid lipid nanoparticles for topical use: drug release properties. J Control Release. 2000;66(2–3):115–126. | ||
Siepmann J, Peppas NA. Modeling of drug release from delivery systems based on hydroxypropyl methylcellulose (HPMC). Adv Drug Deliv Rev. 2001;48(2–3):139–157. | ||
Chen Y, Lu Y, Zhong Y, Wang Q, Wu W, Gao S. Ocular delivery of cyclosporine A based on glyceryl monooleate/poloxamer 407 liquid crystalline nanoparticles: preparation, characterization, in vitro corneal penetration and ocular irritation. J Drug Target. 2012;20(10):856–863. | ||
Al Khateb K, Ozhmukhametova EK, Mussin MN, et al. In situ gelling systems based on Pluronic F127/Pluronic F68 formulations for ocular drug delivery. Int J Pharm. 2016;502(1–2):70–79. | ||
Del Amo EM, Urtti A. Current and future ophthalmic drug delivery systems. A shift to the posterior segment. Drug Discov Today. 2008;13(3–4):135–143. |
 © 2017 The Author(s). This work is published and licensed by Dove Medical Press Limited. The
full terms of this license are available at https://www.dovepress.com/terms
and incorporate the Creative Commons Attribution
- Non Commercial (unported, 3.0) License.
By accessing the work you hereby accept the Terms. Non-commercial uses of the work are permitted
without any further permission from Dove Medical Press Limited, provided the work is properly
attributed. For permission for commercial use of this work, please see paragraphs 4.2 and 5 of our Terms.
© 2017 The Author(s). This work is published and licensed by Dove Medical Press Limited. The
full terms of this license are available at https://www.dovepress.com/terms
and incorporate the Creative Commons Attribution
- Non Commercial (unported, 3.0) License.
By accessing the work you hereby accept the Terms. Non-commercial uses of the work are permitted
without any further permission from Dove Medical Press Limited, provided the work is properly
attributed. For permission for commercial use of this work, please see paragraphs 4.2 and 5 of our Terms.