Back to Journals » Hepatic Medicine: Evidence and Research » Volume 6
Systemic vascular resistance in cirrhosis: a predictor of severity?
Authors Gaduputi V ![]() , Abdulsamad M, Sakam S, Abbas N, Tariq H, Ihimoyan A
, Abdulsamad M, Sakam S, Abbas N, Tariq H, Ihimoyan A
Received 30 April 2014
Accepted for publication 30 May 2014
Published 6 August 2014 Volume 2014:6 Pages 95—101
DOI https://doi.org/10.2147/HMER.S67036
Checked for plagiarism Yes
Review by Single anonymous peer review
Peer reviewer comments 3
Vinaya Gaduputi, Molham Abdulsamad, Sailaja Sakam, Naeem Abbas, Hassan Tariq, Ariyo Ihimoyan
Bronx Lebanon Hospital Center, Department of Medicine, Bronx, NY, USA
Background: The aim of this study was to investigate whether systemic vascular resistance (SVR) correlates with validated prospective scoring systems such as Model for End-stage Liver Disease (MELD) and its modifications.
Methods: Patients with cirrhosis, who were admitted to hospital with decompensation (as defined by development of ascites, hepatic encephalopathy, and variceal bleeding) and underwent echocardiography were included in this study. Laboratory data required for computing MELD score, serum bilirubin, serum creatinine, international normalized ratio, and serum sodium were collected for every patient. We tabulated hemodynamic and echocardiography parameters that enabled calculation of SVR. We analyzed the correlation between SVR and each of the individual prognostic scores.
Results: A total of 771 patients with a diagnosis of decompensated cirrhosis were included in the study. Two hundred and sixty-two patients were found to have a low sodium level (<135 mEq/L) and 509 were found to have a normal sodium level (>135 mEq/L). In the patients with hyponatremia, we found statistically significant inverse correlations between SVR and validated liver severity models. However, these correlations were not seen in patients with normonatremia.
Conclusion: We observed a statistically significant inverse correlation between SVR and all the validated liver disease severity models used in this study among patients with hyponatremia but not in those with normonatremia.
Keywords: systemic vascular resistance, cirrhosis, Model for End-stage Liver Disease, scoring systems
Introduction
Cirrhosis is the end stage in the spectrum of chronic liver disease, characterized by advanced fibrosis and formation of regenerative nodules with distortion of underlying normal hepatic architecture. The most commonly implicated causes of cirrhosis include viral agents (hepatitis B and hepatitis C), alcohol, and nonalcoholic fatty liver disease.1 The prevalence of cirrhosis in the general population has been estimated to be between 4.5% and 9.5% in some studies based on autopsies.2,3 There are multiple prognostic scores that predict the mortality from chronic liver disease, of which the Child-Pugh score and the Model for End-stage Liver Disease (MELD) score are the most commonly used. MELD is a validated scoring system used to predict mortality and is a composite of the patient’s laboratory values for serum bilirubin and serum creatinine, and the international normalized ratio (INR) for prothrombin time. The MELD scoring system is currently used by the United Network for Organ Sharing to stratify and prioritize patients for liver transplantation.4 The MELD score has been shown to be at least equivalent to the Child-Pugh score5 in predicting survival of patients with cirrhosis. However, the MELD score does not suffer from subjective scoring differences (such as those that could occur with the Child-Pugh scoring system while estimating the degree of ascites and encephalopathy)6–8 and has a greater discriminatory continuous scoring capacity.
Hyponatremia is a common laboratory finding in patients with decompensated liver disease. It has been noted in several studies that inclusion of the serum sodium level, especially in hyponatremic patients, increases the predictive accuracy of MELD in chronic liver disease.9–12 Hyponatremia mirrors the underlying primary changes in hemodynamic parameters, such as vasodilation with decreased systemic vascular resistance (SVR),13–15 and subsequent compensatory neurohumoral adaptations,16 such as increased antidiuretic hormone secretion. The severity of vasodilation increases with progression of liver disease, leading to renal hypoperfusion and hepatorenal syndrome in some patients. It has been postulated that the marked reduction in SVR results from inability of the liver to metabolize circulating vasodilators such as nitric oxide, eicosanoids, bile salts, adenosine, and tachykinins.17 Therefore, SVR could theoretically be a single predictor for severity of liver disease. In this retrospective study, we aimed to determine the correlation of SVR with validated liver disease severity scoring systems like MELD and MELDNa (MELD sodium score). We also looked at the correlation between SVR and other scoring systems, including iMELD (integrated MELD), MESO (MELD to serum sodium ratio), and UKELD (United Kingdom Model for End-Stage Liver Disease).
Materials and methods
Patients
This retrospective study was performed according to the Declaration of Helsinki. The Bronx Lebanon Hospital Center Institution Review Board (IRB) at the study location approved the protocol. The period of study was the 10 years from 2002 to 2012. The data were collected from patient electronic medical records and tabulated in Microsoft Excel. Patients with cirrhosis who were admitted to hospital (floor and intensive care unit) with decompensation (development of ascites, hepatic encephalopathy, variceal bleeding) and underwent echocardiography within 30 days of the index admission were included in the study. Patients with pre-existing kidney disease and those with other possible causes of hyperdynamic circulation, including sepsis and thyrotoxicosis, were excluded, as were patients who had undergone any portosystemic or arteriovenous shunting procedure.
We collected baseline demographic data, including age, sex, and ethnicity, for the two study groups: normonatremic group (those with serum sodium level of >135 mEq/L), and the hyponatremic group (those with serum sodium level of <135 mEq/L). We also collected laboratory data, including serum bilirubin, serum creatinine, INR, and serum sodium for every patient included in the study. We tabulated the hemodynamic (heart rate, mean arterial blood pressure in mmHg) and echocardiography parameters (stroke volume in mL) that enabled us to calculate the SVR (mean arterial blood pressure in mmHg/cardiac output in L/minute). We calculated the MELD score [9.57× ln (creatinine in mg/dL) +3.78× ln (bilirubin in mg/dL) +11.2× ln (INR) +6.43], MELD-Na score [MELD +1.59*(135– Na in mmol/L)], MELDNa score [MELD − Na in mmol/L − (0.025*MELD*(140− Na in mmol/L)) +140], iMELD score [MELD + (age in years*0.3) − (0.7*Na in mmol/L) +100], MESO score [(MELD/Na in mmol/L)*100], and UKELD score [5*{1.5*ln (INR) +0.3*ln(creatinine in μmol/L) +0.6*ln (bilirubin in μmol/L) −13*ln (Na in mmol/L) +70}] for every patient in the study. We looked at the correlation between stroke volume and each of the abovementioned severity scores. We did not include Child-Pugh scores because there was considerable heterogeneity in documentation of subjective variables of ascites and hepatic encephalopathy found on retrospective chart review. Compliance of study subjects with medical therapy could not be ascertained beyond reasonable doubt.
MELD-Na and MELDNa scores are modifications of the original MELD scoring system incorporating serum sodium levels. Even though these two scores employ different equations for calculation, there was no significant difference observed between their accuracies for outcome prediction in acute decompensated hepatitis.18 As sodium is an independent risk factor for predicting mortality in liver disease, its incorporation led to a higher score being awarded to hyponatremic patients when compared with normonatremic patients having comparable MELD scores. Sodium was found to accurately weigh in and prognosticate the complications of cirrhosis, such as ascites and hepatorenal syndrome.9,18,19 MELD-Na was more accurate at predicting mortality, especially in patients with severe liver disease (MELD scores 20–39).20–22 Increased mortality with advancing age in cirrhosis has been observed in a number of studies.23,24 A review of multiple prognostic studies showed that age is the single most important predictor of mortality, but is not usually included in the standardized scoring systems.25 iMELD (integrated MELD) score which incorporates age into a liver disease severity scoring, had better performance in predicting 3-, 6-, and 12-month mortality.11 The hepatic venous pressure gradient is an independent prognostic factor for mortality in cirrhosis.26,27 The MESO score has been shown to correlate well with the hepatic venous pressure gradient and has been shown to improve the prognostic ability of MELD in patients with compensated or moderately decompensated cirrhosis.28 UKELD was developed as a substitute for MELD because the latter was not specifically designed to predict mortality in patients on the transplant list.5 UKELD has been shown to more accurately predict mortality on the transplant list when compared with MELD or MELD-Na scores.29
Evaluation of results
We intended to identify the prognostic value of SVR as a single entity, according to its correlation with prospectively validated scoring systems such as MELD and its modifications.
Statistical analysis
A P-value <0.05 was considered to be statistically significant. Linear regression, unpaired t-test were used to look at the relationship between two continuous variables. Fisher’s exact test was used for comparing two categorical variables.
Results
In total, 771 patients with a diagnosis of decompensated cirrhosis were admitted to the hospital between January 2002 and December 2012. Of these patients, 262 were found to have a low sodium level (≤135 mEq/L) and 509 were found to have a normal sodium level (>135 mEq/L).
Baseline characteristics for the hyponatremic and normonatremic patients are tabulated in Table 1. The hyponatremic group was younger (P=0.0012) but had a higher mean MELD score (P=0.0001) when compared with the normonatremic group. However, distributions according to sex, ethnicity, and etiology of liver disease were not significantly different between the two groups.
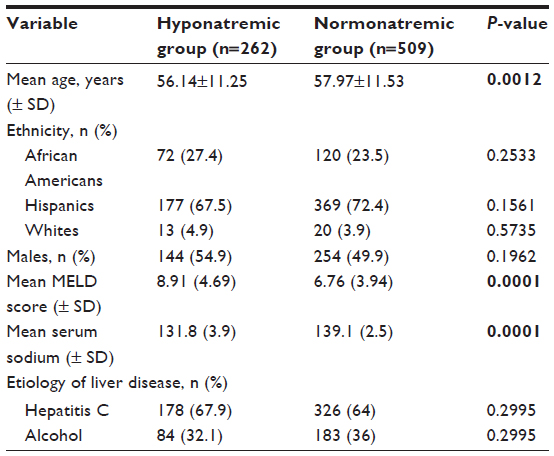 | Table 1 Baseline characteristics among hyponatremic and normonatremic patients showing that the two groups had significant differences in mean age, serum sodium levels, and MELD scores |
Linear regression analyses were performed to elucidate the correlation between SVR and each of the validated scores in the hyponatremic patients and normonatremic patients separately. There was a statistically significant inverse correlation (P=0.0376) between SVR and MELD score in patients with hyponatremia (Figure 1), but not in patients with normonatremia (P=0.29; Figure 2).
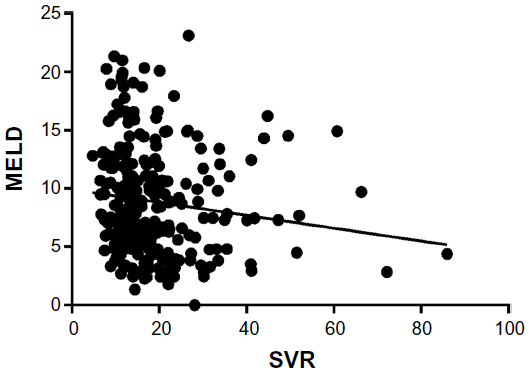 | Figure 1 Significant inverse correlation between SVR and MELD scores was found in the hyponatremic patients (P=0.0376; 95% confidence interval of slope −0.1068, −0.003442; R2=0.01672). |
 | Figure 2 No significant correlation between SVR and MELD scores was found in normonatremic patients (P=0.2924; 95% confidence interval of slope −0.04539, 0.01365; R2=0.002195). |
In patients with hyponatremia, there was a statistically significant inverse correlation between SVR and MELD-Na score (P=0.0322) and with MELDNa score (P=0.0194; Figures 3 and 4). We did not test for the correlation between SVR and MELD-Na score or MELDNa score in patients with normal serum sodium levels. These scores were validated only for lower levels of serum sodium.
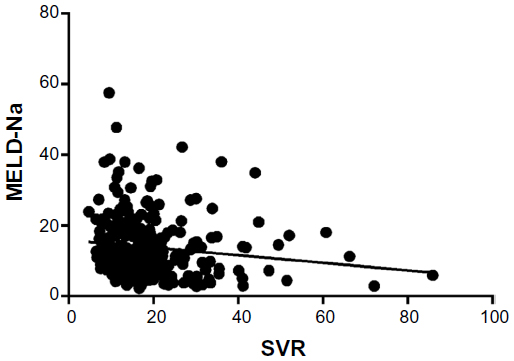 | Figure 3 A significant inverse correlation was found between SVR and MELD-Na scores in the hyponatremic patients (P=0.0322; 95% confidence interval of slope −0.2046, −0.009635; R2=0.01773). |
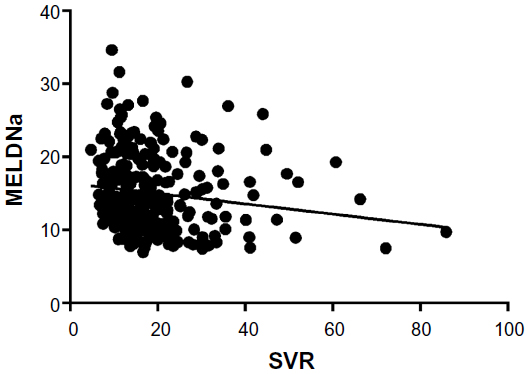 | Figure 4 Significant correlation between SVR and MELD Na scores was found in hyponatremic patients (P=0.0194; 95% confidence interval of slope −0.1287, −0.01174; R2=0.02109). |
There was a significant inverse correlation between the SVR and iMELD scores in patients with hyponatremia (P=0.0266) but not in those with normonatremia (P=0.4660) (Figures 5 and 6). There was a significant inverse correlation between the SVR and MESO scores in patients with hyponatremia (P=0.0356) but not in those with normonatremia (P=0.3036; Figures 7 and 8). There was also a significant inverse correlation between the SVR and UKELD scores in patients with hyponatremia (P=0.0225) but not in those with normonatremia (P=0.1380; Figures 9 and 10).
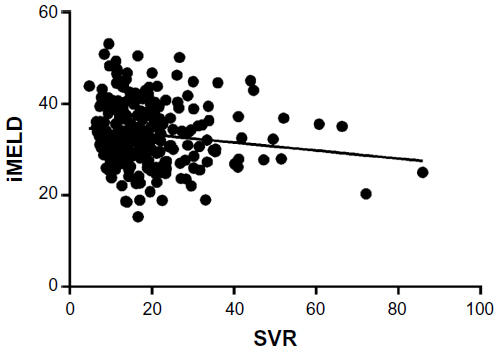 | Figure 5 A significant inverse correlation was found between SVR and iMELD scores in hyponatremic patients (P=0.0266; 95% confidence interval of slope −0.1649, −0.01064; R2=0.01899). |
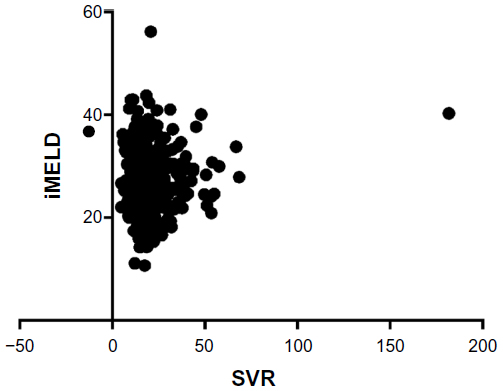 | Figure 6 No significant correlation was found between SVR and iMELD scores in the normonatremic patients (P=0.4660; 95% confidence interval of slope −0.02668, 0.05832; R2=0.001053). |
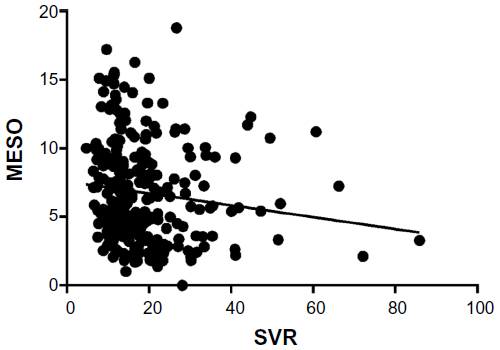 | Figure 7 Significant inverse correlation was found between SVR and MESO scores in hyponatremic patients (P=0.0356; 95% confidence interval of slope −0.08372, −0.003139; R2=0.01707). |
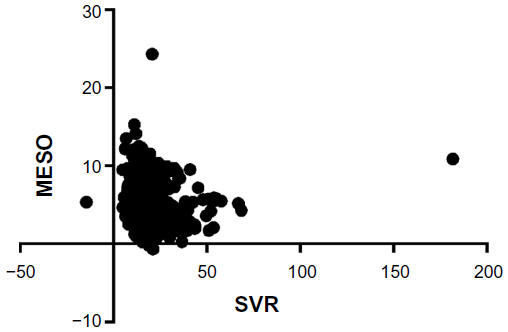 | Figure 8 No significant correlation was found between SVR and MESO scores in normonatremic patients (P=0.3036; 95% confidence interval of slope −0.03229, 0.01004; R2=0.002096). |
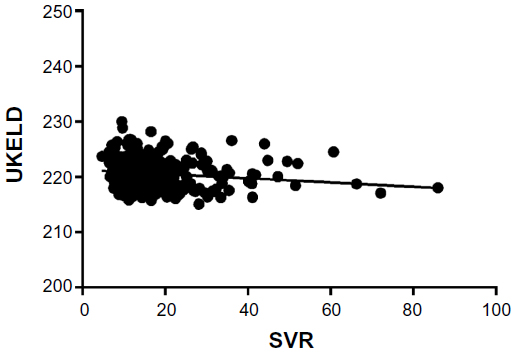 | Figure 9 A significant inverse correlation was found between SVR and UKELD scores in hyponatremic patients (P=0.0225; 95% confidence interval of slope −0.07063, −0.005569; R2=0.02009). |
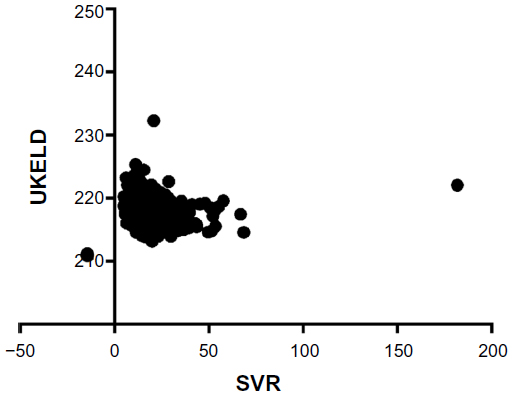 | Figure 10 No significant correlation was found between SVR and UKELD scores in normonatremic patients (P=0.1380; 95% confidence interval of slope −0.02741, 0.003773; R2=0.004360). |
Discussion
The pathognomonic hemodynamic changes in decompensated cirrhosis include a marked reduction in mean arterial blood pressure and SVR with an increase in cardiac output.13,30 The vasodilation results in an abrupt decrease in renal perfusion pressure, with subsequent compensatory activation of the sodium-retaining and water-retaining neurohumoral mechanisms, which include activation of the renin–angiotensin system, activation of the sympathetic nervous system, and increased secretion of antidiuretic hormone. This compensation leads to net renal sodium and water retention. The relationship between the precipitating (vasodilation) and compensatory phenomena is directly proportional.31,32 Therefore, serum sodium is a well recognized prognostic marker for severity of liver disease. The exact mechanism of vasodilation with a drop in SVR in patients with decompensated cirrhosis is not yet fully understood. The most common implicated chemical mediator is nitric oxide.33 It has been postulated that endotoxemia in cirrhosis induces expression of nitric oxide synthase within the vessel walls. Nitric oxide synthesized in this way is a potent vasodilator with a profound impact on mean arterial blood pressure and SVR.34,35 This vasodilatory effect is further exacerbated by inefficient hepatic clearance of nitric oxide due to portal–systemic shunting.36,37 Other potential local vasodilatory mediators in cirrhosis include carbon monoxide,38 prostacyclin,39 and hydrogen sulfide.40 We aimed to see if SVR calculated from echocardiographic parameters correlated well with the validated models used for assessing the severity of liver disease. We found that the inverse correlation was significant in patients with a low sodium level, regardless of the scoring model used. This was not the case in patients with normal serum sodium levels. This observation is testament to the fact that SVR is a direct function of worsening hepatic function manifest by its inability to metabolize circulating vasodilators. Just as serum sodium level (especially at lower levels) was shown to be an independent prognostic factor for mortality and a marker of the severity of liver disease, it is only consistent that SVR too could be a good independent prognostic factor. This understanding comes from the underlying pathophysiology of systemic vasodilation (decreased SVR) being the triggering factor for excess water retention with resultant dilutional hyponatremia. Further support for this argument comes from the observation that SVR had a poor correlation with any of the validated liver disease severity scores in the presence of normal serum sodium levels.
Our study was beset by the disadvantages inherent to a retrospective study. Even though we included only patients with a primary admitting diagnosis of decompensated liver cirrhosis, multiple unrecognized confounding variables could have led to false elevation of validated liver severity scores (nonhepatic causes of renal dysfunction, INR elevation). We only chose patients who underwent echocardiography during the index admission for inclusion in the study, thus creating potential selection bias. It could be argued that SVR was influenced by multiple factors other than hepatic dysfunction, including unrecognized sepsis, thyrotoxicosis, and use of vasodilatory medications. Use of vasodilatory medications (including type and dose) could not be ascertained in most of the patients due to their poor recall at the time of admission or inadequate documentation. We looked at the correlation between SVR and validated liver disease severity scores, but not mortality or morbidity rates directly. We could not calculate mortality rates due to inadequate follow-up after discharge. Even the inpatient mortality during the index admission was not taken into account because we could not definitely ascertain the cause of death for each individual case. Therefore, it is only by proxy that it can be stated that SVR could be a valuable prognostic tool. The SVR values used in this study were calculated indirectly (without indwelling arterial catheter placement or measurement) from an echocardiographic parameters [cardiac output in L/min which was calculated from the formula: (end diastolic volume − end systolic volume)*heart rate]. These echocardiographic parameters were subject to interobserver variability, as were the SVR values calculated from them. However, diastology studies done over the past decade have shown that echocardiography is both a versatile and reliable tool for measuring various cardiac indices, including vascular resistance, even being referred to as “a noninvasive Swan-Ganz catheter”.41
In conclusion, we observed a statistically significant inverse correlation between SVR and all validated liver disease severity models only in patients with low serum sodium levels. In view of the abovementioned drawbacks of this study, we recommend further studies to elucidate more clearly the prognostic value of SVR in predicting clinical outcomes for patients with decompensated liver cirrhosis.
Disclosure
The authors report no conflicts of interests in this work.
References
Heidelbaugh JJ, Bruderly M. Cirrhosis and chronic liver failure: part I. Diagnosis and evaluation. Am Fam Physician. 2006;74(5):756–762. | |
Graudal N, Leth P, Mårbjerg L, Galløe AM. Characteristics of cirrhosis undiagnosed during life: a comparative analysis of 73 undiagnosed cases and 149 diagnosed cases of cirrhosis, detected in 4929 consecutive autopsies. J Intern Med. 1991;230(2):165–171. | |
Melato M, Sasso F, Zanconati F. Liver cirrhosis and liver cancer. A study of their relationship in 2563 autopsies. Zentralbl Pathol. 1993;139(1):25–30. | |
Freeman RB Jr, Wiesner RH, Harper A, et al; UNOS/OPTN Liver Disease Severity Score, UNOS/OPTN Liver and Intestine, and UNOS/OPTN Pediatric Transplantation Committees. The new liver allocation system: moving toward evidence-based transplantation policy. Liver Transpl. 2002;8(9):851–858. | |
Cholongitas E, Marelli L, Shusang V, et al. A systematic review of the performance of the model for end-stage liver disease (MELD) in the setting of liver transplantation. Liver Transpl. 2006;12(7):1049–1061. | |
Oellerich M, Burdelski M, Lautz HU, et al. Assessment of pretransplant prognosis in patients with cirrhosis. Transplantation. 1991;51(4):801–806. | |
Testa R, Valente U, Risso D, et al. Can the MEGX test and serum bile acids improve the prognostic ability of Child-Pugh’s score in liver cirrhosis? Eur J Gastroenterol Hepatol. 1999;11(5):559–563. | |
Shrestha R, McKinley C, Showalter R, et al. Quantitative liver function tests define the functional severity of liver disease in early-stage cirrhosis. Liver Transpl Surg. 1997;3(2):166–173. | |
Heuman DM, Abou-Assi SG, Habib A, et al. Persistent ascites and low serum sodium identify patients with cirrhosis and low MELD scores who are at high risk for early death. Hepatology. 2004;40(4):802–810. | |
Londoño MC, Cárdenas A, Guevara M, et al. MELD score and serum sodium in the prediction of survival of patients with cirrhosis awaiting liver transplantation. Gut. 2007;56(9):1283–1290. | |
Luca A, Angermayr B, Bertolini G, et al. An integrated MELD model including serum sodium and age improves the prediction of early mortality in patients with cirrhosis. Liver Transpl. 2007;13(8):1174–1180. | |
Biselli M, Gitto S, Gramenzi A, et al. Six score systems to evaluate candidates with advanced cirrhosis for orthotopic liver transplant: which is the winner? Liver Transpl. 2010;16(8):964–973. | |
Schrier RW, Arroyo V, Bernardi M, Epstein M, Henriksen JH, Rodés J. Peripheral arterial vasodilation hypothesis: a proposal for the initiation of renal sodium and water retention in cirrhosis. Hepatology. 1988;8(5):1151–1157. | |
Abelmann WH. Hyperdynamic circulation in cirrhosis: a historical perspective. Hepatology. 1994;20(5):1356–1358. | |
Groszmann RJ. Hyperdynamic circulation of liver disease 40 years later: pathophysiology and clinical consequences. Hepatology. 1994;20(5):1359–1363. | |
Ginès P, Guevara M. Hyponatremia in cirrhosis: pathogenesis, clinical significance, and management. Hepatology. 2008;48(3):1002–1010. | |
Ginès P, Fernández-Esparrach G, Arroyo V. Ascites and renal functional abnormalities in cirrhosis. Pathogenesis and treatment. Baillieres Clin Gastroenterol. 1997;11(2):365–385. | |
Arroyo V, Rodés J, Gutiérrez-Lizárraga MA, Revert L. Prognostic value of spontaneous hyponatremia in cirrhosis with ascites. Am J Dig Dis. 1976;21(3):249–256. | |
Biggins SW, Kim WR, Terrault NA, et al. Evidence-based incorporation of serum sodium concentration into MELD. Gastroenterology. 2006;130(6):1652–1660. | |
Kim WR, Biggins SW, Kremers WK, et al. Hyponatremia and mortality among patients on the liver-transplant waiting list. N Engl J Med. 2008;359(10):1018–1026. | |
Samuel D. MELD-Na as a prognostic score for cirrhotic patients: Hyponatremia and ascites are back in the game. J Hepatol. 2009;50(4):836–838. | |
Ruf AE, Kremers WK, Chavez LL, Descalzi VI, Podesta LG, Villamil FG. Addition of serum sodium into the MELD score predicts waiting list mortality better than MELD alone. Liver Transpl. 2005;11(3):336–343. | |
Schlichting P, Christensen E, Andersen PK, et al. Prognostic factors in cirrhosis identified by Cox’s regression model. Hepatology. 1983;3(6):889–895. | |
Ginés P, Quintero E, Arroyo V, et al. Compensated cirrhosis: natural history and prognostic factors. Hepatology. 1987;7(1):122–128. | |
D’Amico G, Garcia-Tsao G, Pagliaro L. Natural history and prognostic indicators of survival in cirrhosis: a systematic review of 118 studies. J Hepatol. 2006;44(1):217–231. | |
Wang VS, Saab S. Liver transplantation in the era of model for end-stage liver disease. Liver Int. 2004;24(1):1–8. | |
Rincón D, Lo Iacono O, Tejedor M, et al. Prognostic value of hepatic venous pressure gradient in patients with compensated chronic hepatitis C-related cirrhosis. Scand J Gastroenterol. 2013;48(4):487–495. | |
Huo TI, Wang YW, Yang YY, et al Model for end-stage liver disease score to serum sodium ratio index as a prognostic predictor and its correlation with portal pressure in patients with liver cirrhosis. Liver Int. 2007;27(4):498–506. | |
Barber K, Madden S, Allen J, Collett D, Neuberger J, Gimson A; United Kingdom Liver Transplant Selection and Allocation Working Party. Elective liver transplant list mortality: development of a United Kingdom end-stage liver disease score. Transplantation. 2011;92(4):469–476. | |
Iwakiri Y, Groszmann RJ. The hyperdynamic circulation of chronic liver diseases: from the patient to the molecule. Hepatology. 2006; 43(2 Suppl 1):S121–S131. | |
Asbert M, Ginès A, Ginès P, et al. Circulating levels of endothelin in cirrhosis. Gastroenterology. 1993;104(5):1485–1491. | |
Arroyo V, Bosch J, Gaya-Beltrán J, et al. Plasma renin activity and urinary sodium excretion as prognostic indicators in nonazotemic cirrhosis with ascites. Ann Intern Med. 1981;94(2):198–201. | |
Wiest R, Shah V, Sessa WC, Groszmann RJ. NO overproduction by eNOS precedes hyperdynamic splanchnic circulation in portal hypertensive rats. Am J Physiol. 1999;276(4 Pt 1):G1043–G1051. | |
Vallance P, Moncada S. Hyperdynamic circulation in cirrhosis: a role for nitric oxide? Lancet. 1991;337(8744):776–778. | |
Guarner C, Soriano G, Tomas A, et al. Increased serum nitrite and nitrate levels in patients with cirrhosis: relationship to endotoxemia. Hepatology. 1993;18(5):1139–1143. | |
Tarantino G, Citro V, Conca P, et al. What are the implications of the spontaneous spleno-renal shunts in liver cirrhosis? BMC Gastroenterol. 2009;9:89. | |
Tarantino G, Citro V, Esposito P, et al. Blood ammonia levels in liver cirrhosis: a clue for the presence of portosystemic collateral veins. BMC Gastroenterol. 2009;9:21. | |
De las Heras D, Fernández J, Ginès P, et al. Increased carbon monoxide production in patients with cirrhosis with and without spontaneous bacterial peritonitis. Hepatology. 2003;38(2):452–459. | |
Guarner C, Soriano G, Such J, et al. Systemic prostacyclin in cirrhotic patients. Relationship with portal hypertension and changes after intestinal decontamination. Gastroenterology. 1992;102(1):303–309. | |
Ebrahimkhani MR, Mani AR, Moore K. Hydrogen sulphide and the hyperdynamic circulation in cirrhosis: a hypothesis. Gut. 2005;54(12):1668–1671. | |
Oh JK. Echocardiography as a noninvasive Swan-Ganz catheter. Circulation. 2005;111(24):3192–3294. |
 © 2014 The Author(s). This work is published and licensed by Dove Medical Press Limited. The
full terms of this license are available at https://www.dovepress.com/terms
and incorporate the Creative Commons Attribution
- Non Commercial (unported, 3.0) License.
By accessing the work you hereby accept the Terms. Non-commercial uses of the work are permitted
without any further permission from Dove Medical Press Limited, provided the work is properly
attributed. For permission for commercial use of this work, please see paragraphs 4.2 and 5 of our Terms.
© 2014 The Author(s). This work is published and licensed by Dove Medical Press Limited. The
full terms of this license are available at https://www.dovepress.com/terms
and incorporate the Creative Commons Attribution
- Non Commercial (unported, 3.0) License.
By accessing the work you hereby accept the Terms. Non-commercial uses of the work are permitted
without any further permission from Dove Medical Press Limited, provided the work is properly
attributed. For permission for commercial use of this work, please see paragraphs 4.2 and 5 of our Terms.