Back to Journals » International Journal of Nanomedicine » Volume 11
Systemic distribution of single-walled carbon nanotubes in a novel model: alteration of biochemical parameters, metabolic functions, liver accumulation, and inflammation in vivo
Authors Principi E, Girardello R, Bruno A, Manni I, Gini E, Pagani A, Grimaldi A, Ivaldi F, Congiu T, De Stefano D, Piaggio G, de Eguileor M, Noonan DM, Albini A
Received 6 April 2016
Accepted for publication 24 May 2016
Published 1 September 2016 Volume 2016:11 Pages 4299—4316
DOI https://doi.org/10.2147/IJN.S109950
Checked for plagiarism Yes
Review by Single anonymous peer review
Peer reviewer comments 2
Editor who approved publication: Dr Thomas Webster
Video presented by Adriana Albini and Elisa Principi
Views: 436
Elisa Principi,1,* Rossana Girardello,2,* Antonino Bruno,1,* Isabella Manni,3 Elisabetta Gini,2 Arianna Pagani,1 Annalisa Grimaldi,2 Federico Ivaldi,4 Terenzio Congiu,5 Daniela De Stefano,1 Giulia Piaggio,3 Magda de Eguileor,2 Douglas M Noonan,1,2 Adriana Albini1
1Vascular Biology and Angiogenesis, Scientific and Technology Pole, IRCCS MultiMedica, Milano, 2Department of Biotechnology and Life Sciences, University of Insubria, Varese, 3Department of Research, Advanced Diagnosis and Innovation, Regina Elena National Cancer Institute, Rome, 4Department of Neuroscience, Ophthalmology and Genetics, University of Genoa, Genoa, 5Department of Surgical and Morphological Sciences, University of Insubria, Varese, Italy
*These authors contributed equally to this work
Abstract: The increasing use of carbon nanotubes (CNTs) in several industrial applications raises concerns on their potential toxicity due to factors such as tissue penetrance, small dimensions, and biopersistence. Using an in vivo model for CNT environmental exposure, mimicking CNT exposition at the workplace, we previously found that CNTs rapidly enter and disseminate in the organism, initially accumulating in the lungs and brain and later reaching the liver and kidneys via the bloodstream in CD1 mice. Here, we monitored and traced the accumulation of single-walled CNTs (SWCNTs), administered systemically in mice, in different organs and the subsequent biological responses. Using the novel in vivo model, MITO-Luc bioluminescence reporter mice, we found that SWCNTs induce systemic cell proliferation, indicating a dynamic response of cells of both bone marrow and the immune system. We then examined metabolic (water/food consumption and dejections), functional (serum enzymes), and morphological (organs and tissues) alterations in CD1 mice treated with SWCNTs, using metabolic cages, performing serum analyses, and applying histological, immunohistochemical, and ultrastructural (transmission electron microscopy) methods. We observed a transient accumulation of SWCNTs in the lungs, spleen, and kidneys of CD1 mice exposed to SWCNTs. A dose- and time-dependent accumulation was found in the liver, associated with increases in levels of aspartate aminotransferase, alanine aminotransferase and bilirubinemia, which are metabolic markers associated with liver damage. Our data suggest that hepatic accumulation of SWCNTs associated with liver damage results in an M1 macrophage-driven inflammation.
Keywords: single-walled carbon nanotubes, nanotoxicity, metabolism, hepatic function, inflammation, Kupffer cells, mouse models
Introduction
Given their unique chemical and physical properties, carbon nanotubes (CNTs) represent a class of nanoparticles widely used in several industrial settings. Single-walled CNTs (SWCNTs) are also of interest for their potential medical applications,1 including in vivo delivery2–4 of drugs,5 proteins, peptides,6–8 and nucleic acids8 for gene transfer9 or gene silencing.6 In oncology, experimental studies have been focused on SWCNTs as a new tool to target tumor cells10 for antineoplastic treatment of tumor angiogenesis and in vivo tumor imaging.11 The small diameter, the relatively long length, and the biopersistence of CNTs have been linked to the structure of asbestos, suggesting extensive concerns on potential pulmonary health hazards.12–17 CNT tissue accumulation, stability over long periods, final fate, and toxicological impact on health represent crucial issues to be considered when using these nanomaterials. Certain CNT-mediated cytotoxic effects have been recently reported; however, the availability of toxicological data in vivo on SWCNTs is still controversial.
Functionalized SWCNTs are better tolerated in murine models18–20 than pristine (unfunctionalized) SWCNTs, suggesting that great caution should be addressed on using unfunctionalized SWCNTs, especially for medical applications. Using a novel murine model mimicking CNT exposition at workplace, we previously demonstrated that environmental exposure to multiwalled CNTs results in entry into the organism and distribution via the blood stream.21 We also showed that SWCNT localization on endothelial cells in vitro induces endothelial stress.22
Here, we carried out a global, comparative analysis to determine the extent of systemic, bone marrow, and immune cell proliferation occurring during SWCNT (1.2 nm in diameter and 2–5 μm in length) exposition in a newly developed reporter mouse model, MITO-Luc,23 where the synthesis of the exogenous firefly luciferase is associated with cell proliferation.
We also examined biodistribution in CD1 mice, at acute and chronic doses, injected intravenously to recapitulate external entry with a precise dosage.
We observed a short-term accumulation of SWCNT aggregates in the lung, whereas SWCNT persisted in the liver, suggesting hepatic preferential nanoparticles. Hepatic SWCNT deposits were associated with a chronic inflammation, as demonstrated by M1 macrophage infiltration, and a metabolic dysfunction, as revealed by the alterations in serum aspartate aminotransferase (AST), alanine aminotransferase (ALT), and bilirubinemia levels. Our data show that the liver is the primary organ targeted in CD1 mice upon systemic delivery of SWCNTs, with induction of chronic inflammation affecting the metabolism.
Materials and methods
SWCNT characterization and preparation
SWCNTs were prepared as previously reported.22 The crude SWCNTs (diameter 1.2–1.5 nm and length 2–5 μm; Sigma-Aldrich Co., St Louis, MO, USA) were used to prepare a SWCNT suspension in Dulbecco’s Modified Eagle’s Medium (DMEM; Sigma-Aldrich Co.) supplemented with 10% (v/v) of CD1 serum as described by Goeman et al.23 Briefly, 10 mg of the crude SWCNT powder was dispersed in a microcentifuge tube containing 10 mL of DMEM/10% CD1 serum, vortexed for 1 minute, and probe-sonicated for 15 minutes at 0°C, using an HD 2070 Bandelin Sonopuls sonicator (VWR International, Milan, Italy) equipped with a 2 mm diameter probe tip. The suspension was centrifuged for 2 minutes at 16,000× g, and the upper 75% of the supernatant was recovered, placed in a clean tube, and centrifuged for 2 minutes at 16,000× g.24 Again, the upper 75% of the second supernatant was carefully recovered as the final SWCNT dispersion. The SWCNT concentration in the samples for the in vivo experiments was determined using a calibration curve, by means of FT-Raman measurements25 on samples of known concentration. The band intensity was calculated as the average over several spectra of the G-band peak integrated area from 1,573 cm−1 to 1,612 cm−1 and the concentration of unknown samples from the calibration curve. SWCNT crude powder and the SWCNT suspension in DMEM/10% CD1 serum were analyzed for their appearance by transmission electron microscopy (TEM), scanning electron microscopy (SEM), and energy dispersive X-ray spectroscopy (EDS) (as described in the Microscopy section).
Study design and animals
The procedures involving the animals and their care were conformed to the European directive 2010/63 EU, approved by the local animal experimentation ethics committees (Comitato Etico per la Sperimentazione Animale, Università degli Studi dell’Insubria and the Organismo Preposto al Benessere Animale of the Istituto Superiore di Sanità) and the Italian Ministry of Health (DM/2005-A 4/12/2005). In vivo studies employed two different murine models. Male and female MITO-Luc and CD1 mice aged 6–8 weeks, nine for each group, were housed in cages with steel wire tops and corn-cob beddings and maintained in a controlled atmosphere with 12/12 dark/light cycle, temperature of 22°C±3°C, and humidity of 50%–70%, with free access to food and fresh water. Mice were exposed to different doses (0.16 mg/kg, 1.6 mg/kg, and 6.4 mg/kg) of SWCNTs (Figure 1A) injected in the tail vein for acute (acute exposure, Figure 1B) or chronic (chronic exposure, Figure 1C) treatment; the latter consisted of injections once every 3 weeks for 9 weeks. Control animals were treated with 200 μL of DMEM supplemented with 10% (v/v) of CD1 serum (vehicle).
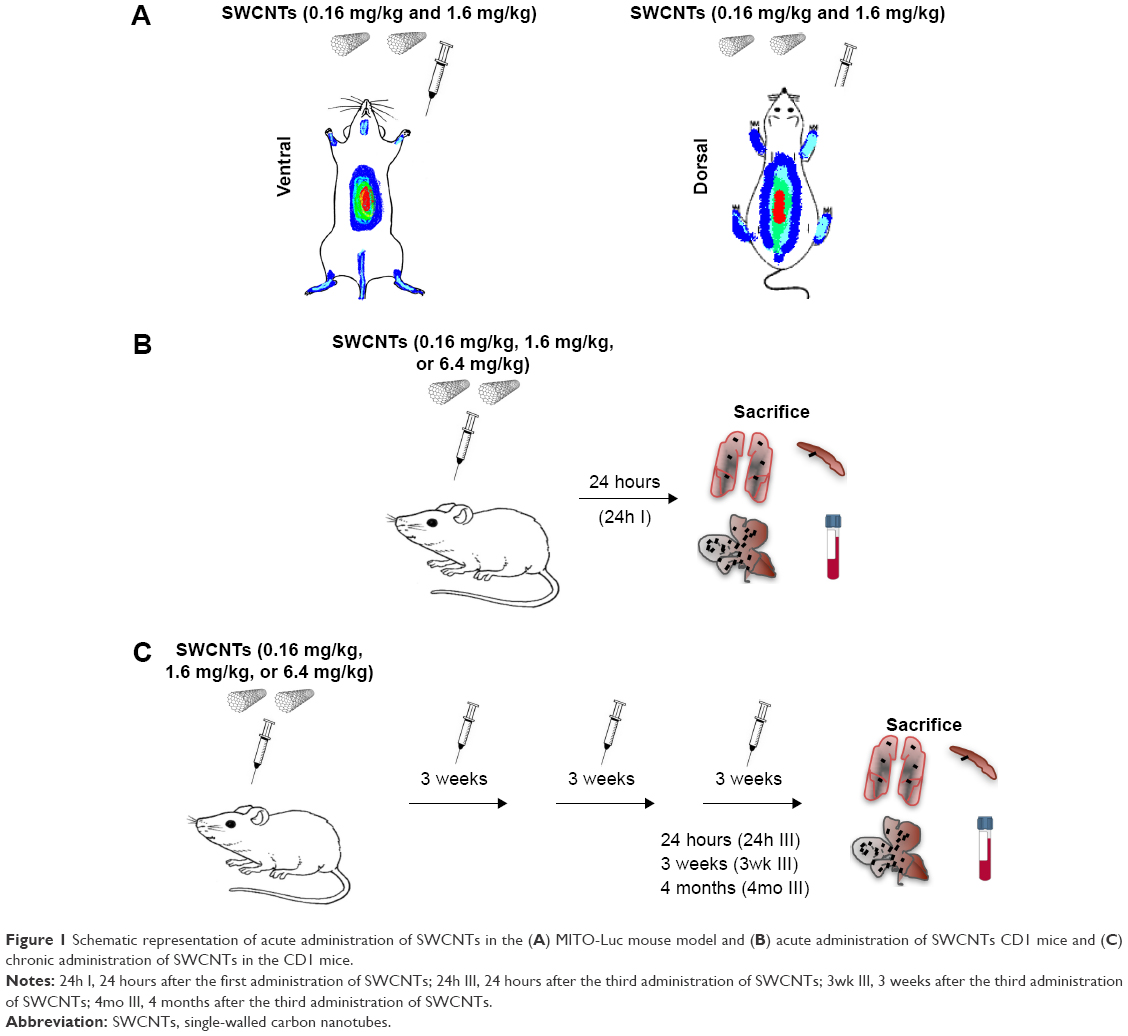 | Figure 1 Schematic representation of acute administration of SWCNTs in the (A) MITO-Luc mouse model and (B) acute administration of SWCNTs CD1 mice and (C) chronic administration of SWCNTs in the CD1 mice. |
In vivo studies
The MITO-Luc mouse was engineered for the ubiquitous, proliferation-regulated expression of luciferase in proliferating tissues by embedding the transgene containing the minimal promoter of Cyclin B2 driving the firefly luciferase gene within HS4 insulator sequences.23 MITO-Luc mice (C57BL/6 background) were exposed to SWCNTs injected into the tail vein once every week for 3 weeks. As a negative control, one group was treated with 200 μL of vehicle (DMEM; Sigma-Aldrich Co.) supplemented with 10% (v/v) of C57BL/6 serum as described by Goeman et al.23 For the in vivo bioluminescence imaging (BLI), four MITO-Luc mice per group were subjected to BLI 1 day after each SWCNT injection. The substrate luciferin (75 mg/kg; PerkinElmer Inc., Waltham, MA, USA) was intraperitoneally injected 10 minutes before BLI quantification. During the imaging sessions, mice were kept under anesthesia (Xilor-100/Zoletil, 2 mg/kg). Photon emission from different body areas was measured using a CCD camera (Xenogen IVIS Lumina System; Caliper Life Sciences, Hopkinton, MA, USA). These data were merged with a grayscale image taken with a dimmed light and quantified using the Living Image software (Caliper Life Sciences). Photon emission was measured in regions of interest manually selected by the aid of a specific grid. Data were expressed as photon per second per centimeter square per steradiant. The intensity of BLI was color coded for imaging purposes; the scale used in each experiment was reported in the figure.
The CD1 mice were sacrificed either 24 hours after the first injection (acute exposure, Figure 1B) or 24 hours, 3 weeks, or 4 months after the last injection (chronic exposure, Figure 1C). Organs were excised, collected, and processed for standard histology, immunocytochemistry, and SEM. Prior to sacrifice, cardiac blood samples were collected to produce sera for biochemical analyses.
Metabolic analysis
CD1 mice were housed in metabolic cages for 24 hours following each injection and every week between the first (I), the second (II), and the third (III) injection to monitor food and water consumption and to collect urine and fecal samples. The fecal water content was determined by weighting the collected feces before and after incubation in a thermostatic oven at 50°C for an hour.
Serum biochemical analysis
Cardiac blood samples were immediately collected from sacrificed animals. Following 60 minutes of clotting, the samples were centrifuged for 60 minutes at 7,500× g and then stored at −80°C until ready for analysis. Plasma tumor necrosis factor α (TNF-α) levels were determined by enzyme-linked immunosorbent assay (BD Biosciences, San Jose, California, USA). The absorbance was measured at 450 nm in a VersaMax Microplate Reader (Molecular Devices LLC, Sunnyvale, CA, USA), and the TNF-α concentration in experimental samples was calculated from a standard curve. AST, ALT, azotemia, alkaline phosphatase, creatinine, and total bilirubin dosages were performed using Kuadro BPC BioSed clinical automatic chemistry analyzer (BPC BioSed, Rome, Italy).
Microscopy
For standard histology, lungs, spleen, and liver were excised, washed with phosphate-buffered saline with 20 mM EDTA to remove residual blood, dead cells, and debris, and immediately fixed in 4% formalin and embedded in paraffin. Sections of 7 μm thickness were stained with hematoxylin and eosin for histological examination and observed under an Olympus BH2 microscope (Olympus Corporation, Tokyo, Japan). Data were recorded using a DS-5M-L1 digital camera system (Nikon Corporation, Tokyo, Japan). For immunofluorescence, 7 μm cryosections from tissue samples, embedded in PolyFreeze Tissue Freezing Medium (Polysciences, Inc., Warrington, PA, USA) and immediately frozen in liquid nitrogen, were obtained using a Leica CM1850 cryotome. The presence of CD45, a common leukocyte marker, and CD68, specific for macrophage and Kupffer cells, was assessed on selected cryosections using the following primary antibodies: antimouse CD45 antibody (1:50 dilution; Sigma-Aldrich Co.) and antimouse CD68 antibody (1:50 dilution; Sigma-Aldrich Co.). Incubations with suitable secondary antibodies conjugated with tetramethylrhodamine (1:200 dilution, Jackson ImmunoResearch Laboratories, Inc., West Grove, PA, USA) were performed for 1 hour in a dark moist chamber. Double staining for macrophage identification was performed using mAbs against CD45 and CD68 surface antigens. Sections were first stained with antimouse CD45, and following washing, the secondary fluorescein isothiocyanate-conjugated goat antirabbit antibody was added. Rinsed samples were incubated with anti-CD68 antibody and subsequently with tetramethylrhodamine-conjugated goat antirabbit secondary antibody, as previously reported.26 In control samples, primary antibodies were omitted, and samples were treated with phosphate-buffered saline containing 2% bovine serum albumin. Coverslips were mounted in VECTASHIELD medium for fluorescence (Vector Laboratories, Burlingame, CA, USA), and slides were observed under an Olympus BH2 microscope. Data were recorded using a DS-5M-L1 digital camera system. For electron and light microscopies, liver samples were fixed for 2 hours in 0.1 M cacodylate buffer, pH 7.2, containing 2% glutaraldehyde, and then postfixed for 2 hours with 1% osmic acid in cacodylate buffer, pH 7.2. Following standard serial ethanol dehydration, specimens were embedded in an Epon-Araldite 812 mixture. Semithin sections, obtained using a Reichert Ultracut S ultratome (Leica Microsystems, Wetzlar, Germany), were stained by the Feulgen staining according to Girardello et al27 and observed under a light microscope (Olympus Corporation). Data were recorded using a DS-5M-L1 digital camera system. Thin sections were obtained, and TEM was performed as previously described.22 All histological data were measured by double-blind scoring.
Isolation of SWCNTs from tissue samples
We isolated SWCNTs from excised tissues as described in Albini et al21 and Girardello et al.27 Livers from mice 3 weeks after the third SWCNT injection were excised, digested in 5 N KOH (Sigma-Aldrich Co.) for 2 hours at room temperature, washed, suspended in 100 μL of distilled water to avoid potassium salt formation, and dried on a copper grid (formvar carbon film) for TEM analysis (JEM-1010; JEOL, Tokyo, Japan). Images were acquired using a Morada digital camera (Olympus Corporation).21 For SEM analysis, samples were dried on a cover glass, sputter-coated with a thin layer of gold in an Emitech 500 instrument and were observed in a backscatterd electron mode, with an SEM (Philips XL30 FEG; FEI, Eindhoven, the Netherlands).21 To confirm that the KOH or sonication treatment does not affect SWCNT structure, the crude powder was treated using the same procedure as for tissue samples, resuspended in distilled water or in DMEM supplemented with CD1 serum, sonicated, and observed under the TEM, SEM, and EDS. To enhance CNT signals, the cover glasses were sputter-coated with a thin layer of gold and observed in backscattered electron mode with an SEM coupled with an energy dispersive X-ray analyzer (EDAX Genesis 2000; EDAX, Mahwah, NJ, USA). Photographic maps of element distribution obtained on the image frames were processed by Image Analysis (Soft-Image Software; EDAX). These maps were superimposed to each source image with Adobe Photoshop (Adobe Systems Incorporated, San Jose, CA, USA).
SWCNT aggregate quantification
SWCNT aggregates were counted in ten sections of lung, liver, kidney, and spleen (data not shown) after hematoxylin and eosin or Feulgen staining of CD1-treated mice, 24 hours after the first injection and 24 hours and 3 weeks after the last injection. Each count represents the mean value of five different double-blinded fields. Previous studies have shown that the aggregate counts in tissues correlate with Raman analysis.21,28
Macrophage isolation and real-time PCR
We investigated the possible association between SWCNT exposition and the induction of an M1 or M2 macrophage polarization state.29 Liver macrophages 24 hours after the first and 3 weeks after the third SWCNTs’ injection (6.4 mg/kg) were isolated by mechanical dispersion followed by CD11b immunomagnetic cell selection using a commercially available kit (Miltenyi Biotech, Bergisch Gladbach, Germany). Cell purity was assessed by flow cytometry as previously described. Samples with purity >85% were used for RNA extraction using the RNeasy Plus Mini Kit (Qiagen NV, Venlo, the Netherlands). cDNA synthesis was performed using the Quantitect Reverse Transcription Kit (Qiagen NV). Real-time PCR for interleukin (IL)-12, IL-23, IL-10, iNOS, TNF-α, CXCL10, CCCL22, and MMP-9 was done on the cDNA samples using FastStart SYBR Green Master Kit (Hoffman-La Roche Ltd., Basel, Switzerland) and detected in a Mastercycler RealPlex2 (Eppendorf, Hamburg, Germany). Relative expression values were obtained using Eppendorf software and normalized on the GAPDH housekeeping gene.
Statistical analysis
All experiments were performed in triplicate. Data were analyzed using GraphPad Prism5 software (GraphPad Software, Inc., La Jolla, CA, USA). Statistical analyses for multiple comparisons were tested by one-way and two-way analyses of variance followed by Bonferroni’s multiple comparison test (http://www.graphpad.com/guides/prism/6/statistics/index.htm?stat_the_bonferroni_method.htm).30,31
Results
Systemic effects of SWCNTs on bone marrow proliferation in MITO-Luc mice
We used a recently developed mouse model, MITO-Luc (repTOP™mitoIRE),23 that has a reporter gene under the control of a NF-Y-dependent cyclin B2 promoter, which allows the determination of physiological and/or aberrant cell proliferation in any tissue of the body, by BLI. This model is suitable to characterize the effects of selected compounds on immune cell proliferation in time course experiments.23 We challenged this model with injections of SWCNTs (0.16 mg/kg and 1.6 mg/kg). We observed an induction of light (representing cell proliferation) in the mouse whole body after 24 hours (Figure 2A), which was significant for the 0.16 mg/kg dose (Figure 2B). In particular, the light is induced in body districts containing active bone marrow and immune organs, such as sternum, femurs, vertebral column, and the spleen (Figure 2C). We then evaluated time-dependent effects of SWCNT administration. Starting from 24 hours after the third injection to 11 days after the third injection, the luminescence returned to basal levels (Figure 2A and B). These results demonstrate that SWCNTs induce systemic cell proliferation and indicate a dynamic response of both bone marrow and the immune system. Moreover, this result likely indicates that SWCNT injection induces cell proliferation and mobilization within the bone marrow.
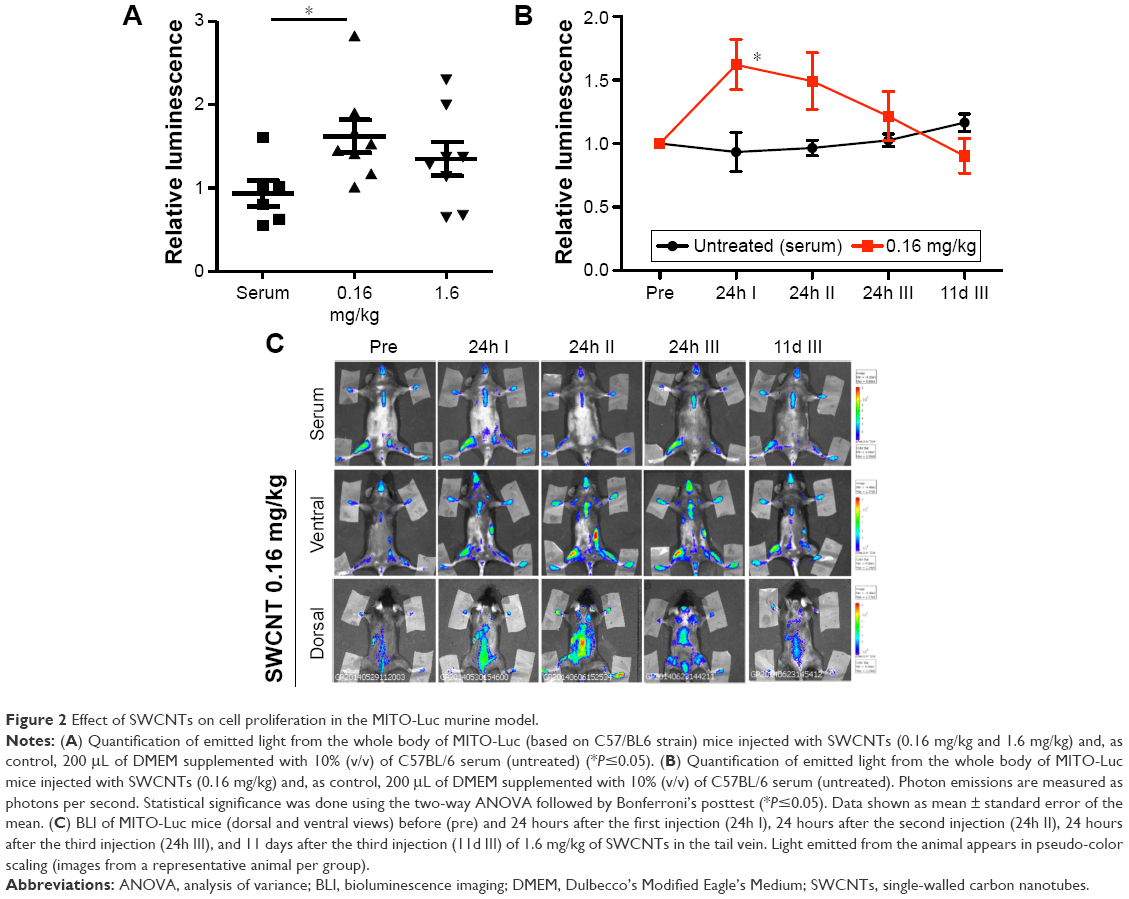 | Figure 2 Effect of SWCNTs on cell proliferation in the MITO-Luc murine model. |
Effects of SWCNT injection on metabolic and functional parameters in CD1 mice
Given the observed systemic stimulation of cell proliferation in the animal body and the bone marrow of treated MITO-Luc mice, we investigated the effects on metabolic functions in CD1 mice exposed to acute and chronic doses of SWCNTs by intravenous injections using metabolic cages, monitoring food and water consumption, as well as urine and fecal elimination.
Following the first administration of SWCNTs, we observed increased water (Figure S1A) and food consumption (Figure S1B), associated with higher feces (Figure S1C) production and fecal water percentage (Figure S1D). Urine production was not affected (Figure S1E). Similar effects were found for all SWCNT doses employed, and most parameters returned to near baseline 3 weeks from the last administration, in particular for the highest dose.
Mice treated with the highest dose of SWCNTs, monitored 3 months after the last injection, showed symptoms related to cholestasis (an interruption in the excretion of bile), including the presence of skin xanthomas and alopecia (Figure 3A). Examination of selected serum parameters associated with renal and hepatic function (Figure 3B) showed no differences in creatinine levels (Figure 3Ba) but a trend toward decreased azotemia (Figure 3Bb) and no changes in serum alkaline phosphatase (Figure 3Bc) in animals exposed to chronic doses of SWCNTs. Significant amounts of AST (Figure 3Bd) and ALT (Figure 3Be), particularly at the highest dose, were observed. While ALT levels returned to baseline after 3 weeks (Figure 3Be), a trend toward increased levels of AST (Figure 3Bd) was detected even after 3 weeks for all doses administered. We found significantly elevated production of total bilirubin in CD1 mice treated with the highest dose of SWCNTs at 4 months after the last injection (Figure 3Bf). We found that the altered serum enzyme profile correlates with significantly increased serum levels of TNF-α at the highest dose of SWCNTs 3 weeks and even 4 months after the last injection (Figure 3Bg). These data suggest that systemic introduction of SWCNTs induces a chronic hepatic damage in CD1 mice.
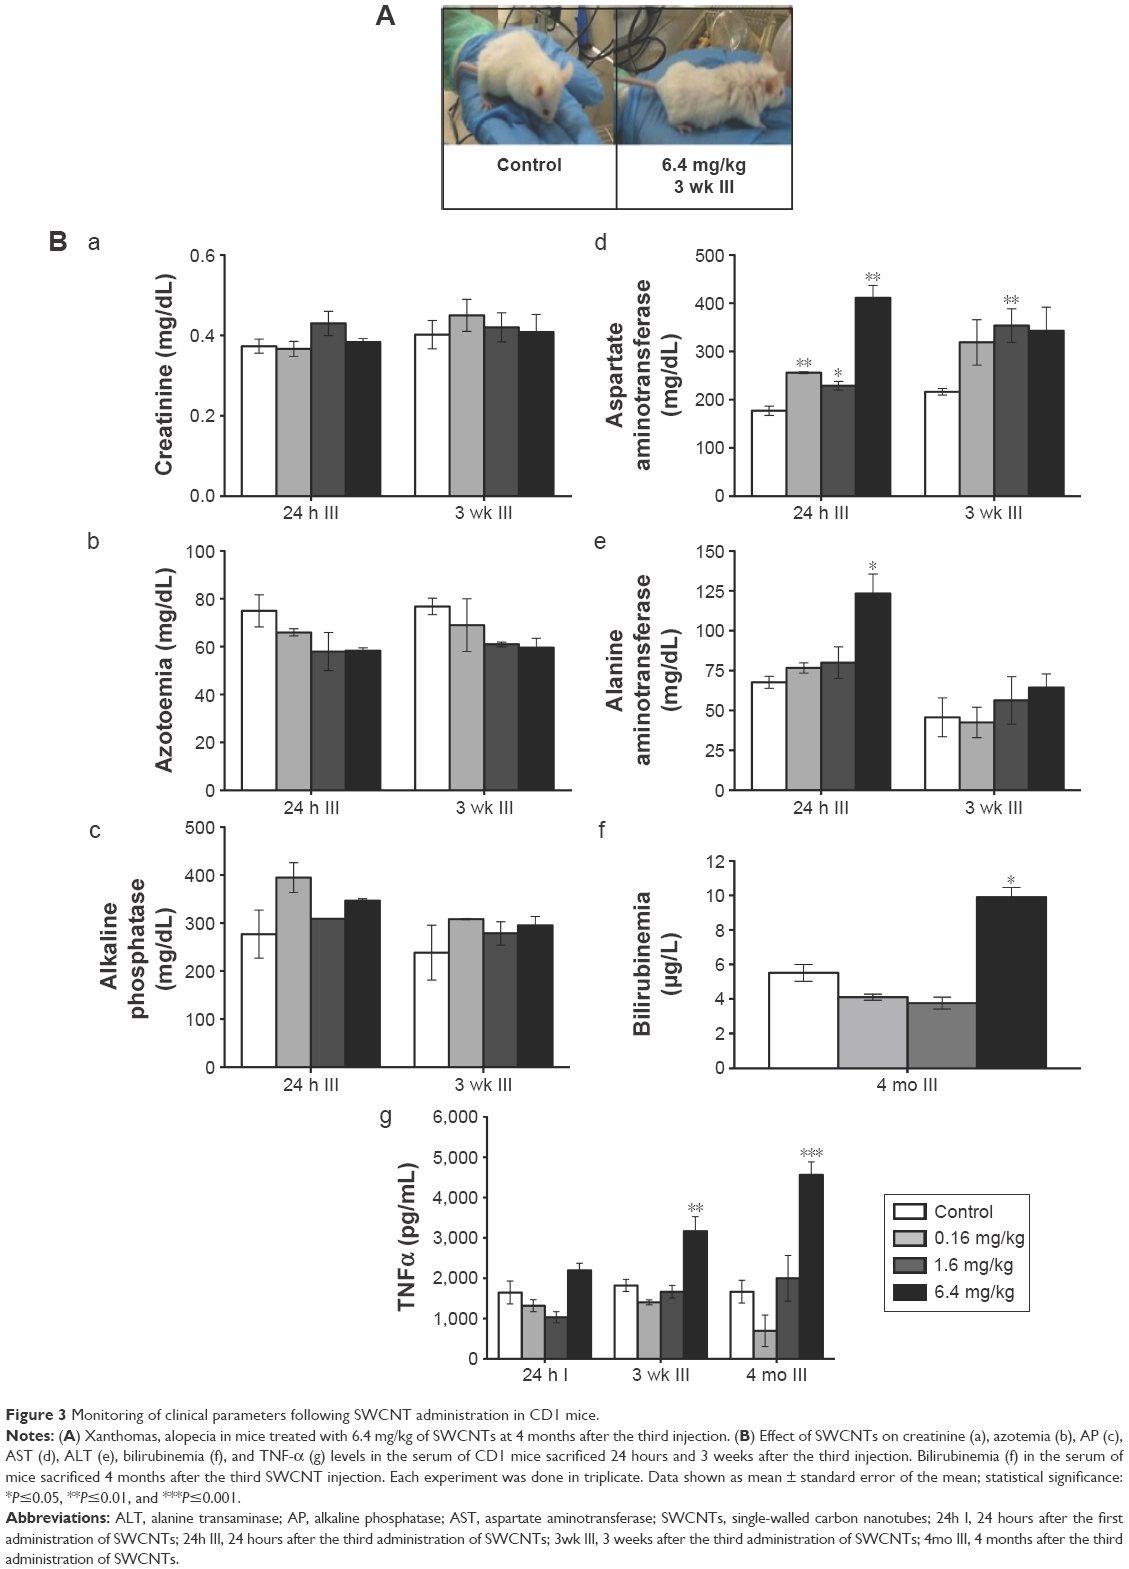 | Figure 3 Monitoring of clinical parameters following SWCNT administration in CD1 mice. |
Effects of SWCNTs on selected tissues
Lungs, spleens, kidneys, and livers were examined in CD1 animals administered with SWCNT suspensions (Figure 1B and C) and compared with vehicle alone-treated control mice. At the highest dose, no macroscopic alterations were observed in kidney, lung, and spleen (data not shown). No differences in the weight of mice or organs of treated and untreated mice were detected (data not shown). Histopathological analysis indicated no morphological lung tissue alterations in control CD1 mice, while in those exposed to SWCNTs, scattered accumulations of brown amorphous material were detected in the examined tissues (Figure 4A and B) representing CNT aggregates.21,28 Lungs and livers were the major sites of accumulation (Figure 4), with fewer particles in the spleen and in the kidneys (data not shown). We counted (double-blind) the SWCNT aggregate number as an indicator of tissue burden, showing that SWCNTs in the lungs accumulate only at the highest dose and are transiently being cleared 3 weeks after treatment (Figure 4B).
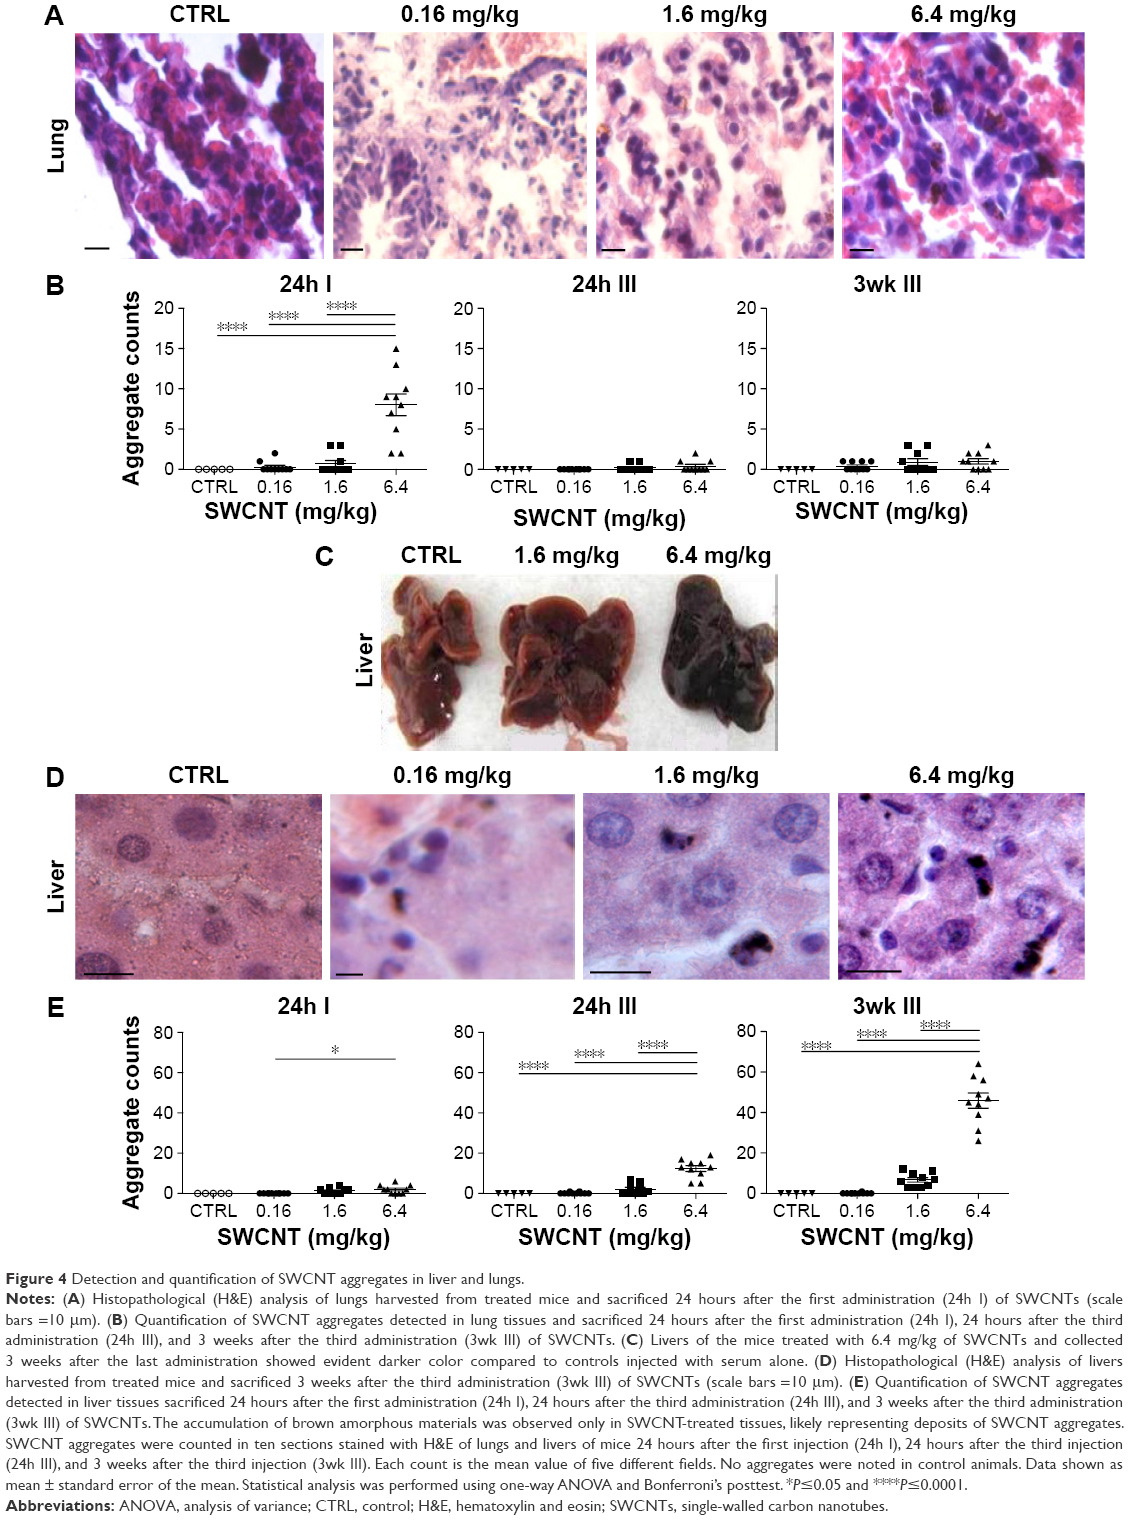 | Figure 4 Detection and quantification of SWCNT aggregates in liver and lungs. |
SWCNTs preferentially accumulate and persist in the liver
We found that the livers of SWCNT-exposed animals showed a darker color (Figure 4C). SWCNT aggregates persist in the liver of CD1-treated mice, being detectable already at 24 hours from the third injection and reaching the highest aggregate accumulation 3 weeks later without further administration (Figure 4D and E). These data clearly suggest that the liver was the major site of SWCNT accumulation, as confirmed by the Feulgen reaction (Figure 5A). This staining is normally used to highlight the nuclei; the light green staining was useful to better visualize the black SWCNT aggregates. In the liver, SWCNT aggregates were distributed ubiquitously both in the cytoplasmic and extracellular compartments (Figure 5Ad–n). Optical microscopy at higher magnification showed that the SWCNTs were mainly localized close to Kupffer cells (Figure 5Am and n), suggesting a direct involvement of these macrophages in SWCNT internalization by phagocytosis. Quantification of the SWCNT aggregates after Feulgen staining (Figure 5B) confirmed the time- and dose-dependent accumulation in the liver tissues of the mice exposed to SWCNTs (Figure 4C). No aggregates were found in control animals. The presence of SWCNTs in tissues was confirmed by taking advantage of the chemical resistance of SWCNTs as previously described.21 TEM (Figure 6A) and SEM (Figure 6B) analyses of livers from SWCNT-injected and control groups, following 5 N KOH digestion, showed the presence of chemically resistant material with characteristics of nanotube aggregates. These aggregates morphologically share the same features of those obtained from the stock SWCNTs with or without KOH treatment (Figure 6A and Ba–c) and from SWCNTs suspended in DMEM/10% CD1 serum and sonicated (Figure 6Ad). No KOH-resistant materials were found in tissues from control mice (data not shown). EDS distribution clearly confirmed the presence of carbon (the principal SWCNT component) in the KOH-resistant material that overlaps with SWCNT bundles in SEM photos (Figure 6Ca). SEM of SWCNTs suspended in DMEM/10% CD1 serum and sonicated showed extensive crystal formation by the vehicle. Microanalytical EDS analysis confirmed the presence of SWCNT carbon (Figure 6Cb), along with other elements present in the medium used for SWCNTs’ preparation vehicle (such as Cl− and Na+) (Figure 6Cc) used for injection.
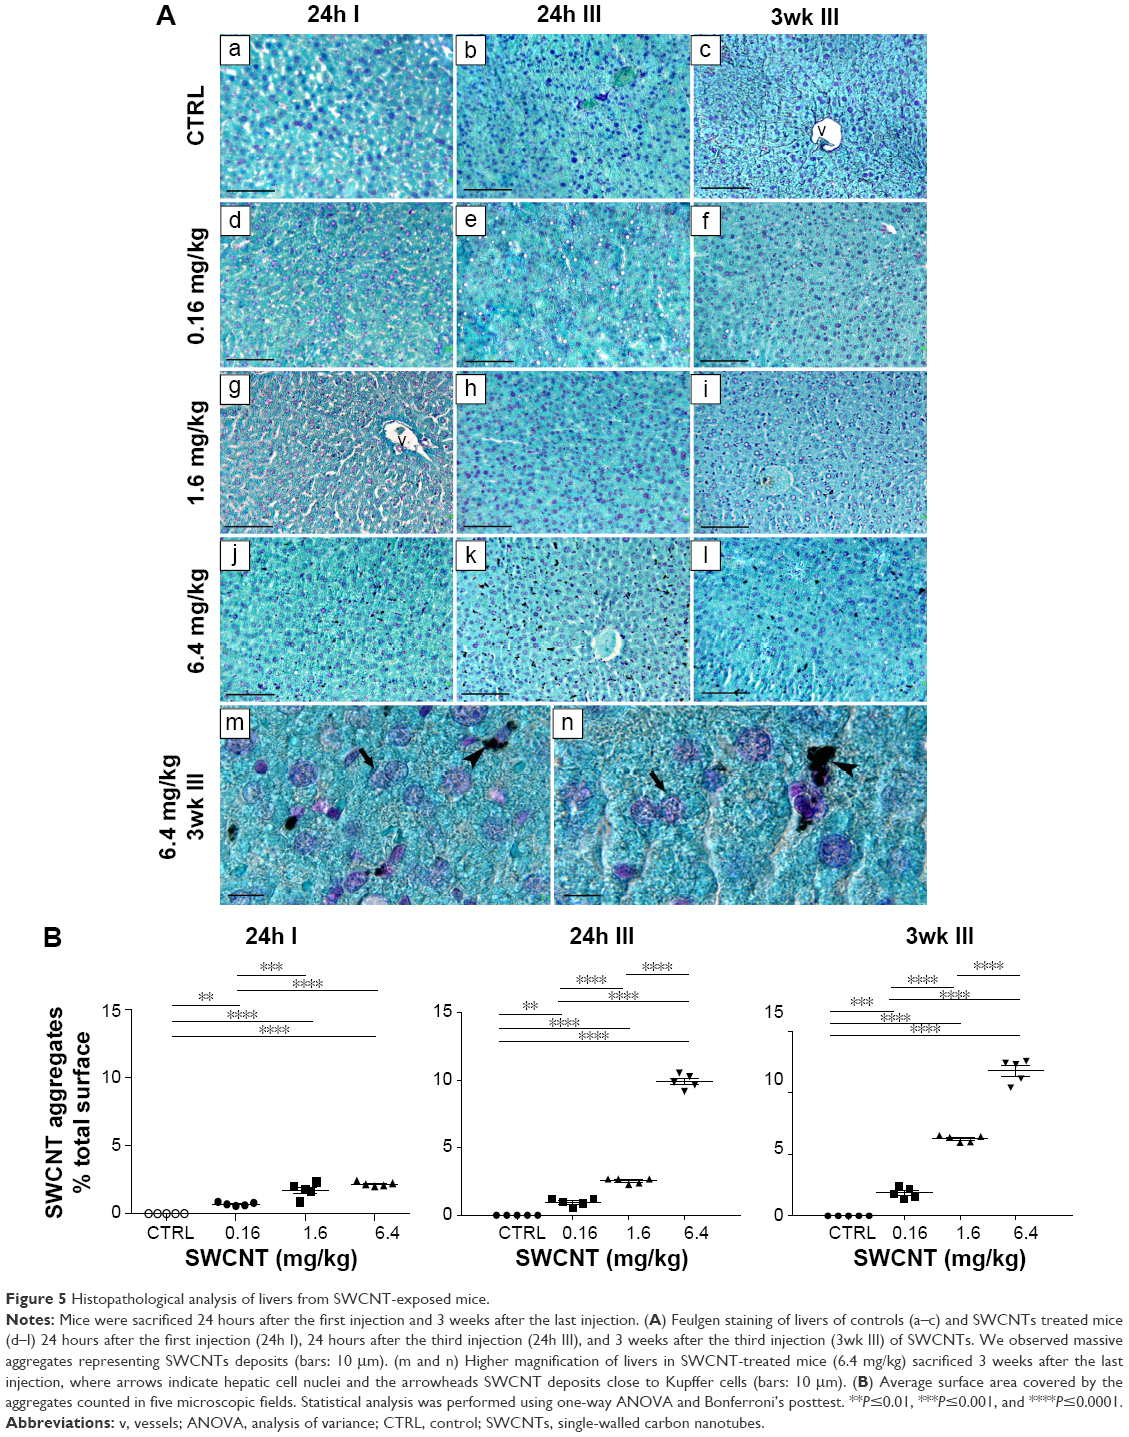 | Figure 5 Histopathological analysis of livers from SWCNT-exposed mice. |
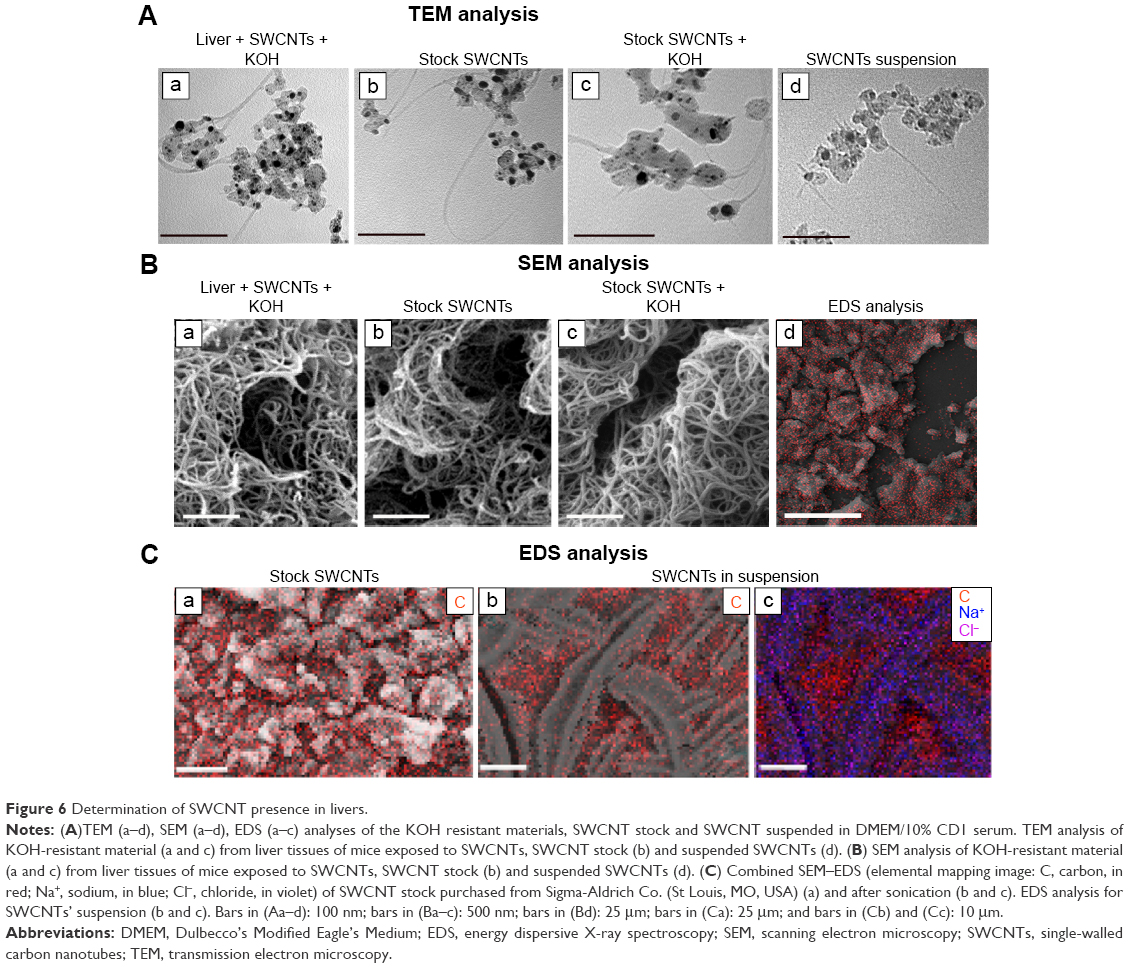 | Figure 6 Determination of SWCNT presence in livers. |
SWCNTs induce a hepatic inflammatory state
As the liver was the major organ where SWCNT accumulation occurred, we examined whether this accumulation was associated with the induction of a local immune response. Sections of livers of both control and injected mice were immunostained with anti-CD45 antibody, a pan-leukocyte marker. CD45+ cells (Figure 7Aa–l) were mainly localized inside vessels or surrounding the hepatic sinusoids. A clear increase in CD45+ cells in injected animals (Figure 7Ad–l) was observed. Quantification of the CD45+ cells indicated that the increase was directly proportional to the dose of SWCNTs and number of injections and was statistically significant (Figure 7B).
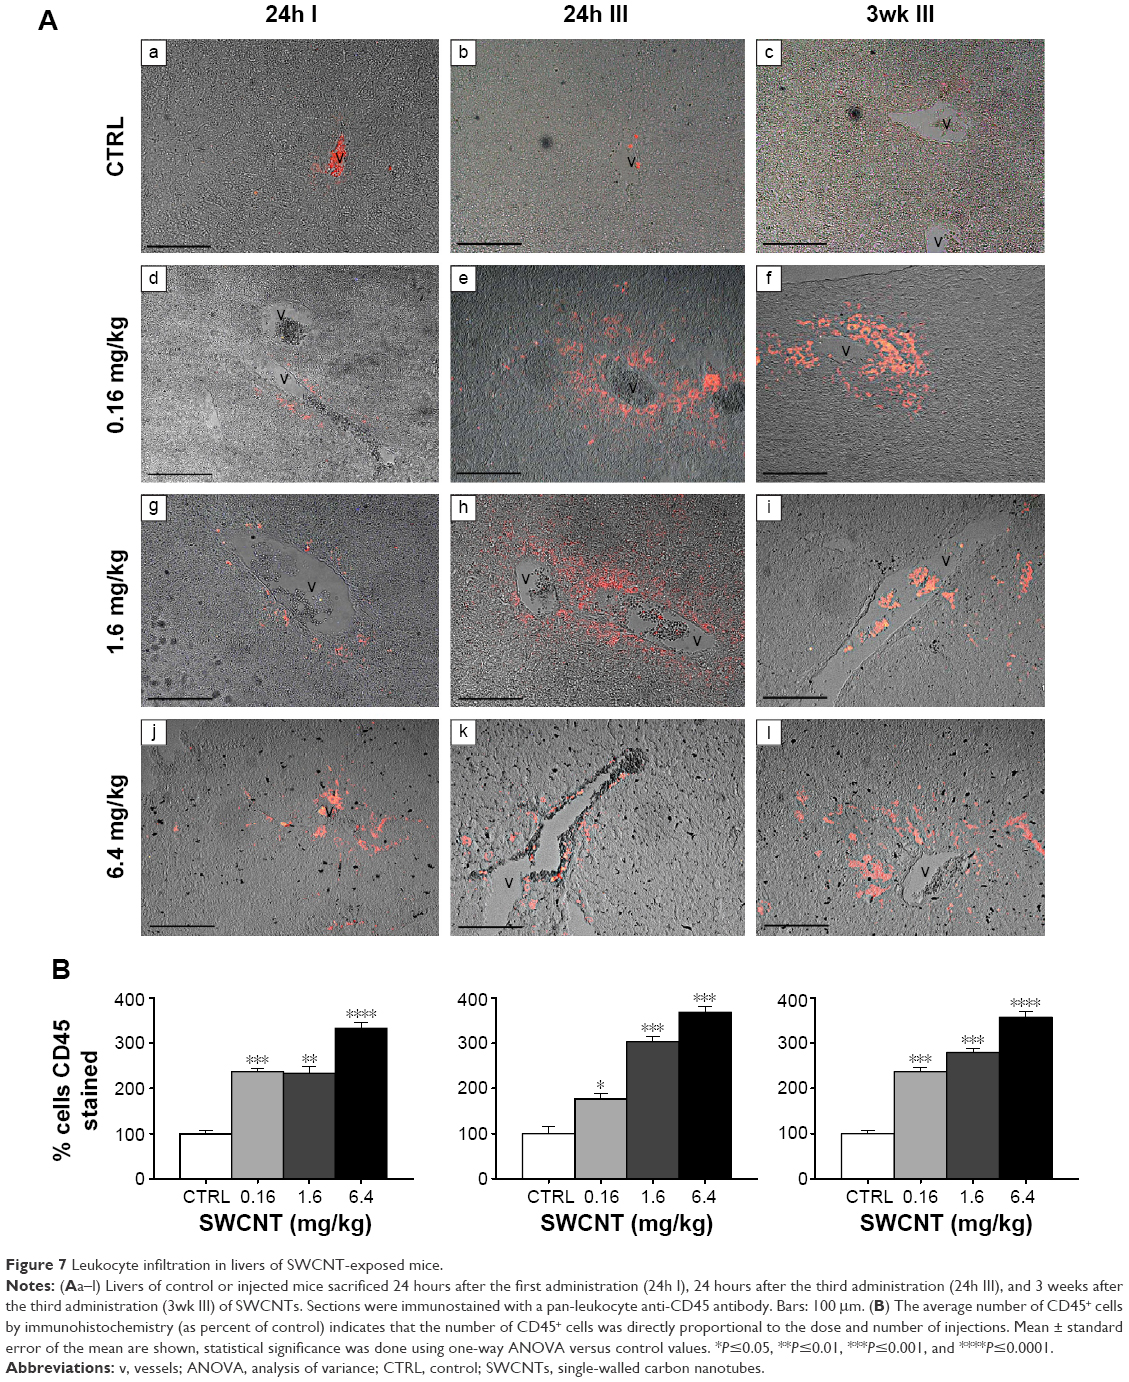 | Figure 7 Leukocyte infiltration in livers of SWCNT-exposed mice. |
Effect of SWCNTs on macrophage distribution and polarization in the liver
Given the inflammatory state found in SWCNT-administered animals, we further investigated which immune cell population was involved in this process. We observed that the number of Kupffer cells dramatically increased in the livers of SWCNT-injected mice as shown in Figure 5Ad–n. We then examined the expression of a marker for macrophage/Kupffer cells, CD68 (Figure 8Aa–l), showing their localization mainly inside vessels or surrounding the hepatic sinusoids. The number of CD68+ cells was significantly elevated and dose dependently increased with the number of SWCNT injections (Figure 8Aj–l and B). Dual immune labeling confirmed that macrophages/Kupffer cells were positive to both CD68 and CD45 antibodies (Figure 8Ca–c).
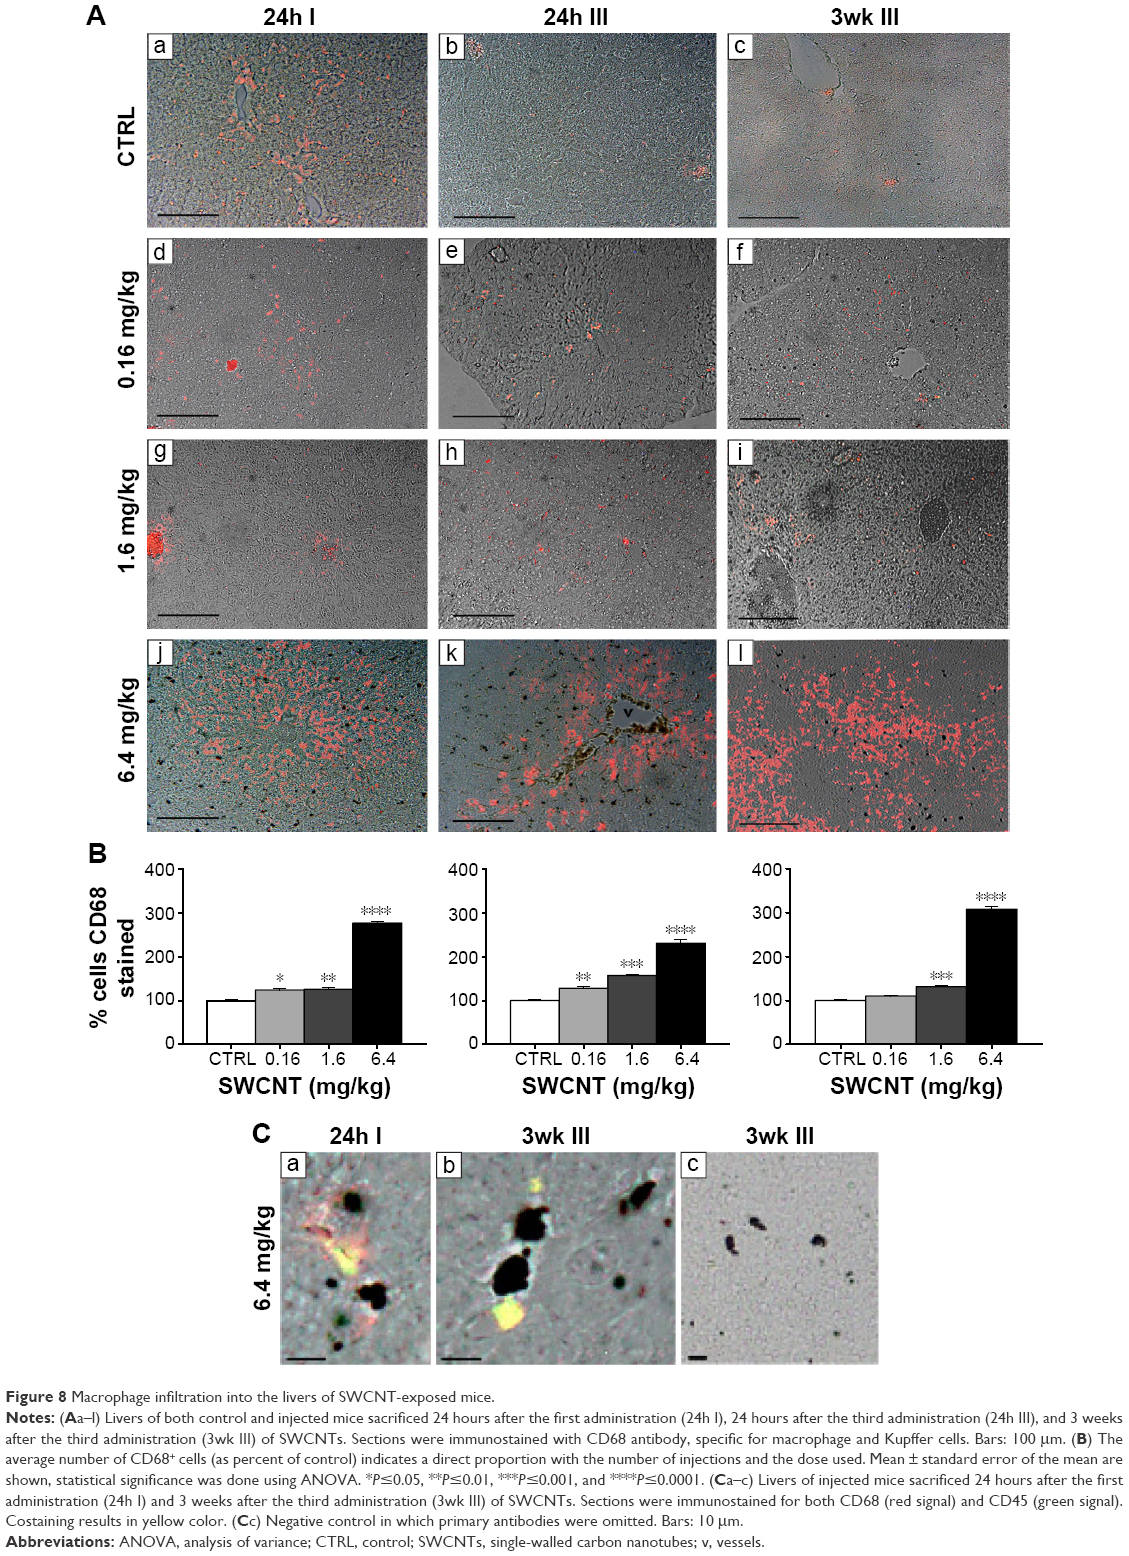 | Figure 8 Macrophage infiltration into the livers of SWCNT-exposed mice. |
Taken together, these data suggest that an increase in macrophage infiltration in the liver could produce a chronic inflammatory state. We therefore examined the macrophage polarization state based on the expression of mRNAs encoding proteins associated with either M1 or M2 polarization (Figure 9). Twenty-four hours following the first injection, there was a significant increase in the expression of IL-23 mRNA (Figure 9B). At 3 weeks from the third injection, liver macrophage production of IL-12 and TNF-α was significantly elevated (Figure 9B), suggesting a chronic inflammatory state associated with an M1-type polarization.
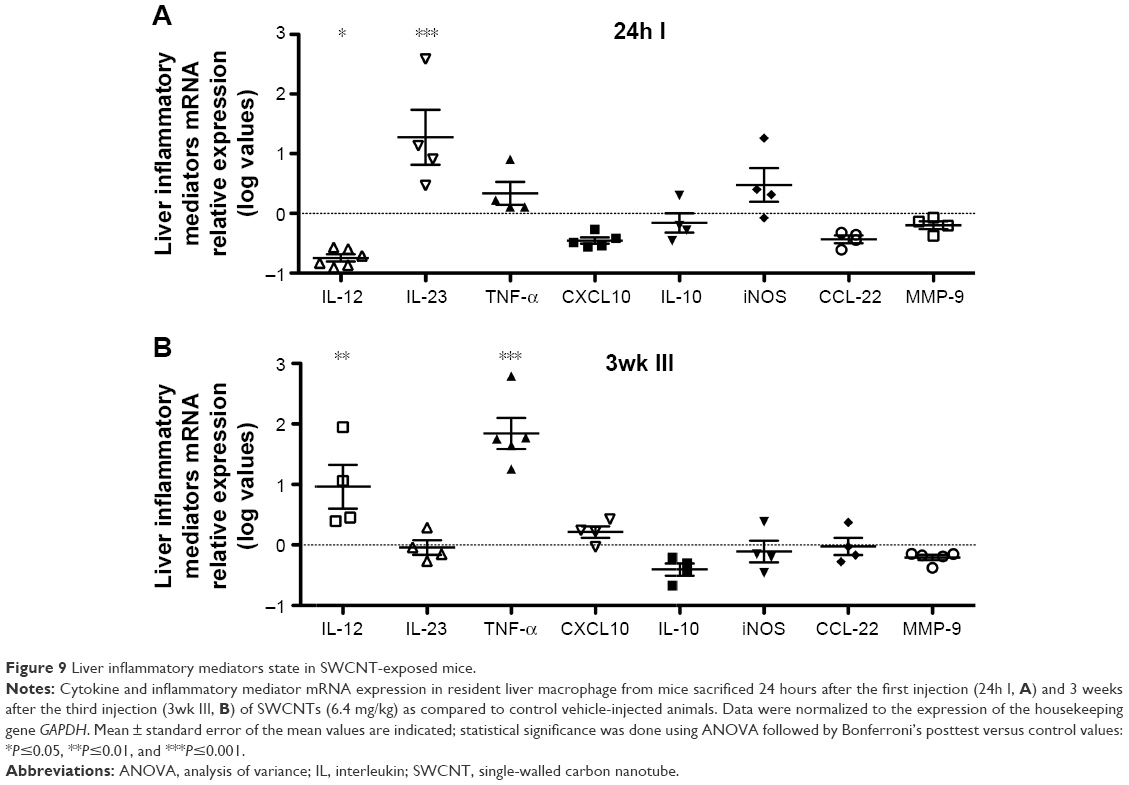 | Figure 9 Liver inflammatory mediators state in SWCNT-exposed mice. |
Discussion
The increasing use of carbon nanotubes (CNTs) in several industrial settings, as a consequence of their chemical and physical properties, leads to an urgent need to identify potential human health risks following particle exposition.12,32–34 SWCNTs can be used in sensors, electronic devices, wastewater treatment, and many other applications. Exposure to SWCNTs could also be due to the use of CNTs in biomedical applications, such as drug delivery systems and cancer treatment.35–37
Pharmacokinetics for small molecules is driven by physiological processes, in particular diffusion, active transport, and enzymatic metabolism. These processes are significantly more complex when related to nanoparticles.19 We have previously shown that in mice exposed to multiwalled CNTs, mimicking an exposure route similar to that occurring in case of a manufacturer process, CNTs rapidly enter and disseminate in the organism, initially accumulating in lungs and brain and later reaching the liver and kidney via the bloodstream in CD1 mice.21 Pristine SWCNTs have been proven to be cytotoxic, inducing oxidative damage, inflammation, and apoptosis. Several in vivo studies show that CNTs can induce inflammation, mostly in the context of lung damage, associated with the activation of the NLRP3 inflammasome.28,38–43 Furthermore, unfunctionalized SWCNTs show long-term accumulation in the liver.28,44 There are controversial reports relative to distribution and potential toxicity of SWCNTs; however, studies suggesting non-toxicity mostly consider functionalized particles. Functionalized CNTs can be degraded by peroxidases, in particular myeloperoxidase and eosinophil peroxidases.39,45 The unmodified pristine CNTs, used here, appear to be quite resistant to this degradation.39,45 It must be emphasized that unfunctionalized CNTs are, in fact, highly hydrophobic and not easily biodegradable, a key determinant for the induction and severity of the inflammatory responses.40
To assess potential undetected toxicities,46 we chose the direct intravenous route of injection of SWCNTs suspended in mice serum and monitored the route of administration for biodistribution, tracing, and evaluation of subsequent biological effects. Two murine models, the proliferation reporter MITO-Luc mice and standard CD1 mice, were used. The data obtained with our MITO-Luc murine model demonstrated that 24 hours of SWCNT exposition resulted in a transient cell proliferation in several body districts with active bone marrow and immune organs, such as sternum, femur, vertebral column, and the spleen, showing that systemic SWCNT rapidly promotes an overall proliferation in different cell compartments.
We then moved to CD1 mice that were intravenously injected with different doses of SWCNTs and at different time points to trace acute and chronic CNT distribution, interaction with diverse organs, and metabolism.
We found that CD1 mice exposed to SWCNTs were initially asymptomatic and showed no changes in the body weight with time, but alterations in food/water consumption and fecal production were observed. CD1 mice treated with the highest dose of SWCNTs and monitored 3 months after the last injection exhibited typical symptoms of cholestasis, such as xanthomas and alopecia. We then hypothesized that the mild alterations in food and water consumption and in feces observed in SWCNT-exposed animals may correlate with altered liver function affecting intestinal absorption. Our hypothesis was confirmed by the analysis of serum liver enzyme (ALT, AST, and bilirubinemia) that we found to be altered in SWCNT-treated mice, as compared to control mice, suggesting potential liver damages. This is consistent with previously reported data from literature,28 where a similar liver damage associated with serum enzyme alteration was demonstrated. Our studies, however, evaluated levels at longer times with chronic exposure. Macroscopical and histological analyses revealed that the liver is the preferential organ for accumulation of CNTs, which can trigger oxidative stress and inflammation.47 We decided to focus our further studies on this major organ. Histopathological analysis revealed the accumulation of persistent SWCNT aggregates in the liver of CD1-treated mice. The long-term accumulation could be partially due to SWCNTs coming from other tissues, where they initially localized upon injection, followed by mobilization through the blood stream and sequestration in hepatic tissues. Counted aggregates in liver tissue sections, and SEM analysis following tissue KOH digestion, confirmed the presence of SWCNTs as a chemically resistant material. These data were further confirmed by EDS analysis, showing carbon localization in the sinusoids, where SWCNT deposits were detected by histology and TEM analysis.
We then assessed whether hepatic SWCNT aggregates may correlate with the induction of a liver tissue inflammatory state by measuring total leukocyte (CD45+ cells) infiltration. The number of CD45+ cells was remarkably and significantly increased in SWCNT-exposed mice as compared to control mice. Further analysis revealed that most of the CD45+ cells were macrophages, as confirmed by staining for CD45 and CD68. Both CD45+ and CD68+ cells colocalize with CNT aggregates, suggesting CNT recognition and the macrophage-mediated phagocytosis. It has been reported that CNTs injected into the blood determine the formation of agglomerates within the macrophage Kupffer cells.44 Macrophages, as a consequence of their plasticity have been reported to acquire two distinct phenotypes, M1 and M2, in the presence of diverse stimuli.29 We investigated whether macrophage and SWCNT interaction was associated with a specific polarization state. We found that activation of Kupffer cells (resident liver macrophages) resulted in the release of an array of inflammatory mediators and growth factor, as validated by real-time PCR, indicating an initial significant expression of IL-23 and over the long term in IL-12 and TNF-α release, all cytokines associated with an M1 macrophage polarization.
Altogether, our data suggest that, following intravenous administration of SWCNTs, a general acute proliferative cell response, along with a systemical increase in TNF-α levels, occurs. Functional and biochemical alterations observed in SWCNT-treated mice suggest a liver damage, which represents the primarily affected organ, as confirmed by the presence of particle aggregates and macrophage activation in the liver tissues of SWCNT-treated mice. Finally, we found that this macrophage-mediated inflammatory response is characterized by an M1 polarization state.
Our previous data indicated that unfunctionalized SWCNTs can penetrate into the organism.21 Although the doses used here were relatively different from those in the case of accidental exposure, they might represent a good model for long-term repeated exposure similar to that of the working place. Given the biopersistence of unfunctionalized CNTs, our data implicate that long-term, low-dose exposure to CNTs would lead to undesirable effects, particularly in the liver. Potentially, exposure to CNTs could also accelerate other inflammatory conditions of the liver, including chronic hepatitis and alcohol abuse.
Finally, observations in the literature, along with these new results showing long-term accumulation of nanoparticles in the liver, indicate that caution should be taken during the exposure to and use of SWCNTs.
Acknowledgments
This study was supported by the Fondazione CARIPLO (ID: 2011-2092) and the Associazione Italiana per la Ricerca sul Cancro (IG15895 to DMN and IG13234 to GP). RG and EG are participants in the PhD program of the Biotechnology, Biosciences and Surgical Technologies at the University of Insubria. EP, AB, and AP were supported by the Fondazione Italiana per la Ricerca sul Cancro. AB is a Fondazione Umberto Veronesi fellow. The authors thank Paola Corradino for data management and Alessandra Panvini Rosati for assistance.
Author contributions
AA, DMN, AG, GP, and MDE conceived the experiments, performed the statistical analysis, and wrote the article. EP, RG, EG, and AB performed the in vivo and in vitro experiments. TC performed the SEM analysis. IM performed the experiments with the MITO-Luc murine model. AB and DDS performed the statistical analysis and wrote the article. All authors contributed toward data analysis, drafting and critically revising the paper and agree to be accountable for all aspects of the work.
Disclosure
The authors declare no conflicts of interest in this work.
References
Liu Z, Tabakman S, Welsher K, Dai H. Carbon nanotubes in biology and medicine: in vitro and in vivo detection, imaging and drug delivery. Nano Res. 2009;2(2):85–120. | ||
Bianco A, Kostarelos K, Partidos CD, Prato M. Biomedical applications of functionalised carbon nanotubes. Chem Commun (Camb). 2005;(5):571–577. | ||
Bianco A, Kostarelos K, Prato M. Applications of carbon nanotubes in drug delivery. Curr Opin Chem Biol. 2005;9(6):674–679. | ||
Klumpp C, Kostarelos K, Prato M, Bianco A. Functionalized carbon nanotubes as emerging nanovectors for the delivery of therapeutics. Biochim Biophys Acta. 2006;1758(3):404–412. | ||
Wu W, Wieckowski S, Pastorin G, et al. Targeted delivery of amphotericin B to cells by using functionalized carbon nanotubes. Angew Chem Int Ed Engl. 2005;44(39):6358–6362. | ||
Kam NW, Dai H. Carbon nanotubes as intracellular protein transporters: generality and biological functionality. J Am Chem Soc. 2005;127(16):6021–6026. | ||
Kam NW, Liu Z, Dai H. Functionalization of carbon nanotubes via cleavable disulfide bonds for efficient intracellular delivery of siRNA and potent gene silencing. J Am Chem Soc. 2005;127(36):12492–12493. | ||
Pantarotto D, Briand JP, Prato M, Bianco A. Translocation of bioactive peptides across cell membranes by carbon nanotubes. Chem Commun (Camb). 2004;(1):16–17. | ||
Liu Y, Wu DC, Zhang WD, et al. Polyethylenimine-grafted multiwalled carbon nanotubes for secure noncovalent immobilization and efficient delivery of DNA. Angew Chem Int Ed Engl. 2005;44(30):4782–4785. | ||
Madani SY, Naderi N, Dissanayake O, Tan A, Seifalian AM. A new era of cancer treatment: carbon nanotubes as drug delivery tools. Int J Nanomedicine. 2011;6:2963–2979. | ||
Liu Z, Cai W, He L, et al. In vivo biodistribution and highly efficient tumour targeting of carbon nanotubes in mice. Nat Nanotechnol. 2007;2(1):47–52. | ||
Gwinn MR, Tran L. Risk management of nanomaterials. Wiley Interdiscip Rev Nanomed Nanobiotechnol. 2010;2(2):130–137. | ||
Lam CW, James JT, McCluskey R, Arepalli S, Hunter RL. A review of carbon nanotube toxicity and assessment of potential occupational and environmental health risks. Crit Rev Toxicol. 2006;36(3):189–217. | ||
Muller J, Huaux F, Moreau N, et al. Respiratory toxicity of multi-wall carbon nanotubes. Toxicol Appl Pharmacol. 2005;207(3):221–231. | ||
Shvedova AA, Kisin E, Murray AR, et al. Inhalation vs aspiration of single-walled carbon nanotubes in C57BL/6 mice: inflammation, fibrosis, oxidative stress, and mutagenesis. Am J Physiol Lung Cell Mol Physiol. 2008;295(4):L552–L565. | ||
Shvedova AA, Kisin ER, Mercer R, et al. Unusual inflammatory and fibrogenic pulmonary responses to single-walled carbon nanotubes in mice. Am J Physiol Lung Cell Mol Physiol. 2005;289(5):L698–L708. | ||
Warheit DB, Laurence BR, Reed KL, Roach DH, Reynolds GA, Webb TR. Comparative pulmonary toxicity assessment of single-wall carbon nanotubes in rats. Toxicol Sci. 2004;77(1):117–125. | ||
Liu D, Mori A, Huang L. Role of liposome size and RES blockade in controlling biodistribution and tumor uptake of GM1-containing liposomes. Biochim Biophys Acta. 1992;1104(1):95–101. | ||
Liu Z, Davis C, Cai W, He L, Chen X, Dai H. Circulation and long-term fate of functionalized, biocompatible single-walled carbon nanotubes in mice probed by Raman spectroscopy. Proc Natl Acad Sci U S A. 2008;105(5):1410–1415. | ||
Riviere JE. Pharmacokinetics of nanomaterials: an overview of carbon nanotubes, fullerenes and quantum dots. Wiley Interdiscip Rev Nanomed Nanobiotechnol. 2009;1(1):26–34. | ||
Albini A, Pagani A, Pulze L, et al. Environmental impact of multi-wall carbon nanotubes in a novel model of exposure: systemic distribution, macrophage accumulation, and amyloid deposition. Int J Nanomedicine. 2015;10:6133–6145. | ||
Albini A, Mussi V, Parodi A, et al. Interactions of single-wall carbon nanotubes with endothelial cells. Nanomedicine. 2010;6(2):277–288. | ||
Goeman F, Manni I, Artuso S, et al. Molecular imaging of nuclear factor-Y transcriptional activity maps proliferation sites in live animals. Mol Biol Cell. 2012;23(8):1467–1474. | ||
Li M, Al-Jamal KT, Kostarelos K, Reineke J. Physiologically based pharmacokinetic modeling of nanoparticles. ACS Nano. 2010;4(11):6303–6317. | ||
Hurt R, Monthioux M, Kane A. Toxicology of carbon nano materials: status, trends and prospective on the special issue. Carbon N Y. 2006;44:1028–1033. | ||
Wurden S, Homberg U. A simple method for immunofluorescent double staining with primary antisera from the same species. J Histochem Cytochem. 1993;41(4):627–630. | ||
Girardello R, Tasselli S, Baranzini N, Valvassori R, de Eguileor M, Grimaldi A. Effects of carbon nanotube environmental dispersion on an aquatic invertebrate, Hirudo medicinalis. PLoS One. 2015;10(12):e0144361. | ||
Yang ST, Wang X, Jia G, et al. Long-term accumulation and low toxicity of single-walled carbon nanotubes in intravenously exposed mice. Toxicol Lett. 2008;181(3):182–189. | ||
Sica A, Mantovani A. Macrophage plasticity and polarization: in vivo veritas. J Clin Invest. 2012;122(3):787–795. | ||
Armstrong RA. When to use the Bonferroni correction. Ophthalmic Physiol Opt. 2014;34(5):502–508. | ||
Streiner DL, Norman GR. Correction for multiple testing: is there a resolution? Chest. 2011;140(1):16–18. | ||
Bergamaschi E, Murphy F, Poland CA, et al. Impact and effectiveness of risk mitigation strategies on the insurability of nanomaterial production: evidences from industrial case studies. Wiley Interdiscip Rev Nanomed Nanobiotechnol. 2015;7(6):839–855. | ||
Dusinska M, Boland S, Saunders M, et al. Towards an alternative testing strategy for nanomaterials used in nanomedicine: lessons from NanoTEST. Nanotoxicology. 2015;9(suppl 1):118–132. | ||
Porter DW, Hubbs AF, Mercer RR, et al. Mouse pulmonary dose- and time course-responses induced by exposure to multi-walled carbon nanotubes. Toxicology. 2010;269(2–3):136–147. | ||
Gannon CJ, Cherukuri P, Yakobson BI, et al. Carbon nanotube-enhanced thermal destruction of cancer cells in a noninvasive radiofrequency field. Cancer. 2007;110(12):2654–2665. | ||
Lacerda L, Herrero MA, Venner K, Bianco A, Prato M, Kostarelos K. Carbon-nanotube shape and individualization critical for renal excretion. Small. 2008;4(8):1130–1132. | ||
Mehra NK, Palakurthi S. Interactions between carbon nanotubes and bioactives: a drug delivery perspective. Drug Discov Today. 2016;21(4):585–597. | ||
Brown D, Kinloch I, Bangert U, et al. An in vitro study of the potential of carbon nanotubes and nanofibres to induce inflammatory mediators and frustrated phagocytosis. Carbon N Y. 2007;45:1743–1756. | ||
Kotchey GP, Zhao Y, Kagan VE, Star A. Peroxidase-mediated biodegradation of carbon nanotubes in vitro and in vivo. Adv Drug Deliv Rev. 2013;65(15):1921–1932. | ||
Murray AR, Kisin E, Leonard SS, et al. Oxidative stress and inflammatory response in dermal toxicity of single-walled carbon nanotubes. Toxicology. 2009;257(3):161–171. | ||
Wang P, Wang Y, Nie X, Braini C, Bai R, Chen C. Multiwall carbon nanotubes directly promote fibroblast-myofibroblast and epithelial-mesenchymal transitions through the activation of the TGF-beta/smad signaling pathway. Small. 2015;11(4):446–455. | ||
Lawlor KE, Vince JE. Ambiguities in NLRP3 inflammasome regulation: is there a role for mitochondria? Biochim Biophys Acta. 2014;1840(4):1433–1440. | ||
Sun B, Wang X, Ji Z, et al. NADPH oxidase-dependent NLRP3 inflammasome activation and its important role in lung fibrosis by multiwalled carbon nanotubes. Small. 2015;11(17):2087–2097. | ||
Fufa MO, Mihaiescu DE, Mogoanta L, et al. In vivo biodistribution of CNTs using a BALB/c mouse experimental model. Rom J Morphol Embryol. 2015;56(4):1481–1493. | ||
Zhao Y, Allen BL, Star A. Enzymatic degradation of multiwalled carbon nanotubes. J Phys Chem A. 2011;115(34):9536–9544. | ||
Poland CA, Duffin R, Kinloch I, et al. Carbon nanotubes introduced into the abdominal cavity of mice show asbestos-like pathogenicity in a pilot study. Nat Nanotechnol. 2008;3(7):423–428. | ||
Buzea C, Pacheco II, Robbie K. Nanomaterials and nanoparticles: sources and toxicity. Biointerphases. 2007;2(4):MR17–MR71. |
Supplementary material
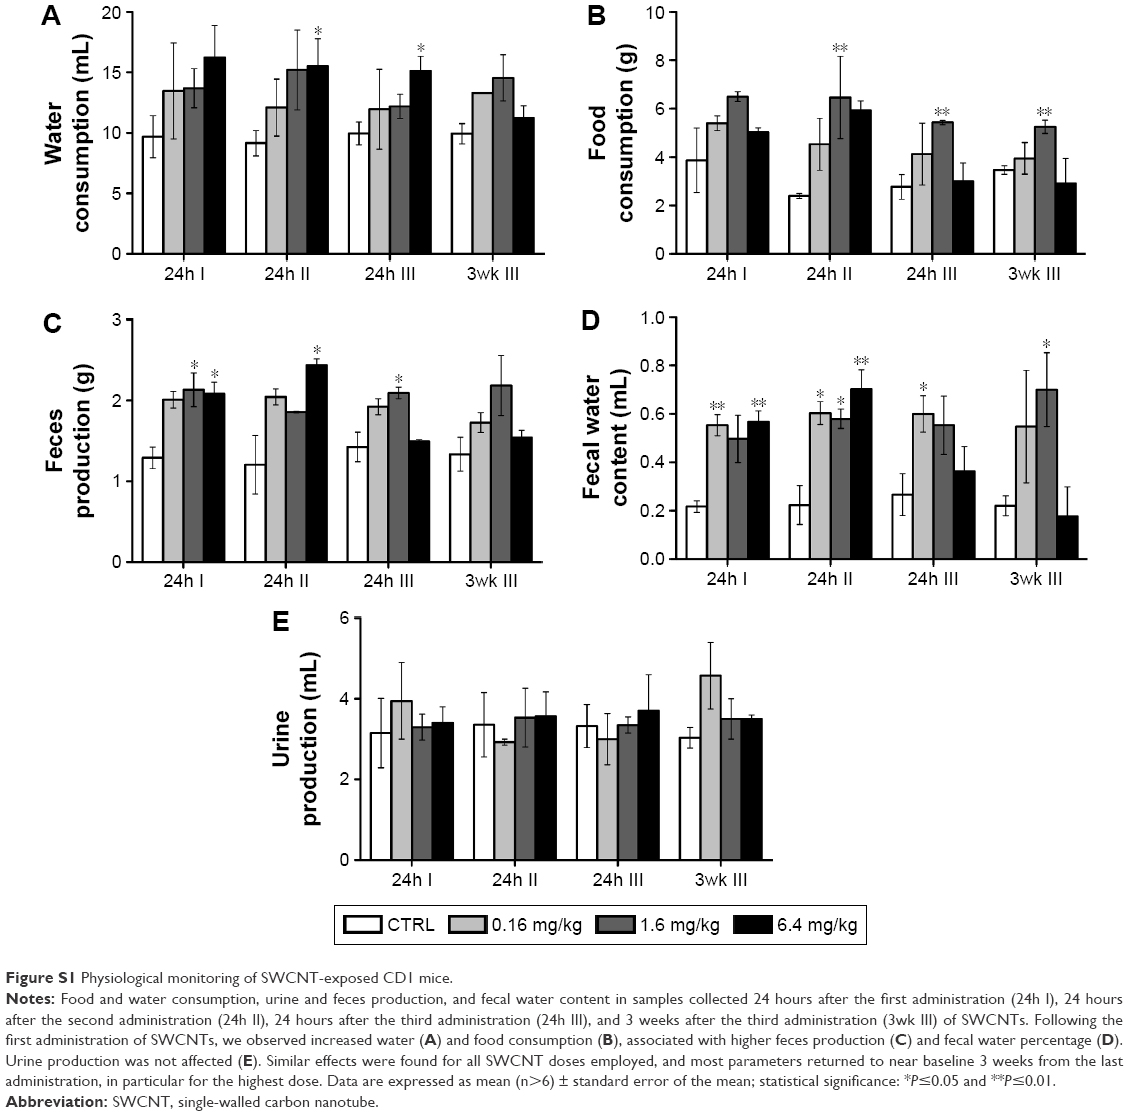 | Figure S1 Physiological monitoring of SWCNT-exposed CD1 mice. |
 © 2016 The Author(s). This work is published and licensed by Dove Medical Press Limited. The
full terms of this license are available at https://www.dovepress.com/terms
and incorporate the Creative Commons Attribution
- Non Commercial (unported, 3.0) License.
By accessing the work you hereby accept the Terms. Non-commercial uses of the work are permitted
without any further permission from Dove Medical Press Limited, provided the work is properly
attributed. For permission for commercial use of this work, please see paragraphs 4.2 and 5 of our Terms.
© 2016 The Author(s). This work is published and licensed by Dove Medical Press Limited. The
full terms of this license are available at https://www.dovepress.com/terms
and incorporate the Creative Commons Attribution
- Non Commercial (unported, 3.0) License.
By accessing the work you hereby accept the Terms. Non-commercial uses of the work are permitted
without any further permission from Dove Medical Press Limited, provided the work is properly
attributed. For permission for commercial use of this work, please see paragraphs 4.2 and 5 of our Terms.