Back to Journals » Therapeutics and Clinical Risk Management » Volume 13
Survival status and predictors of mortality among severely acute malnourished children <5 years of age admitted to stabilization centers in Gedeo Zone: a retrospective cohort study
Authors Girum T ![]() , Kote M
, Kote M ![]() , Tariku B
, Tariku B ![]() , Bekele H
, Bekele H
Received 15 August 2016
Accepted for publication 6 December 2016
Published 23 January 2017 Volume 2017:13 Pages 101—110
DOI https://doi.org/10.2147/TCRM.S119826
Checked for plagiarism Yes
Review by Single anonymous peer review
Peer reviewer comments 2
Editor who approved publication: Professor Garry Walsh
Tadele Girum,1 Mesfin Kote,2 Befikadu Tariku,2 Henok Bekele3
1Department of Public Health, College of Medicine and Health Sciences, Wolkite University, Wolkite, 2Department of Public Health, College of Medicine and Health Sciences, Arba Minch University, Arba Minch, 3Department of Planning, Adare Hospital, Southern Region Health Bureau, Hawassa, Ethiopia
Abstract: Despite the existence of standard protocol, many stabilization centers (SCs) continue to experience high mortality of children receiving treatment for severe acute malnutrition. Assessing treatment outcomes and identifying predictors may help to overcome this problem. Therefore, a 30-month retrospective cohort study was conducted among 545 randomly selected medical records of children <5 years of age admitted to SCs in Gedeo Zone. Data was entered by Epi Info version 7 and analyzed by STATA version 11. Cox proportional hazards model was built by forward stepwise procedure and compared by the likelihood ratio test and Harrell’s concordance, and fitness was checked by Cox–Snell residual plot. During follow-up, 51 (9.3%) children had died, and 414 (76%) and 26 (4.8%) children had recovered and defaulted (missed follow-up for 2 consecutive days), respectively. The survival rates at the end of the first, second and third weeks were 95.3%, 90% and 85%, respectively, and the overall mean survival time was 79.6 days. Age <24 months (adjusted hazard ratio [AHR] =2.841, 95% confidence interval [CI] =1.101–7.329), altered pulse rate (AHR =3.926, 95% CI =1.579–9.763), altered temperature (AHR =7.173, 95% CI =3.05–16.867), shock (AHR =3.805, 95% CI =1.829–7.919), anemia (AHR =2.618, 95% CI =1.148–5.97), nasogastric tube feeding (AHR =3.181, 95% CI =1.18–8.575), hypoglycemia (AHR =2.74, 95% CI =1.279–5.87) and treatment at hospital stabilization center (AHR =4.772, 95% CI =1.638–13.9) were independent predictors of mortality. The treatment outcomes and incidence of death were in the acceptable ranges of national and international standards. Intervention to further reduce deaths has to focus on young children with comorbidities and altered general conditions.
Keywords: severe acute malnutrition, survival status, children less than 5 years of age, treatment outcome, child mortality, Gedeo Zone
Introduction
Malnutrition refers to a broad range of clinical conditions in children and adults which result from deficiency of one or a number of nutrients leading to impaired physical functions to the point where the body can no longer maintain adequate bodily performance processes.1 It can be either undernutrition or overnutrition. In the developing world, it is generally undernutrition or protein energy malnutrition, which can be in acute or chronic form.2
SAM (wasting and/or nutritional edema) is defined globally as a very low WFH (below –3z scores of the median WHO growth standards, or <70% of the median National Center for Health Statistics standard) and by the presence of nutritional edema or MUAC <11.5 cm for age 6–59 months.3
Globally, 19 million preschool-age children, mostly from the WHO African Region and South-East Asia Region, are suffering from severe wasting every year.4 Childhood undernutrition is still a major global health problem, contributing to morbidity, mortality and increased risk of diseases; it contributes to 50%–60% of deaths in children.2–5 The risk of death is also nine times higher among children with SAM.6 Of the 7.6 million annual deaths among children <5 years of age,5 approximately 4.4% are attributable to severe wasting. It accounts for around 400,000 child deaths each year.4
Despite the availability of outpatient treatment, the number of children with SAM seeking admission at SCs is increasing. However, 50% of children with SAM die during treatment due to inappropriate care.2 It was seen for decades that the median case fatality rate remained at 20%–30% and death commonly occurred within the first 48 hours after admission.7 Depending on the type of SC, 1.5%–40% of case fatalities are recorded in different studies; generally as cases are milder, health center-based SCs have better outcome.8–13
As one of the developing countries, the case in Ethiopia is not different; malnutrition contributes to an estimated 270,000 deaths of children <5 years of age each year,14 and more than half of the deaths are attributable to undernutrition in youngsters.15 Severe malnutrition also accounts for 11% of deaths in children <5 years of age16 and is the primary diagnosis in 20% of pediatric hospital admissions.17 Unfortunately, 25%–30% of children with SAM die during hospital admissions.18 In different studies, the mortality rate during therapeutic management ranges from 3.6% to 28.67%.9,11
With the existence of functional SCs following standard protocol, such a high mortality rate is unacceptable. Studies suggest that a likely cause of such continuing high mortality could be faulty case management,7 the severity of illness at presentation and comorbidities.19,20 However, the case was not assessed before in the study area, and many of the determining factors for mortality during the inpatient care were not well addressed in previous studies which necessitated the need for further study in the area. So, the purpose of this study is to assess survival status and identify predictors of mortality among children <5 years of age with SAM in SCs of Gedeo Zone.
Materials and methods
Study design and settings
This retrospective cohort study was conducted at the SCs of Gedeo Zone, Southern Ethiopia. The zone has a total population of 1,105,813 divided in six districts and two urban cities. There are 40 health centers, one referral hospital and four private clinics. The woreda center health facilities and hospitals have SCs. The SCs offer services to severely malnourished children with complication and/or who have failed the appetite test in facility setups. These SCs serve as a treatment center for children with SAM based on the national protocol. Initially, children are admitted based on the diagnostic criteria, and are then treated through the three-phase protocol and discharged when they have achieved progress. In case if the children failed to achieve the expected progress in each phase, they are retreated through the first-phase protocol.
Study population and sampling technique
The source population included children aged <5 years with SAM admitted to SCs in Gedeo Zone from 2013 to 2015. Sample size was calculated based on double population proportion formula by using Epi Info version 7 computer program considering the following assumptions: 95% CI, power 80%, ratio of unexposed to exposed 1:2, outcome in exposed =15.88, outcome in unexposed =7.85 and risk ratio =2, and was found to be 568.10 The sample was allocated proportionally for the three randomly selected SCs, and computer-generated simple random sampling technique was used to select individual records from the SCs. Children with incomplete records and admitted based only on laboratory test (albumin test) result were excluded.
Data collection procedure and data quality control
Data was collected by using a structured checklist that was developed from the standard treatment protocol for the management of SAM. The checklist sought information on patient-related data, anthropometric measurements, comorbidities, type of SAM, treatment and others from individual records. The data was collected by four nurses after they were trained.
Study variables and data analysis
The outcome variable was death, the time variable was time to occurrence of death measured from admission to date of event and coded as zero (death) and otherwise one and the independent variables were sociodemographic, anthropometric and clinical presentations. All variables were defined according to the national SAM management protocol.
Data was cleaned, coded and entered into Epi Info version 7 and exported to STATA version 11, and then exploratory data analysis was carried out to check the levels of missing values, presence of influential outliers, multicollinearity, normality and proportionality of hazards over time. Life table was constructed to estimate the probabilities of death at different time intervals. Kaplan–Meier survival curve together with log-rank test was fitted to test for the presence of difference in incidence of death among the groups. Incidence of death with respect to person-time at risk was calculated. Variables significant at P<0.25 level in the bivariate analysis were included in the final Cox regression analysis to identify the independent predictors of mortality.
The final model was built by forward stepwise procedure and compared by likelihood ratio and Harrell’s concordance statistics test. Interactions were tested. Proportionality assumption was tested by global test based on Schoenfeld residuals. Goodness of fit of the final model was checked by Nelson–Aalen cumulative hazard function against Cox–Snell residual. Association was summarized by using AHR, and statistical significances were tested at 95% CI.
Ethical statement
The study used the routine existing admission and patient record data of SCs. Ethical approval for this study was obtained from Arba Minch University, College of Medicine and Health Sciences Committee (reference number CMHS/PG/130/08), and a support letter was obtained from the zonal health department. As the study used existing admission data and patient records, and there was no direct contact with patients, the committee waived the requirement for patient consent.
Results
Out of the total 568 randomly selected SAM records, the data from 545 (96%) was extracted with its necessary information, and for the remaining 20 (4%), the record (patient card) was not found. Among the 545 records, 347 (63.7%) were obtained from hospitals, and the rest from health centers.
Sociodemographic characteristics, anthropometry and type of malnutrition
Nearly half (290, 53.2%) of the children enrolled into the study were males, and 330 (60.6%) were aged <2 years with a median age of 24 (interquartile range: 12–36) months. A significant proportion (130, 23.9%) of children had a WFH <70% with a range of 37%–125%. Moreover, 277 (50.8%) children had a MUAC <11.5 cm, and 363 (66.6%) enrolled into the study had edematous malnutrition. Generally as per the protocol, children aged <6 months (24, 4.4%) were managed at phase II with F100 at the initial phase (Table 1).
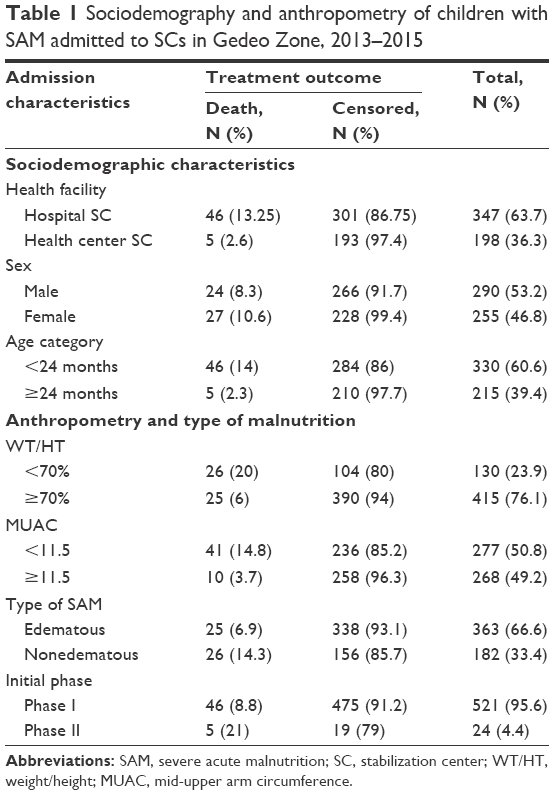 | Table 1 Sociodemography and anthropometry of children with SAM admitted to SCs in Gedeo Zone, 2013–2015 |
Clinical profile and morbidity patterns
More than half (57.6%) and one-third (34.1%) of children had diarrhea and vomiting, respectively; dehydration was reported in 80 (14.7%) of the total sampled children of which 43 (54%) were severely dehydrated. A significant proportion of children had deranged vital signs during admission. Altered respiration (fast breathing or respiratory failure), altered pulse rate (bradycardia or tachycardia) and altered body temperature (hypothermia or hyperpyrexia) were prevalent in 146 (26.8%), 104 (19.1%) and 92 (16.9%) children, respectively. While 103 (18.9%) children had altered level of consciousness (lethargic or comatose), 51 (9.4%) had experienced shock and 75 (13.8%) treatment failure (failure to achieve expected progress) (primary or secondary failure) (Table 2).
 | Table 2 Clinical profile of children with SAM at admission in SCs of Gedeo Zone, 2013–2015 |
Nearly two-thirds of the children had comorbidities/complications with SAM at admission, 147 (27.0%) study participants had pneumonia at the time of admission and 68 (12.5%) were anemic. Hypoglycemia, malaria, disseminated TB, conjunctivitis and kwash-dermatosis were prevalent in 48 (8.8%), 37 (6.8%), 41 (7.5%), 26 (4.5%) and 55 (10.1%) children, respectively. Of the children without comorbidities/complications on admission, 34 (6.2%) had developed comorbidity/complication after admission particularly of sepsis, oral thrush and other forms of nosocomial infections, and another 1.1% had experienced shock (Figure 1).
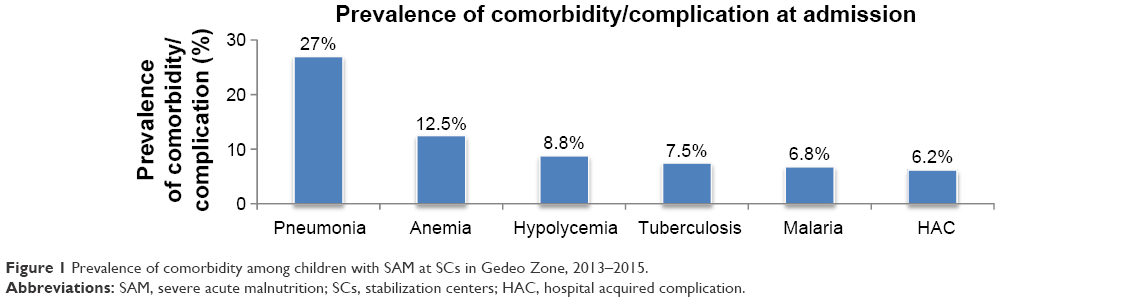 | Figure 1 Prevalence of comorbidity among children with SAM at SCs in Gedeo Zone, 2013–2015. |
Routine and special medicine provision
The most common medications provided according to the protocol were folic acid and vitamin A for 537 (98.5%) and 498 (91.4%) children, respectively, whereas additional 273 (50.1%), 209 (38.3%), 75 (13.8%), 31 (5.7%) and 137 (25.1%) children had required parenteral medication, ReSoMal (an oral rehydration solution for severely malnourished patients), IV fluid, blood transfusion and NG tube insertion, respectively (Figure 2).
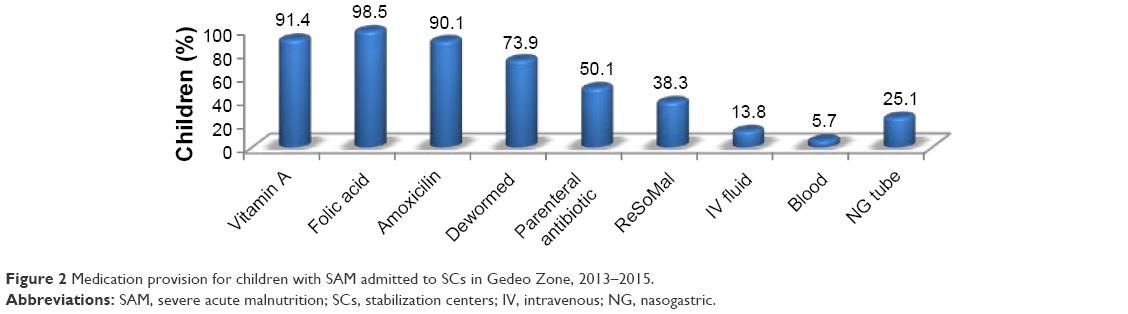 | Figure 2 Medication provision for children with SAM admitted to SCs in Gedeo Zone, 2013–2015. |
Survival status and treatment outcome
Survival status
A total of 545 children were followed for different periods: a minimum of 1 day and a maximum of 54 days with a median follow-up period of 13 days. The cumulative probability of survival at the end of the first, second, seventh, 14th and 21st days was 99%, 98%, 95.3%, 90% and 85%, respectively, with difference between categories of variables, whereas the overall mean survival time was 79.6 (95% CI =67.5–91.8) days (Figure 3). The mean survival time was also significantly different for predictor variables. The median survival time was undetermined. Because the largest observed analysis time was censored, the survivor function did not reach zero; in such a case, the mean is the best estimate of survival time.
 | Figure 3 Kaplan–Meier survival estimate among children with SAM admitted to SCs in Gedeo Zone, June 2013 to December 2015. |
Treatment outcome
During the follow-up period, 326 (59.7%) children had got cured and discharged, 89 (16.3%) had improved and required nutritional transfer, 51 (9.3%) had died during treatment, 37 (6.8%) had required medical transfer, 26 (4.8%) had defaulted and 16 (2.9%) were right-censored. Of 51 deaths, 17.6% had occurred in the first 48 hours, 47% in the first week and 84% by the end of the second week. The average length of stay in the hospital was 14 days, and the average weight gain was 8.7 g/kg/day (11.2 g/kg/day for children with nonedematous malnutrition and 7.45 g/kg/day for children with edematous malnutrition) (Table 3).
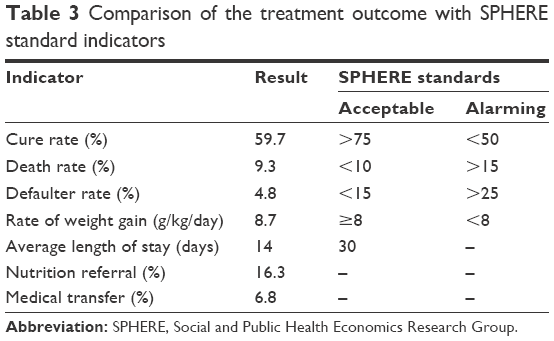 | Table 3 Comparison of the treatment outcome with SPHERE standard indicators |
Factors associated with the death of children with SAM admitted to SCs
To show the hazard of death during the course of intervention period, Kaplan–Meier survival curves with log-rank test were used over different factors, and significant difference was observed. The survival of children with hypoglycemia, shock, altered pulse rate and altered body temperature was significantly shorter (died earlier) (P-value <0.001; Table 4).
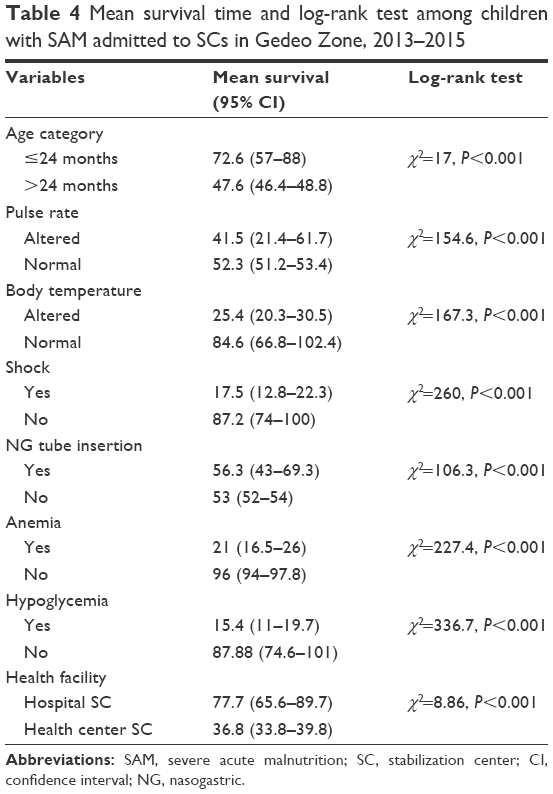 | Table 4 Mean survival time and log-rank test among children with SAM admitted to SCs in Gedeo Zone, 2013–2015 |
Cox regression analysis
Bivariate analysis
Using Cox regression, bivariate analysis was performed for the independent variables. During regression, death was considered as failure, and all other outcomes as censored. In bivariate analysis, a significant difference was observed between potential predictors; type of SAM, dehydration, altered respiration, pulse rate, shock, special antibiotic, IV fluid, blood transfusion, NG tube requirement, anemia, malaria, hypoglycemia, type of health facility and age and others were associated with mortality (Table 5).
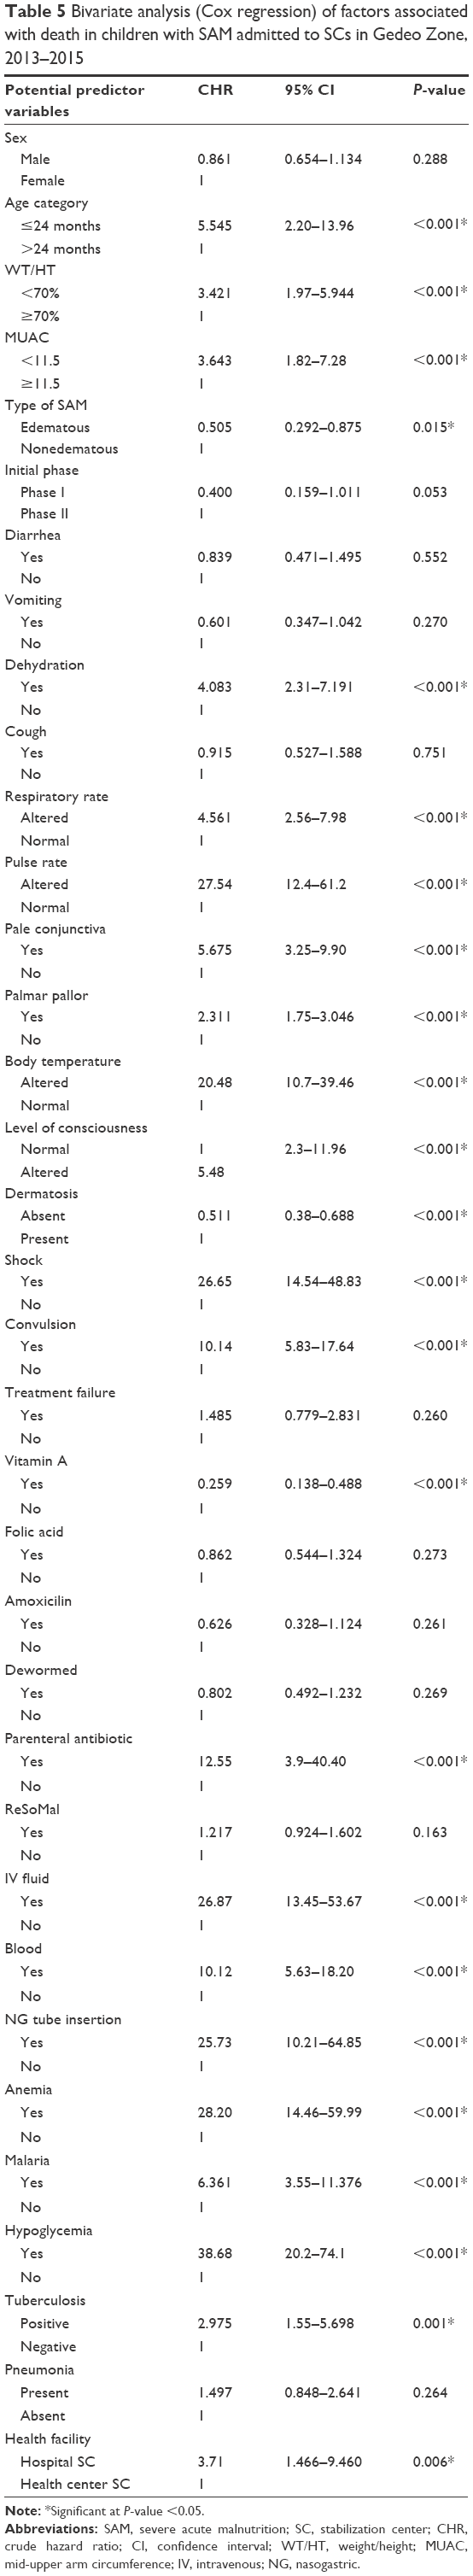 | Table 5 Bivariate analysis (Cox regression) of factors associated with death in children with SAM admitted to SCs in Gedeo Zone, 2013–2015 |
Multiple Cox regression
By using variables having a P-value of <0.25 in the bivariate analysis, multiple Cox regression with forward stepwise method was performed. Age <24 months, altered body temperature (axillary T0 ≤35 and T0 ≥39°C), altered pulse rate (bradycardia/tachycardia), shock, NG tube insertion, anemia, hypoglycemia and type of health facility (hospital SC) were found to be independent predictors of death in severely malnourished children admitted to SCs in Gedeo Zone. However, type of malnutrition, dehydration, respiratory rate, level of consciousness, special antibiotic, IV fluid, blood transfusion, malaria, TB and MUAC were not independent predictors of death (Table 6).
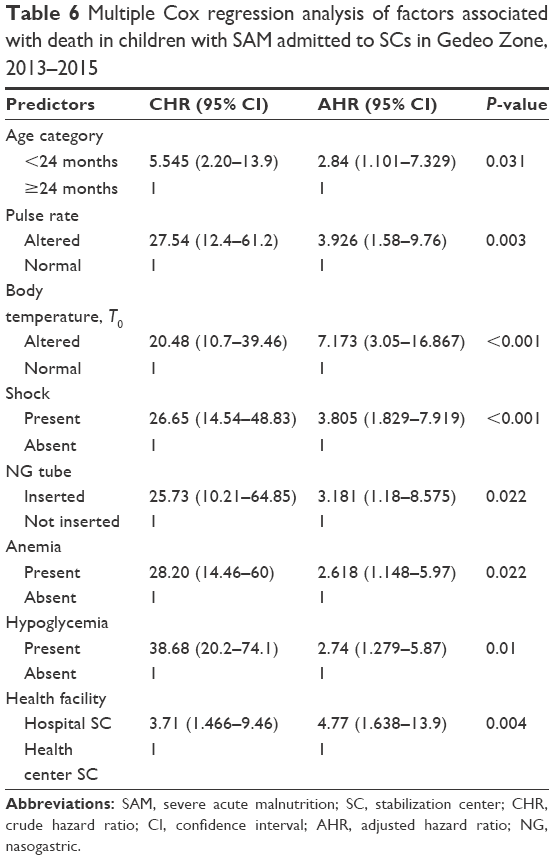 | Table 6 Multiple Cox regression analysis of factors associated with death in children with SAM admitted to SCs in Gedeo Zone, 2013–2015 |
Discussion
In this study, it was found that the cumulative probability of survival at the end of the first, second and third weeks was 95.3%, 90% and 85%, respectively, whereas the mean survival time was 79.6 (95% CI =67.5–91.8) days. Age <24 months, altered pulse rate, altered body temperature, shock, anemia, NG tube feeding, hypoglycemia and hospital SC-based care were independent predictors of mortality. Similarly, these variables significantly reduced the survival of children with SAM in the SCs. This effect was also identified in other studies.10–13
This study revealed that 51 (9.3%) children had died during the period of follow-up which was consistent with the minimum SPHERE standard of 10% mortality21 and the finding of Jarso et al,10 and since the studies were conducted in the same setups, such similarities were expected. However, the finding was not consistent with some other studies,12,13 in which 28.67% and 40.5% of children had died and the rate of mortality was higher than most national studies.22,23 The earlier findings were particularly due to enrollment of only severe and complicated cases, whereas the latter were health center-based researches. In addition, such discrepancies may result from differences in patient load, patient clinical profile, management protocol, management team and supplies.
The average length of stay in the SCs of 14 days was much lower than the international standard (SPHERE) set for the management of SAM which is <30 days.21 In the same way, the average length of stay was lower than that reported in other national studies,10,11 but it was longer than that reported in other studies.8,13 This may have been due to the underlying medical conditions of children; when they have chronic comorbid conditions like TB, they spend a longer time in the hospital.3,24
The average weight gain of 8.7 g/kg/day was also in agreement with the minimum international standard set for the management of SAM which is 8 g/kg/day.21 However, it was lower than a study conducted in similar settings10 and a study conducted in a community-based treatment setup,8,12 which could have been due to the high prevalence of grade 3 edema in our case, for which weight loss is expected than gain. The length of stay was another influencing factor which was different among the reports.
Adjusting other variables, children with an age <24 months were three times more likely to die than children aged ≥24 months. This was in agreement with the finding of Jarso et al which showed they were two times more likely to die earlier. Younger children may be more vulnerable because of depressed immunity, increased risk of infection and insufficient feeding practices.10 This finding was also supported by different studies,9,13,25 but in others, age was not a predictor of mortality.11 This difference could have been due to enrollment of the most susceptible age groups (<6 months) which carry the highest risk of mortality.
The hazard rate of death among children with anemia was 2.62 times higher than among children with no anemia. A research conducted in a hospital in Sekota of north Ethiopia also showed the case fatality rate of severe anemia was higher.11 Similarly, the risk of death for children with anemia (measured in terms of palmar pallor) was 2.1 times higher in Jimma University Specialized Hospital,10 and with the same measurement, studies conducted in South Africa and Niger26,27 supported that the hazard of mortality is higher in exposed children. This is because during anemia, the prevalence of infection and the probability of heart failure increase and overall compliance will decrease.
Altered body temperature (hypothermia and hyperpyrexia) significantly increased the risk of mortality among children with SAM. The risk of earlier death was seven times higher for children who had altered body temperature than children who had normal temperature. Hypothermia increased the hazard of mortality by threefold in another study,10 while in contrast to these findings, a study conducted in South Africa showed no association.26 Since hypothermia and hyperpyrexia affect the biochemical reactions of the body, and are indicators of altered metabolism, sepsis and serious infections, the mortality ascribed to such alteration is high.1,24
Similarly, the risk of death in children who had altered pulse rate was four times higher than those who had normal pulse rate. A study found that the presence of imperceptible pulse increased the risk of death in children by 3.9 times.28 Furthermore, the development of shock significantly increased the hazard of mortality in our study (AHR =3.805, 95% CI =1.829–7.919). Altered pulse rate is a primary indicator of the presence of shock, serious infections, severe dehydration and fluid and electrolyte imbalance which are killers;29 when the condition progresses to shock, the progress is poor.2,3
Similarly, hypoglycemic children were significantly more likely to die during treatment compared to their normoglycemic counterparts who were more likely to have a successful outcome. The finding of this study that hypoglycemia is a risk factor for poor outcome among severely malnourished children agreed with those previously reported by other authors30 but was in contrast to the results from a Ugandan study which found no adequate association between hypoglycemia and increased hazard of death.29
The other predictors explored in this study were children’s feeding status and the health facility in which SCs were located; those children fed with NG tube were three times more likely to die than children fed per-mouth. This could be explained by the fact that NG tube is required when the child has altered consciousness, shock or serious infection and failed appetite test and complications like aspiration in part contribute to high mortality. The fact that children admitted to hospital SC carry significantly higher risk of death is also possibly explained by that hospital SCs are referral centers for serious cases and possible serious nosocomial infections acquired due to immune compromization.13
Other diseases such as TB and malaria did not predict mortality in our study. This was in contrast to another study11 in which the risk of death due to TB was threefold and that ascribed to malaria was 2.13-fold (95% CI =1.12–7.35). This may be due to that majority of malaria cases were mild. In the same way, type of SAM, dehydration and anthropometries were not independent predictors of hazard of death.
Strength and limitation of the study
This research addressed the status of SCs at health center and hospital level in wider geography. Data regarding predictors was collected at admission, before the discharge outcome was known, which reduced bias. Since the outcome was death, it was easy to establish temporal relationship with predictor variables which were documented at the time of admission. However, the findings of this study might suffer from the fact that it is a retrospective study and based on records; some variables were missing, while the others were not recordable. Moreover, the reliability of the recorded data could not be ascertained, and there was potential bias associated with excluded records and unknown status of absconders.
Conclusion and recommendations
The cumulative probability of survival at the end of the first, second and third weeks was 95.3%, 90% and 85%, respectively, and the overall mean survival time was 79.6 (95% CI =67.5–91.8) days. Treatment outcomes were in acceptable level of SPHERE standard, national management protocol and most reports in the literatures. However, the mortality rate was higher than most national studies. The main predictors of deaths for severely malnourished children admitted to SCs in Gedeo Zone were being young (aged <24 months), having altered body temperature (hypothermia/hyperpyrexia), having altered pulse rate (bradycardia/tachycardia), having comorbidities like shock, hypoglycemia and anemia, being NG tube fed and being treated at hospital.
Therefore, appropriate diagnosis and management of cases in SCs according to the national protocol is needed with special attention to be paid to those young children with comorbidities and altered general conditions; further, organization of intensive care unit is crucial. The finding of this research may provide necessary information on areas of improvement; however, further research is needed to give policy-level recommendation.
Abbreviations
AHR, adjusted hazard ratio; CI, confidence interval; IV, intravenous; MUAC, mid-upper arm circumference; NG, nasogastric; SAM, severe acute malnutrition; SC, stabilization center; SPHERE, Social and Public Health Economics Research Group; TB, tuberculosis; WFH, weight for height; WHO, World Health Organization.
Acknowledgments
The authors sincerely thank the heads of Gedeo Zone and the district health departments, Dilla University Referral Hospital (DURH), health professionals, data collectors and friends who have contributed to this work. They also acknowledge College of Medicine and Health Sciences, Arba Minch University, for facilitating the study.
Author contributions
All authors have made substantial intellectual contributions to conception and design of study, and acquisition, analysis and interpretation of data. They have also been involved in drafting the manuscript, approved the final manuscript and agreed to be accountable for all aspects of this work.
Disclosure
The authors report no conflicts of interest in this work.
References
Sylvie C, Michael G, Yvonne G. Ethiopia Protocol for the Management of Severe Acute Malnutrition. 2nd ed. Addis Ababa, Ethiopia: Ethiopian Federal Ministry of Health; 2007. | ||
Collins S, Dent N, Binns P, Bahwere P, Sadler K, Hallam A. Management of severe acute malnutrition in children. Lancet. 2006;368(9551):1992–2000. | ||
World Health Organization. Guideline: updates on the management of severe acute malnutrition in infants and children. Geneva, Switzerland: WHO; 2013. Available from: http://apps.who.int/iris/bitstream/10665/95584/1/9789241506328_eng.pdf. Accessed July 8, 2016. | ||
Black RE, Victora CG, Walker SP, et al; Maternal and Child Nutrition Study Group. Maternal and child undernutrition and overweight in low-income and middle-income countries. Lancet. 2013;382(9890):427–451. | ||
United Nations Interagency Group for Child Mortality Estimation. Levels and trends in child mortality. Report. New York: UNICEF; 2012. | ||
World Health Organization. WHO child growth standards and the identification of severe acute malnutrition in infants and children. A joint statement by the World Health Organization and the United Nations Children’s Fund. Geneva, Switzerland: WHO; 2009. Available from: http://apps.who.int/iris/bitstream/10665/44129/1/9789241598163_eng.pdf. Accessed July 8, 2016. | ||
Schofield C, Ashworth A. Why have mortality rates for severe malnutrition remained so high? Bull World Health Organ. 1996;74(2):223–229. | ||
Lijalem M, Ahmed A, Mulate A, Asmare A, Bahiru K. Severity of malnutrition and treatment responses in under five children in Bahir Dar Felege Hiwot Referral Hospital, Northwest Ethiopia. J Food Nutr Sci. 2014;2(3):93–98. | ||
Teferi E, Lera M, Sita S, Bogale Z, Datiko DG, Yassin MA. Treatment outcome of children with severe acute malnutrition admitted to therapeutic feeding centers in Southern Region of Ethiopia. Ethiop J Health Dev. 2010;24(3):234–238. | ||
Jarso H, Workicho A, Alemseged F. Survival status and predictors of mortality in severely malnourished children admitted to Jimma University Specialized Hospital from 2010 to 2012, Jimma, Ethiopia: a retrospective longitudinal study. BMC Pediatr. 2015;15:76. | ||
Desta KS. Survival status and predictors of mortality among children aged 0–59 months with severe acute malnutrition admitted to stabilization center at Sekota Hospital Waghemra Zone. J Nutr Disord Ther. 2015;5:160. | ||
Banbeta A, Seyoum D, Belachew T, Birlie B, Getachew Y. Modeling time-to-cure from severe acute malnutrition: application of various parametric frailty models. Arch Public Health. 2015;73:6. | ||
Munthali T, Jacobs C, Sitali L, Dambe R, Michelo C. Mortality and morbidity patterns in under-five children with severe acute malnutrition (SAM) in Zambia: a five-year retrospective review of hospital-based records (2009–2013). Arch Public Health. 2015;73(1):23. | ||
Abuye C. Nutrition baseline survey report for the National Nutrition Program of Ethiopia. Addis Ababa, Ethiopia: Ethiopian Health and Nutrition Research Institute; 2009. | ||
Caulfield LE, de Onis M, Blössner M, Black RE. Undernutrition as an underlying cause of child deaths associated with diarrhea, pneumonia, malaria, and measles. Am J Clin Nutr. 2004;80(1):193–198. | ||
Egata G, Berhane Y, Worku A. Seasonal variation in the prevalence of acute under nutrition among children under five years of age in east rural Ethiopia: a longitudinal study. BMC Public Health. 2013;13:864. | ||
Gordon DM, Frenning S, Draper HR, Kokeb M. Prevalence and burden of diseases presenting to a general pediatrics ward in Gondar, Ethiopia. J Trop Pediatr. 2013;59(5):350–357. | ||
WHO, WFP, SCN and UNICEF. WHO/WFP/SCN and UNICEF joint statement on community-based management of severe acute malnutrition. Geneva: UNICEF; 2007. | ||
Kessler L, Daley H, Malenga G, Graham S. The impact of the human immunodeficiency virus type 1 on the management of severe malnutrition in Malawi. Ann Trop Paediatr. 2000;20(1):50–56. | ||
Maitland K, Berkley JA, Shebbe M, Peshu N, English M, Newton CR. Children with severe malnutrition: can those at highest risk of death be identified with the WHO protocol? PLoS Med. 2006;3(12):e500. | ||
The Sphere Project. Humanitarian Charter and Minimum Standards in Disaster Response. Geneva: The Sphere Project; 2003. | ||
Sadler K. Community-Based Therapeutic Care: Treating Severe Acute Malnutrition in Sub-Saharan Africa [doctoral thesis]. London: Centre for International Health & Development Institute of Child Health, UCL; 2003. | ||
Zelalem T, Tsinuel G, Ayalew T. Treatment outcome of severe acute malnutrition in children with and without HIV infection: a historical cohort study in South-West Ethiopia. Ethiop J Pediatr Child Health. 2010;6:14–26. | ||
FMOH. Training Manual on the Management of Severe Acute Malnutrition. 2nd ed. Addis Ababa, Ethiopia: Federal Ministry of Health; 2013. | ||
Shanka NA, Lemma S, Abyu DM. Recovery rate and determinants in treatment of children with severe acute malnutrition using outpatient therapeutic feeding program in Kamba District, South West Ethiopia. J Nutr Disord Ther. 2015;5(2):155. | ||
De Maayer T, Saloojee H. Clinical outcomes of severe malnutrition in a high tuberculosis and HIV setting. Arch Dis Child. 2011;96(6):560–564. | ||
Lapidus N, Minetti A, Djibo A, et al. Mortality risk among children admitted in a large-scale nutritional program in Niger, 2006. PLoS One. 2009;4(1):e4313. | ||
van den Broek JM, Roy SK, Khan WA, et al. Risk factors for mortality due to shigellosis among SAM children in Bangladesh. J Health Popul Nutr. 2005;23(3):259–265. | ||
Bachou H, Tumwine JK, Mwadime RK, Tylleskär T. Risk factors in hospital deaths in severely malnourished children in Kampala, Uganda. BMC Pediatr. 2006;6(1):7. | ||
Ahmed AU, Ahmed TU, Uddin MS, Chowdhury MHA, Rahman MH, Hossain MI. Outcome of standardized case management of under-5 children with severe acute malnutrition in three hospitals of Dhaka city in Bangladesh. Bangladesh J Child Health. 2013;37(1):5–13. |
 © 2017 The Author(s). This work is published and licensed by Dove Medical Press Limited. The
full terms of this license are available at https://www.dovepress.com/terms
and incorporate the Creative Commons Attribution
- Non Commercial (unported, 3.0) License.
By accessing the work you hereby accept the Terms. Non-commercial uses of the work are permitted
without any further permission from Dove Medical Press Limited, provided the work is properly
attributed. For permission for commercial use of this work, please see paragraphs 4.2 and 5 of our Terms.
© 2017 The Author(s). This work is published and licensed by Dove Medical Press Limited. The
full terms of this license are available at https://www.dovepress.com/terms
and incorporate the Creative Commons Attribution
- Non Commercial (unported, 3.0) License.
By accessing the work you hereby accept the Terms. Non-commercial uses of the work are permitted
without any further permission from Dove Medical Press Limited, provided the work is properly
attributed. For permission for commercial use of this work, please see paragraphs 4.2 and 5 of our Terms.