Back to Journals » Clinical Ophthalmology » Volume 19
Subclinical Microvascular Deficits as a Promising Biomarker for Functional Impairment in Non-Pathological High Myopia: A Cross-Sectional Study
Authors Chen Q, Liu J ![]() , Yan W
, Yan W ![]() , Meng Q, Chen X, Zeng Z, Sheng Y, Zhong H
, Meng Q, Chen X, Zeng Z, Sheng Y, Zhong H
Received 25 August 2025
Accepted for publication 1 December 2025
Published 9 December 2025 Volume 2025:19 Pages 4505—4523
DOI https://doi.org/10.2147/OPTH.S563107
Checked for plagiarism Yes
Review by Single anonymous peer review
Peer reviewer comments 2
Editor who approved publication: Dr John Miller
Qin Chen,1,* Jing Liu,1,* Wen Yan,2 Qingwei Meng,2,3 Xi Chen,1 Zhu Zeng,1 Ye Sheng,2 Hua Zhong2
1Department of Ophthalmology, The First Affiliated Hospital with Nanjing Medical University, Nanjing, People’s Republic of China; 2Department of Ophthalmology, The First Affiliated Hospital of Kunming Medical University, Kunming, People’s Republic of China; 3Department of Ophthalmology, HeiLongJiang Sengong Red Cross General Hospital, Harbin, People’s Republic of China
*These authors contributed equally to this work
Correspondence: Hua Zhong, Department of Ophthalmology, The First Affiliated Hospital of Kunming Medical University, Kunming, 650032, People’s Republic of China, Email [email protected] Qin Chen, Department of Ophthalmology, The First Affiliated Hospital with Nanjing Medical University, Nanjing, 210029, People’s Republic of China, Email [email protected]
Purpose: Myopia causes retinal structural and microvascular alterations, impairing visual function. This study examined macular vessel density using optical coherence tomography angiography (OCTA) and its relationship with macular light sensitivity (MLS) in myopic eyes, particularly in extreme myopia, to determine if vessel density can serve as an early marker for detection and monitoring of functional changes.
Patients and Methods: A cross-sectional study included 283 myopic eyes (age 18-60 years) grouped into low/moderate (LM&MM: − 0.50D ≥ SE > − 6.00D), high (HM: SE − 6.00D to − 10.00D), and extremely high myopia (EHM: SE ≤− 10.00D). All eyes underwent OCT and OCTA (6 × 6mm macular scans) to measure retinal and ganglion cell complex thicknesses and superficial (SVD) and deep vessel densities (DVD), as well as MP-1 microperimetry to assess MLS in central and parafoveal regions. Key outcome parameters were SVD, DVD, GCCT, and MLS.
Results: Macular SVD, DVD, and MLS decreased with increasing myopia severity (p < 0.01). Extremely myopic eyes had significantly lower SVD (47.37 vs 49.57), DVD (52.33 vs 55.55), and MLS (18.54 dB vs 19.24 dB) than low/moderate myopia eyes (all p < 0.01). These reductions were significant in most parafoveal quadrants, sparing the central foveal area (for vessel density) and nasal quadrant (for sensitivity). DVD correlated positively with MLS, especially in EHM and in the overall cohort, whereas SVD showed more limited correlations, primarily in the superior and temporal sectors. Multivariate regression identified DVD as an independent predictor of MLS, alongside SE and axial length.
Conclusion: Macular vessel density, particularly in the deep vascular plexus, declines with greater myopia and correlates with diminished macular function. OCTA-derived macular vessel density could be a promising biomarker candidate for early detection and monitoring of retinal functional impairment in myopic eyes.
Keywords: myopia, microperimeter, macular light sensitivity, macular vessel density
Introduction
Myopia is a leading cause of visual impairment and blindness. Its significantly increasing prevalence, particularly in Asia, has incurred substantial economic and social costs.1 As axial length elongates, the risk of severe ocular complications, such as macular degeneration, choroidal neovascularization, chorioretinal atrophy, and retinal detachment, rises.2 Moreover, the vision impairments caused by pathological myopia are often irreversible.3 Despite advancements in the treatment of pathological myopia, effective therapeutic strategies remain limited. Consequently, early detection of myopia-related complications is crucial for timely intervention. Understanding the relationship between morphological and functional changes in the fundus, alongside implementing immediate and appropriate interventions, is essential to delaying the onset of pathological myopia and preserving visual function.4
The detrimental effects of myopia on retinal morphology, such as thinning of the retina and ganglion cell layer, have been well-documented using optical coherence tomography (OCT).5,6 With the rapid advancement of optical coherence tomography angiography (OCTA) a novel, non-invasive imaging technique capable of detailed macular capillary analysis-reduced retinal vessel density and increased blood flow resistance have also been observed. These findings suggest that retinal microvasculature, in addition to retinal microstructural changes, plays a critical role in visual function in myopia-related retinal disorders.7–9 Macular function is typically assessed using the automated central 10-2 perimetry program, multifocal electroretinography (ERG), and microperimetry.10,11 Among these, retinal microperimetry, such as MP-1 microperimeter testing, correlates macular light sensitivity (MLS) with corresponding fundus images, providing a functional assessment of specific retinal points. However, the long testing duration and high demands for patient cooperation make it suboptimal for rapid, reproducible measurements to detect and monitor macular function changes in myopic eyes.12
Previous studies have demonstrated a positive correlation between macular vessel density (MVD) and MLS in high myopia.13 However, this relationship in individuals with extreme myopia requires further investigation. This study aims to examine the distribution of MVD, as measured by OCTA across different retinal layers, and to explore its relationship with MLS, as measured by MP-1 microperimetry, in myopic eyes. Particular attention is given to highly myopic eyes (spherical equivalent [SE] ≤ − 10.00D) without evident macular lesions. The goal is to determine whether MVD can serve as a reliable parameter for the early detection and long-term monitoring of myopic visual function changes in a simple, rapid, and effective manner.
Materials and Methods
Subjects
This prospective cross-sectional study enrolled myopic subjects consecutively from the First Affiliated Hospital of Nanjing Medical University, China, between October 1, 2020 and September 10, 2023. A total of 283 patients (283 eyes) aged 18-60 years, diagnosed with myopia (defined as a SE of −0.5 diopters (D) or less), were recruited for this study.
Inclusion criteria were (1) SE was −0.50D or less; (2) best corrected visual acuity (BCVA) of 0.1 logMAR or better.
Patients were ineligible to participate if they had one of the following conditions:
(1) Refractive media opacity, such as severe corneal diseases, cataract, or vitreous opacity, that impaired fundus examination or resulted in poor image quality; (2) pathological myopic macular degeneration category 2, category 3 or category 4 with additional features defined as “plus” lesions (lacquer cracks, myopic choroidal neovascularization and Fuchs spot), according to the definition stated by the Meta-analysis for Pathologic Myopia (META-PM) study group; (3) Comorbidities such as glaucoma, optic neuropathy, diabetic retinopathy, retinal or choroidal diseases that might affect visual field (VF) test results; (4) long-term ocular or systemic use of corticosteroids; (5) history of trauma or intraocular surgery, including vitreoretinal surgery, glaucoma surgery, cataract surgery or LASIK surgery.
Only one eye was chosen from every patient to avoid inter-eye correlation. Based on the result of SE, the enrolled subjects were divided into 3 groups: Group LM&MM (low and moderate myopia): SE between −0.50D and −6.00D (−0.50D ≥ SE > −6.00D); Group HM (high myopia): SE between −6.00D and −10.00D (−6.00D ≥ SE > −10.00D); Group EHM (extremely high myopia): SE of −10.00D or less (as defined in Han et al,14 SE ≤ −10.00D).
All participants underwent a complete ophthalmic evaluation, including slit-lamp microscopy, manifest refractive error, BCVA, intraocular pressure (IOP) with non-contact tonometer (Topcon, Tokyo, Japan), and AL by way of the IOL master 500 (Carl Zeiss, Jena, Germany). The central corneal thickness (CCT) was measured by ultrasonic pachymetry (DGH-550, DGH Technology, Exton, PA, USA).
OCT Imaging
Retinal thickness (RT) was measured by CIRRUS HD-OCT 5000 (Carl Zeiss Meditec, Germany). Imaging was performed using a 512×128 macular cube volume scan, generating a cube of data through a 6×6mm grid which was divided into three concentric circles, a central circle, inner ring, and outer ring with diameters of 1mm, 3mm, and 6mm, respectively. The outer ring was discarded, meanwhile the central circle and inner ring (3mm) area corresponding to the MP-1 microperimeter’s 10° macular region was used for analysis. Average retinal thickness was measured in the central 1 mm diameter zone (central), as well as 4 surrounding sectors (superior, inferior, temporal, and nasal) within the 3 mm diameter circular grid.
OCTA Imaging
OCTA images were obtained with a commercial spectral-domain OCT system (RTVue, XR, Avanti, Optovue, Fremont, CA, USA), with a scan rate of 70,000 A-scans per second, scan beam wavelength centered at 840 nm, and a bandwidth of 45 nm. The split-spectrum amplitude-decorrelation angiography (SSADA) algorithm was employed to calculate decorrelation between repeated B-scans for blood flow detection. Poor quality scans were excluded from the analysis if one of the following criteria were met: (1) poor clarity images; (2) local weak signal (quality index <7) caused by artifacts such as floaters; (3) residual motion artifacts visible as irregular vessel patterns on the en face angiogram and (4) uncorrected segmentation errors.
Macular 6 mm×6 mm scan centered on the fovea were acquired and retinal layers were automatically segmented in order to visualize the superficial vascular plexus in a slab from the internal limiting membrane (ILM) to 10μm above the inner plexiform layer (IPL), deep vascular plexus from 10μm above the IPL to10μm below the outer plexiform layer (OPL).
The vessel density (VD), defined as the percentage of the area occupied by microvasculature, in the superficial vascular plexus (SVD) and deep vascular plexus (DVD) was automatically analyzed using the built-in software. The macular region was segmented according to the nine sectors of the Early Treatment Diabetic Retinopathy Study (ETDRS). Further analysis focused on the foveal area (central circle with a diameter of 1 mm) and the parafoveal area (an annular region with an inner diameter of 1 mm and an outer diameter of 3 mm), which was subdivided into four quadrants: superior, nasal, inferior, and temporal. The ganglion cell complex thickness (GCCT) was also obtained simultaneously from the same scan as the MVD measurements within the ETDRS 6mm diameter macular grid.
The “auto-all focus” feature of the RTVue automatically estimates the participant’s refraction, in diopters, and accordingly adjusts the system’s configuration to ensure that the acquired images accurately represent the intended physical dimensions on the retina, to minimize any retinal magnification effects that might have occurred due to differences in participants’ axial lengths. Previous reports using the same instrument showed that no correction was necessary for possible magnification effects associated with increased axial length.15,16 This real-time scaling corrects the potential artifactual distortion of vessel density in highly myopic eyes by standardizing the scan area before quantification. As a result, we did not perform post-hoc axial length adjustments.
Microperimetry
Central retinal sensitivity was measured using the MP-1 microperimeter (Nidek Technologies, Padova, Italy) with the standard 10-2 test grid and a 4-2 staircase strategy. The examination involved presenting Goldmann size III white stimuli of varying intensities to 40 stimulus points, each lasting 200 ms. The overall dynamic testing range was 0 to 20 dB. A red circle with a diameter of 1° served as the central fixation target.
Concentric circles with diameters of 1 mm and 3 mm were overlaid onto the 10° microperimetry image using Photoshop software. The inner circle was defined as the central region, while the outer ring, located between the two circles, was subdivided into four equal fan-shaped sections representing the superior, nasal, inferior, and temporal regions. The macular light sensitivity (MLS) of these five sectors was recorded.
Statistical Analyses
All statistical analyses were performed using the SPSS software version 27.0 (SPSS Inc, Chicago, Illinois, USA).
- Normality tests were carried out for quantitative data and those with normal distribution are expressed as mean±standard deviation (SD). Chi-square test was applied to analyze the categorical variables, such as gender. Before comparing the differences among multiple groups, all datasets were examined for homogeneity of variance using Levine test. If the variances were equal, an ANOVA table was prepared to investigate the presence of different mean values among groups. In the presence of different means, the LSD post hoc tests was used to determine groups with significantly different mean values. In the case of non-equal variances, a generalization of Welch or Brown-Forsythe test was used, followed by Tamhane’s T2 post hoc tests. Continuous variables with skewed distribution were described as median (interquartile range) and the Kruskal–Wallis H-test was used to compare groups of variants. When p < 0.05, the difference was statistically significant.
- The correlation between RT, GCCT, SVD, DVD, and MLS was analyzed using partial correlation analysis after adjusting for age, gender, AL and IOP.
- Univariate linear regression analyses were applied to determine the effect of each independent variable (age, SE, RT, GCCT, SVD, DVD) on MLS and variables statistically significant at p < 0.05 were entered into a multivariable linear regression (stepwise method).
Result
Demographic and Clinical Characteristics of Patients in Three Groups
From the initial pool of 294 screened myopic subjects, 6 eyes were excluded due to intraocular surgery, 2 due to BCVA more than 0.1 logMAR or worse, 2 due to poor image quality (scan quality < 7/10), 1 due to significant motion artifacts. After these exclusions, a total of 283 eyes from 283 participants diagnosed with myopia were enrolled in the study. As illustrated in Figure 1, these were categorized into three groups: 80 eyes with low-to-moderate myopia (Group LM&MM), 112 eyes with high myopia (Group HM), and 91 eyes with extremely high myopia (Group EHM). Overall, 111 eyes were from male participants and 172 from female participants. The mean age of the participants was 27.88±6.49 years.
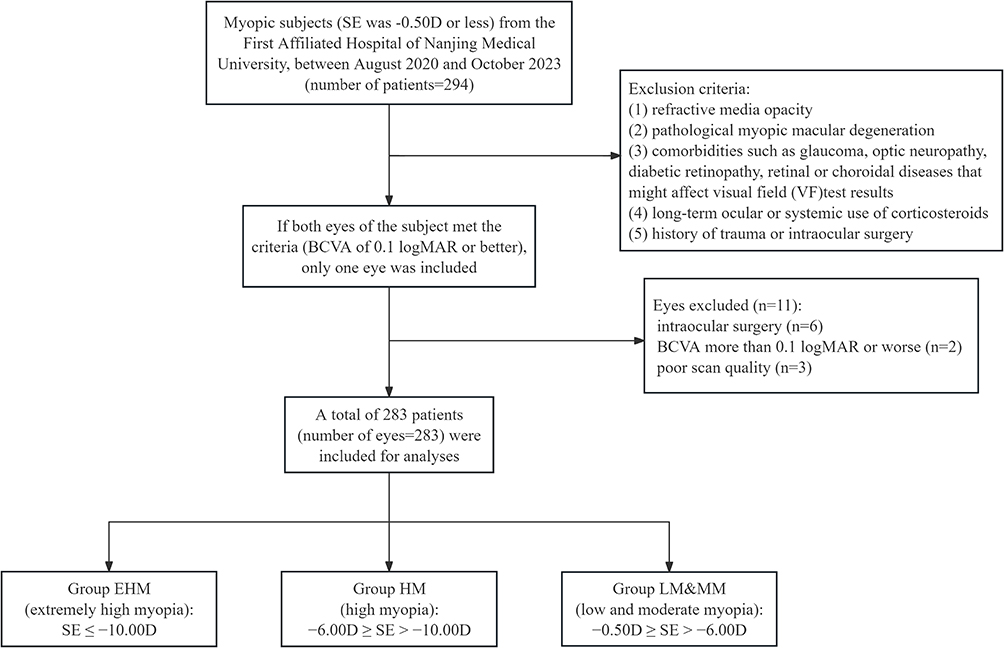 |
Figure 1 Flow diagram for study inclusion. Abbreviation: SE, spherical equivalent; best-corrected visual acuity (BCVA). |
The demographic and clinical characteristics of the three groups are summarized in Table 1. Statistically significant differences were observed among the groups regarding gender, central corneal thickness (CCT), axial length (AL), spherical equivalent (SE), retinal thickness (RT), ganglion cell complex thickness (GCCT), superficial vascular plexus (SVD), deep vascular plexus (DVD), and MLS (p < 0.05). No significant differences were found in age, best-corrected visual acuity (BCVA), or intraocular pressure (IOP) (p > 0.05).
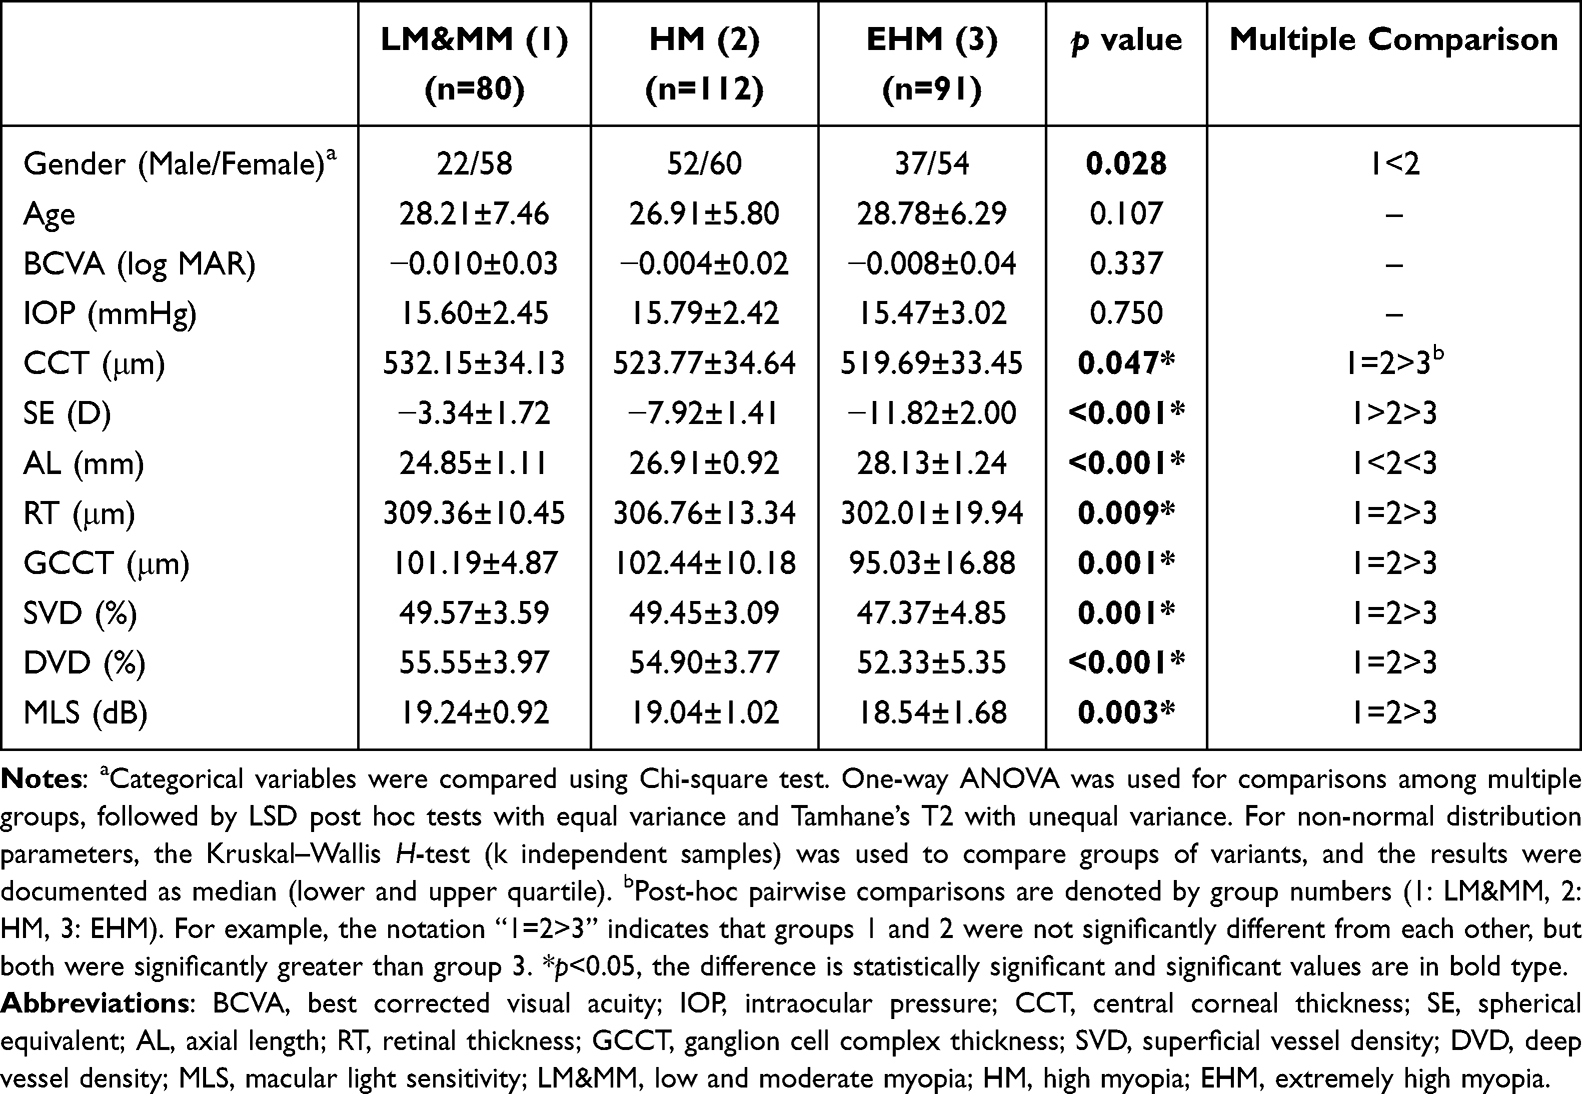 |
Table 1 Demographic and Clinical Characteristics of Patients in Three Groups |
Results of RT, GCCT, SVD, DVD and MLS Assessments
The comparisons of average and regional RT, GCCT, SVD, DVD, and MLS are presented in Table 2.
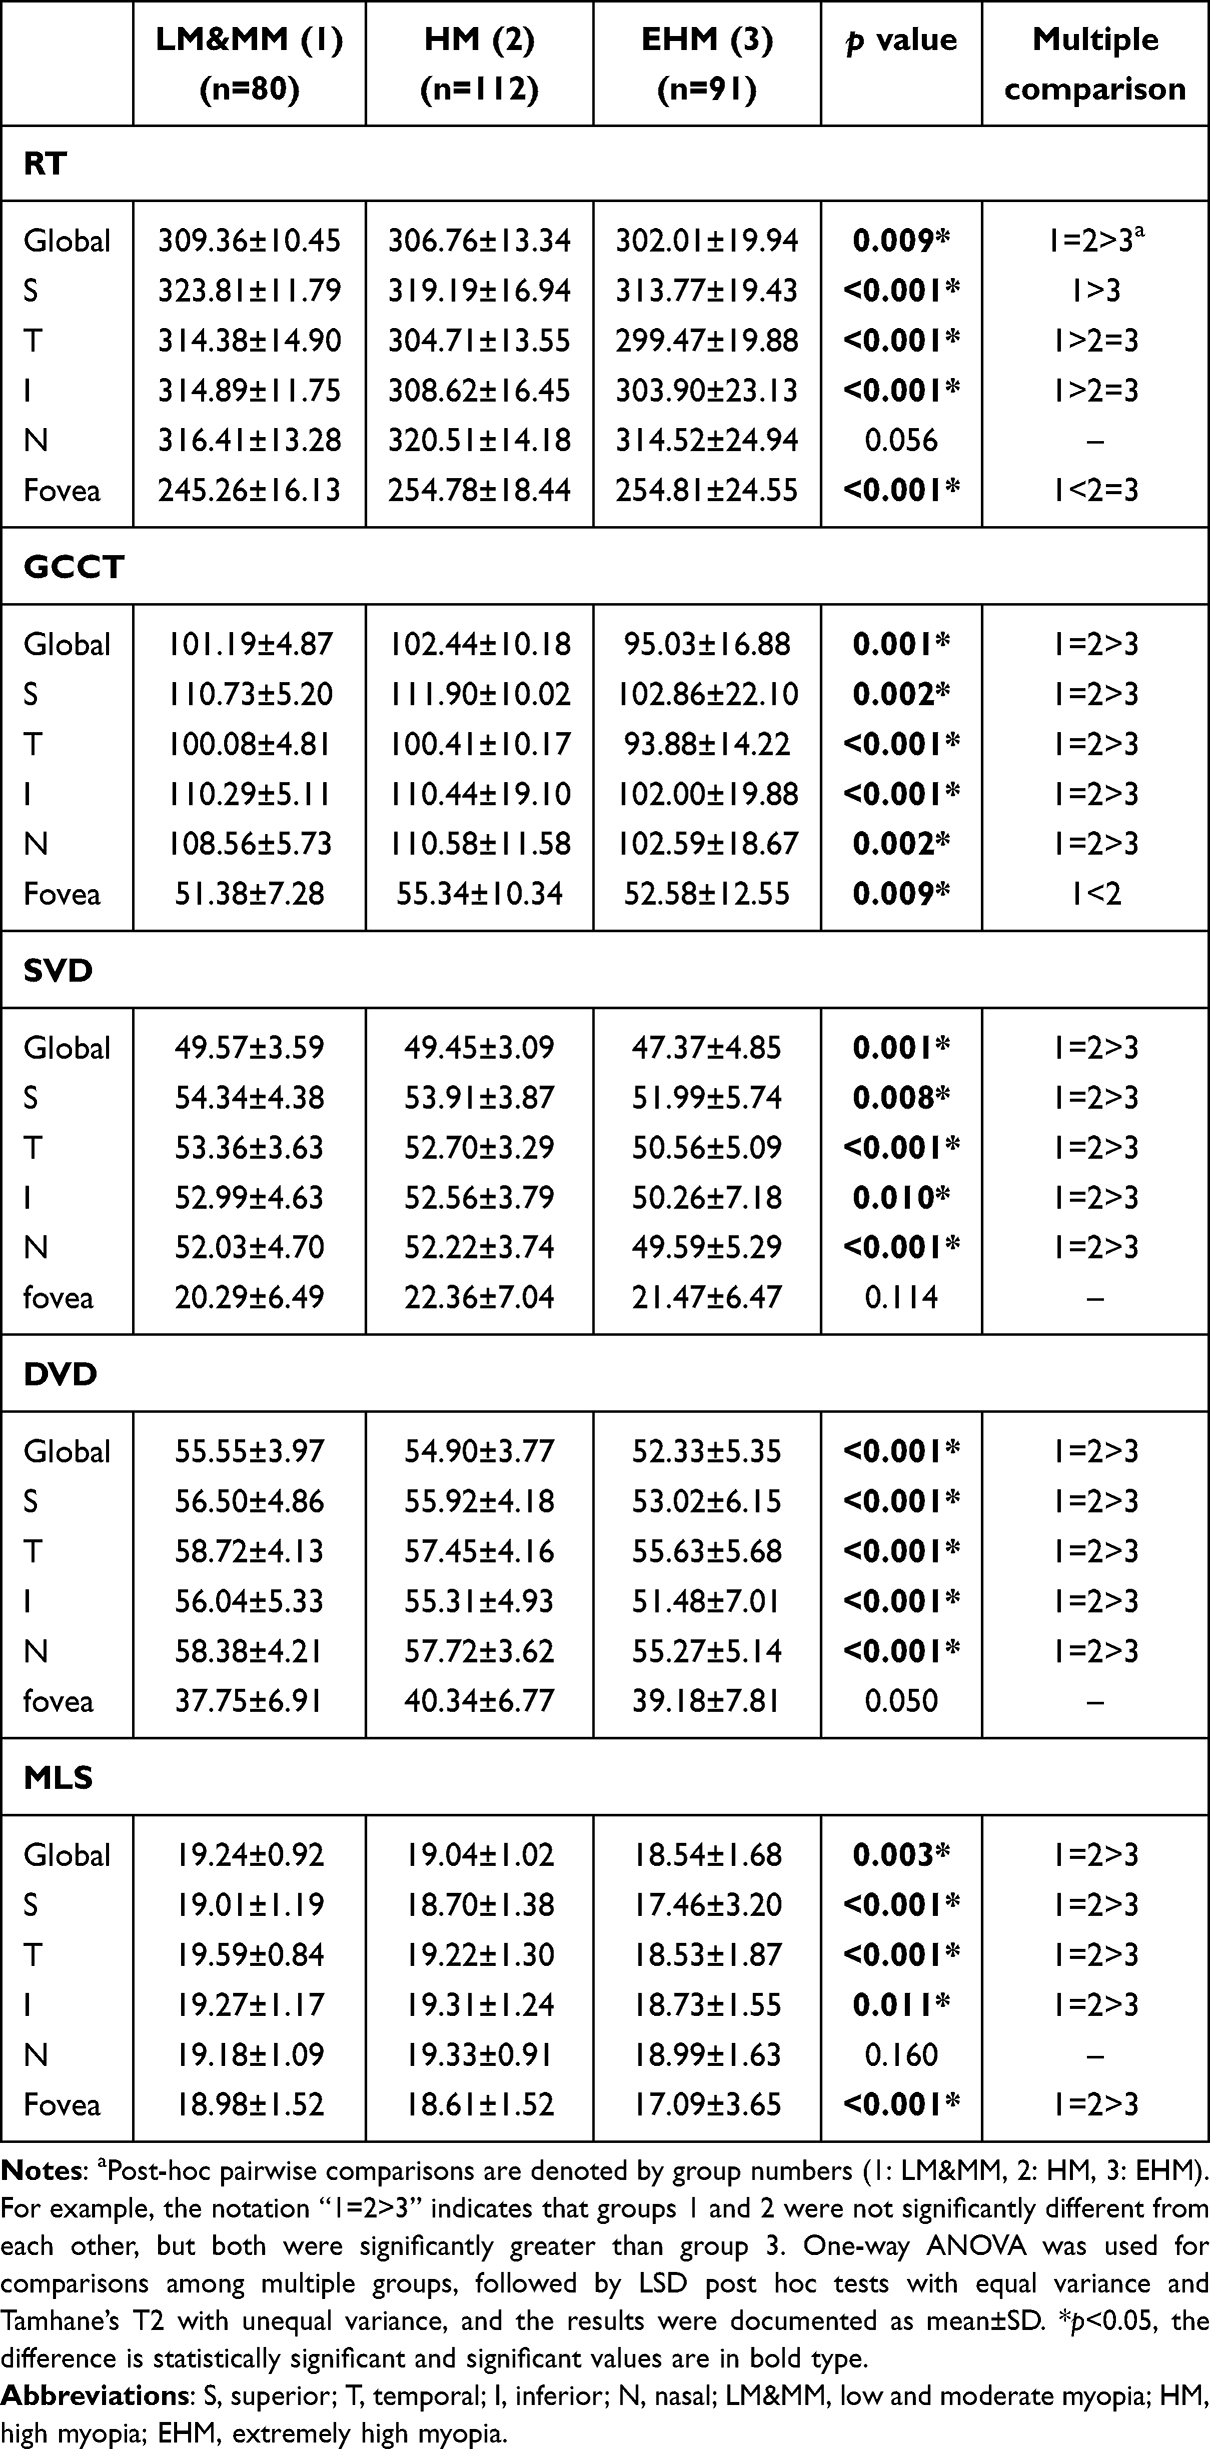 |
Table 2 Average and Regional RT, GCCT, SVD, DVD and MLS in Each Group |
For average RT, significant differences were observed among the three groups (p = 0.009). Significant differences were also found across all five regions (p < 0.001), except for the nasal region (p = 0.056). Multiple comparison analyses revealed that Group EHM (302.01±19.94 μm) had significantly thinner RT than Group LM&MM (309.36±10.45 μm, p = 0.002) and Group HM (306.76±13.34 μm, p = 0.027), while no significant difference was noted between Group LM&MM and Group HM (p > 0.05).
In the inferior and temporal regions, RT was significantly thinner in Group EHM (p < 0.001) and Group HM (p = 0.007) compared to Group LM&MM. In the superior region, Group EHM had significantly thinner RT than Group LM&MM (p < 0.001), although no significant difference was observed between Group LM&MM and Group HM (p > 0.05). Overall, retinal thickness decreased with increasing myopia severity. However, in the foveal region, RT was significantly thicker in Group EHM (p = 0.008) and Group HM (p < 0.001) than in Group LM&MM.
For GCCT, significant differences were observed globally and in all five regions among the three groups (p = 0.001). Group EHM showed significantly thinner average GCCT (95.03±16.88 μm) compared to Group LM&MM (101.19±4.87 μm, p = 0.004) and Group HM (102.44±10.18 μm, p < 0.001). Similarly, GCCT in all five regions was thinner in Group EHM than in Group LM&MM (p < 0.05) and Group HM (p < 0.05), except in the foveal region, where GCCT in Group HM was thicker than in Group LM&MM (p = 0.006).
For SVD, significant differences were observed globally and across all regions, including the superior, temporal, inferior, and nasal regions (p < 0.05). Multiple comparison analyses showed that the average SVD was significantly lower in Group EHM (47.37±4.85) compared to Group LM&MM (49.57±3.59, p = 0.003) and Group HM (49.45±3.09, p = 0.002), with no significant difference between Group LM&MM and Group HM (p > 0.05). Similar trends were observed in regional SVD comparisons, where Group EHM exhibited significantly lower SVD than Group LM&MM (p < 0.05) and Group HM (p < 0.05), except in the foveal region (p > 0.05).
The results for DVD closely paralleled those for SVD. Significant differences were observed globally and in all five regions, excluding the foveal region (p > 0.05). The average DVD was significantly lower in Group EHM (52.33±5.35) compared to Group LM&MM (55.55±3.97, p < 0.001) and Group HM (54.90±3.77, p < 0.001). No significant difference was observed between Group LM&MM and Group HM (p > 0.05). Regionally, Group EHM consistently exhibited significantly lower DVD than Group LM&MM (p < 0.05) and Group HM (p < 0.05), except in the foveal region (p = 0.05).
For MLS, significant differences were observed globally and regionally (p < 0.05), except in the nasal region (p = 0.160). Multiple comparison analyses showed that Group EHM had significantly lower average MLS (18.54±1.68) compared to Group LM&MM (19.24±0.92, p = 0.002) and Group HM (19.04±1.02, p = 0.039). Regionally, MLS was lower in Group EHM than in Group LM&MM (p < 0.05) and Group HM (p < 0.05), except in the nasal region (p > 0.05). The results of the average and regional comparisons of RT, GCCT, SVD, DVD, and MLS among the three groups are summarized in Figure 2.
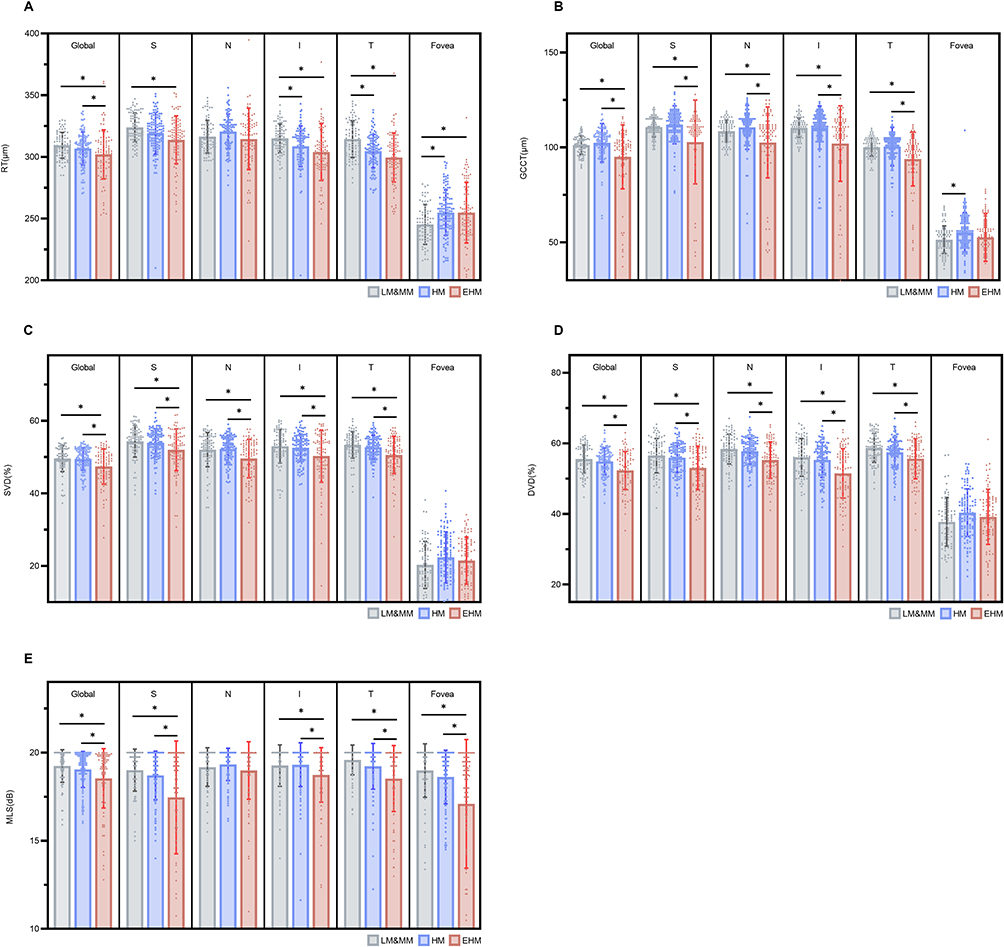 |
Figure 2 The average and regional RT, GCCT, SVD, DVD and MLS in each group. (A) The average, I and T regional RT in Group HM and EHM were statistically significant thinner than that in Group LM&MM. However, in foveal region, the RT in Group HM was thicker than that in Group LM&MM. (B) The average and four regional (S, N, I and T) GCCT in Group HM and EHM were statistically significant thinner than that in Group LM&MM. However, in foveal region, the GCCT in Group HM and EHM was thicker than that in Group LM&MM. In the S region, Group EHM had significantly thinner RT than Group LM&MM. (C) The average and four regional (S, N, I and T) SVD in Group HM and EHM were statistically significant thinner than that in Group LM&MM. However, there was no significant difference in foveal region. (D) The average and four regional (S, N, I and T) DVD in Group HM and EHM were statistically significant thinner than that in Group LM&MM. However, there was no significant difference in foveal region. (E) The average and four regional (S, I, T and fovea) MLS in Group HM and EHM were statistically significant lower than that in Group LM&MM. However, there was no significant difference in nasal region. *p < 0.05, the difference is statistically significant. |
Correlations Between Structure (RT, GCCT), Vasculature (SVD, DVD) and Function (MLS)
The partial correlation analyses adjusted for age, gender, AL and IOP between ocular parameters—RT, GCCT, SVD, DVD, and MLS—across the three groups are summarized in Table 3.
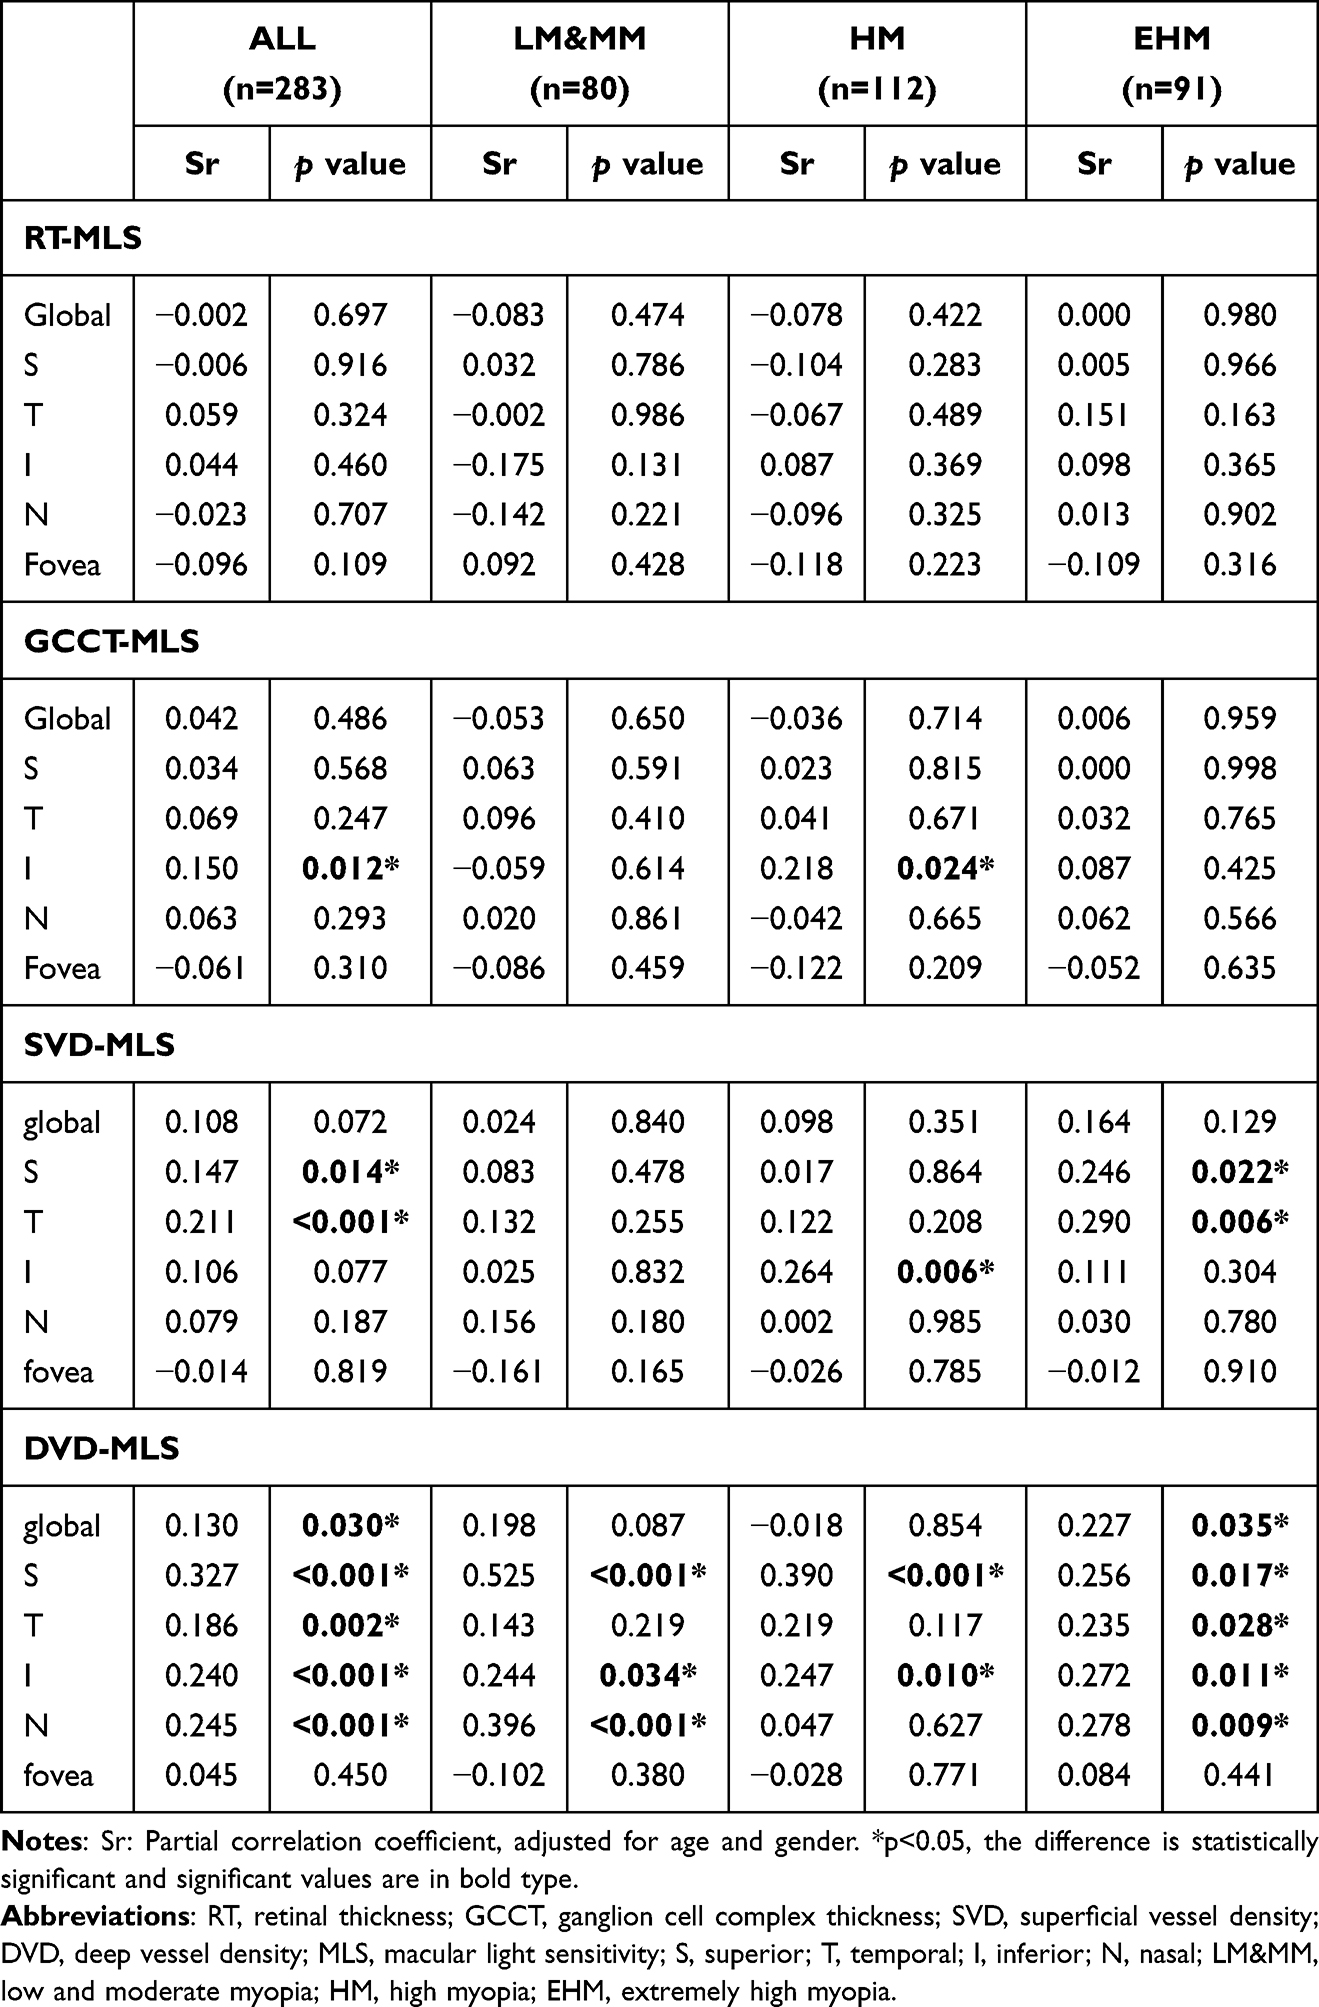 |
Table 3 The Average and Regional Partial Correlation Analyses Between RT, GCCT, SVD, DVD and MLS within Groups |
No significant correlations were observed between RT and MLS in any of the three groups (p > 0.05). For the correlation between GCCT and MLS, a significant relationship was noted only in the inferior region of Group HM (sr = 0.218, p = 0.024) and in the pooled analysis of all participants from the three groups (sr = 0.150, p = 0.012).
Regarding the relationship between vasculature (SVD, DVD) and function (MLS), no significant correlation was found between average SVD and average MLS in any of the groups (p > 0.05). However, in Group HM, MLS was significantly associated with SVD in the inferior region (sr = 0.264, p = 0.006). In Group EHM, significant associations were observed in the superior and temporal regions (sr = 0.246, p = 0.022 and sr = 0.290, p = 0.006 respectively). Similar to Group EHM, the pooled analysis across all participants also showed significant correlations in the superior and temporal regions (sr = 0.147, p = 0.014 and sr = 0.211, p < 0.001 respectively).
For DVD, significant correlations with MLS were observed in Group EHM and the pooled analysis for average DVD (sr = 0.227, p = 0.030 and sr = 0.130, p = 0.035 respectively). In Group LM&MM, MLS was significantly associated with DVD in the superior, nasal, and inferior regions (sr = 0.525, p < 0.001; sr = 0.396, p < 0.001 and sr = 0.244, p = 0.034 respectively). In Group HM, this relationship was no longer observed in the nasal region (sr = 0.627, p > 0.05), with significant correlations persisting only in the superior and inferior regions (sr = 0.390, p < 0.001 and sr = 0.247, p = 0.01 respectively).
In Group EHM, both global and four parafoveal regions demonstrated significant correlations between DVD and MLS (global sr = 0.227, p = 0.035; superior sr = 0.256, p = 0.017; nasal sr = 0.278, p = 0.009; inferior sr = 0.272, p = 0.011 and temporal sr = 0.235, p = 0.028 respectively), except for the foveal region. Similarly, in the pooled analysis, significant correlations between DVD and MLS were found in all regions except the fovea (global sr = 0.130, p = 0.03; superior sr = 0.327, p < 0.001; nasal sr = 0.245, p < 0.001; inferior sr = 0.240, p < 0.001 and temporal sr = 0.186, p = 0.002 respectively). Figure 3 illustrates the positive correlation between MLS and DVD across all participants in both average and regional measurements.
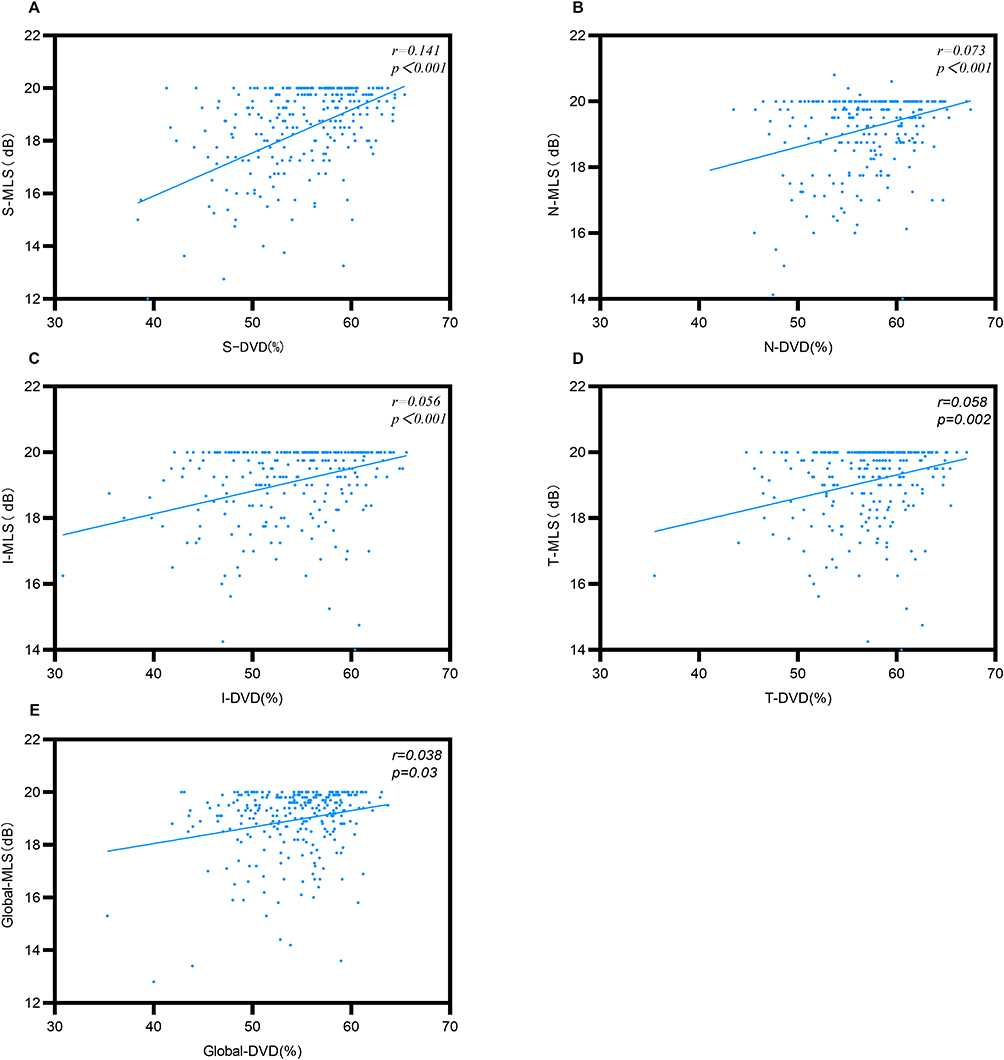 |
Figure 3 Average and regional measurements of the relationships between DVD and corresponding MLS across all participants. There were significant correlations in average and all regions except the fovea. (A) The DVD-MLS correlation in S region was significant in all participants. (B) The DVD-MLS correlation in N region was significant in all participants. (C) The DVD-MLS correlation in I region was significant in all participants. (D) The DVD-MLS correlation in T region was significant in all participants. (E) The DVD-MLS correlation in average was significant in all participants. p < 0.05, the difference is statistically significant. |
Linear Regression Analysis
Univariate linear regression analysis was conducted across different regions for all subjects in the three groups to evaluate the effect of independent variables—gender, age, IOP, AL, SE, RT, GCCT, SVD, and DVD—on MLS. Variables that were statistically significant (p < 0.05) in the univariate analysis were subsequently included in the multivariable linear regression analysis. To address multicollinearity, AL was incorporated into Model 1, and SE was incorporated into Model 2 when both were statistically significant in the univariate analysis.
Univariate analysis revealed that age, SE, AL, SVD, and DVD significantly impacted MLS in the pooled dataset. Multivariate linear regression analysis indicated that SE, AL, and DVD maintained significant correlations with MLS, while age and SVD lost significance after adjusting for covariates.
As summarized in Table 4, AL (β= − 0.157, CI: −0.248 ~ −0.067, p < 0.001) showed a negative correlation with MLS, while DVD (β= 0.044, CI: 0.011 ~ 0.077, p = 0.009) demonstrated a positive correlation in Model 1 (R2 = 0.089). In Model 2, SE (β= 0.078, CI: 0.036 ~ 0.120, p < 0.001) and DVD (β= 0.040, CI: 0.007 ~ 0.074, p = 0.019) were positively correlated with MLS, yielding a higher R2 value (R2 = 0.094).
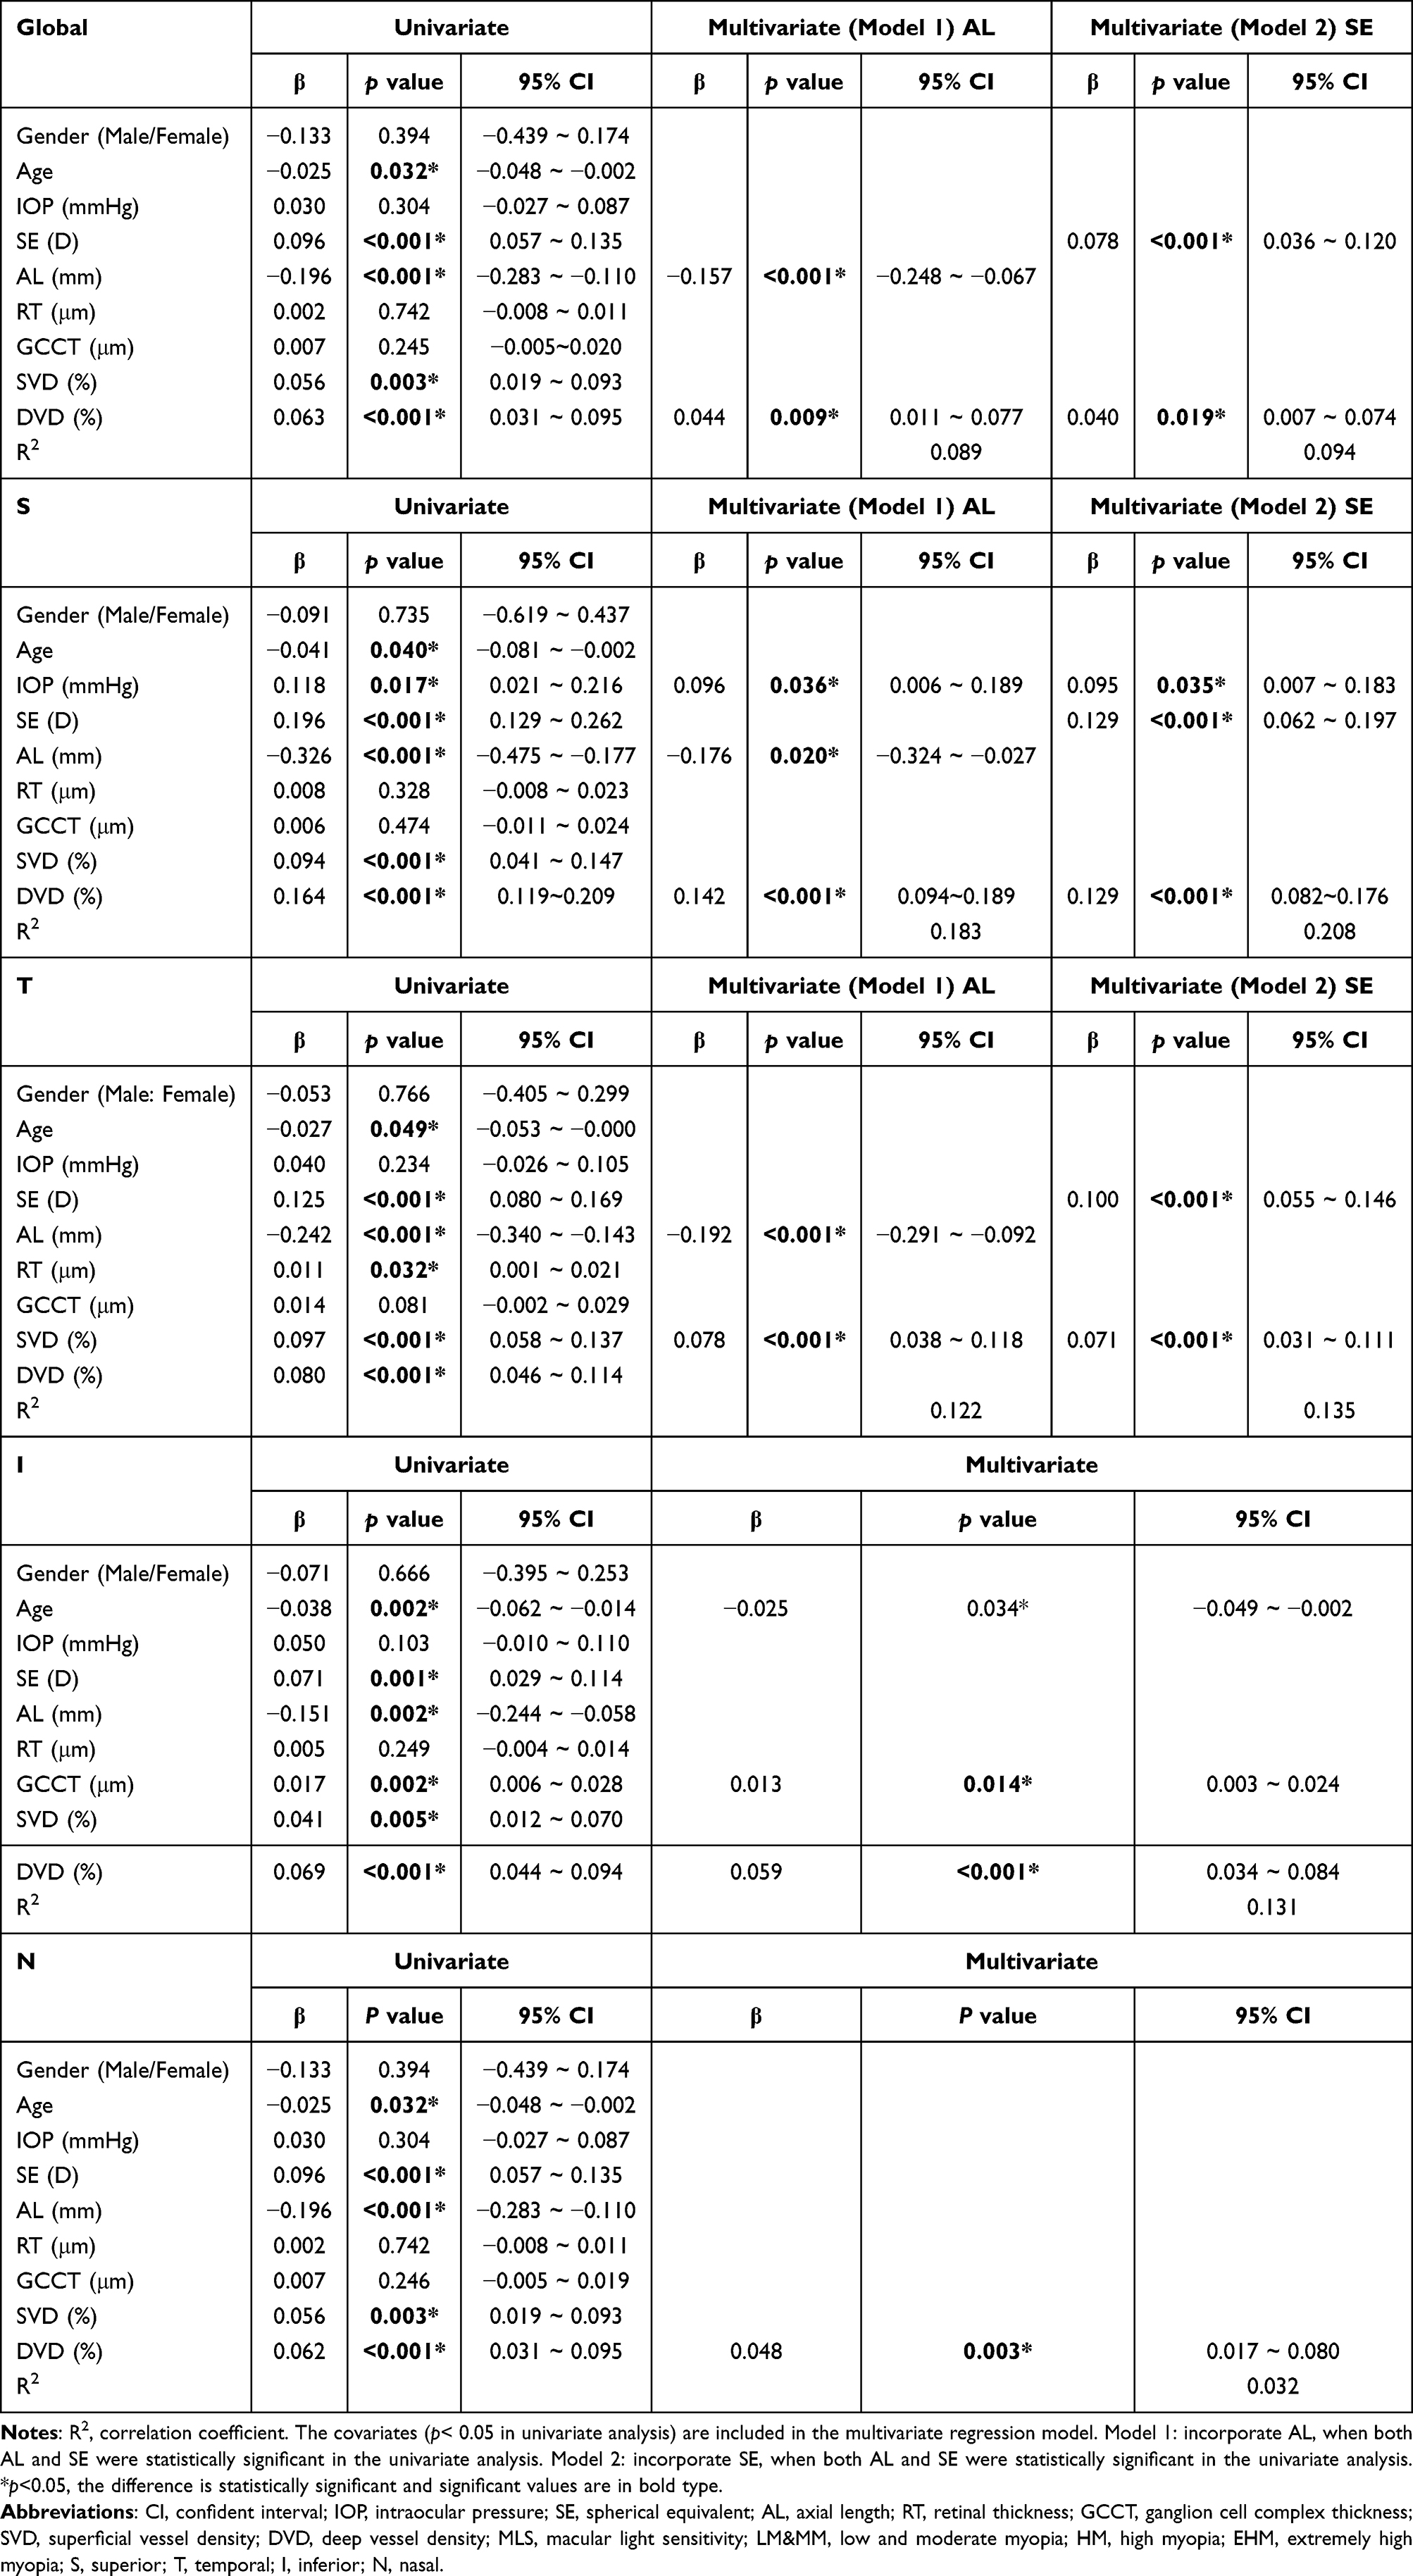 |
Table 4 Univariate and Multivariate Regression Analyses to Identify Factors Associated with the MLS Across All Participants |
The global and regional (the superior, temporal, inferior, and nasal regions) linear regression results are presented respectively in Table 4.
In the univariate analysis of superior region, age, SE, AL, SVD, DVD, and IOP significantly impacted MLS (p < 0.05). Multivariate analysis showed that IOP, SE, AL, and DVD maintained significant correlations, while age and SVD no longer had significant influence. In Model 1, AL (β= − 0.176, CI: −0.324 ~ −0.027, p = 0.02) negatively correlated with MLS, whereas DVD (β= 0.142, CI: 0.094 ~ 0.189, p < 0.001) and IOP (β= 0.096, CI: 0.006 ~ 0.189, p = 0.036) were positively correlated (R2 = 0.183). Model 2, which incorporated SE instead of AL, demonstrated positive correlations for SE (β= 0.129, CI: 0.062 ~ 0.197, p < 0.001), DVD (β= 0.129, CI: 0.082 ~ 0.176, p < 0.001), and IOP (β= 0.095, CI: 0.007 ~ 0.183, p = 0.035) with a higher R2 (R2 = 0.208).
As for temporal region, in univariate analysis, SE, AL, SVD, RT, and age significantly influenced MLS. However, multivariate analysis retained only SE, AL, and DVD as significant contributors. In Model 1, AL (β= − 0.192, CI: −0.291 ~ −0.092, p < 0.001) negatively correlated with MLS, while SVD (β= 0.078, CI: 0.038 ~ 0.118, p < 0.001) positively correlated (R2 = 0.122). Model 2 demonstrated positive correlations for SE (β=0.100, CI: 0.055 ~ 0.146, p < 0.001) and SVD (β= 0.071, CI: 0.031 ~ 0.111, p < 0.001) with a slightly higher R2 (R2 = 0.135).
In the inferior region, while univariate analysis identified SE, AL, SVD, and DVD as significant variables, multivariate regression retained only DVD and GCCT as positive correlates of MLS and age as a negative correlate.
In the nasal region, univariate analysis identified age, AL, SE, SVD, and DVD as significant contributors to MLS. However, in multivariate regression, only DVD (β= 0.048, CI: 0.017 ~ 0.080, p = 0.003) maintained a positive correlation with MLS after adjusting for covariates (R2 = 0.032). The multivariate regression results across regions, along with regression equations, are illustrated in Figure 4 via scatterplots.
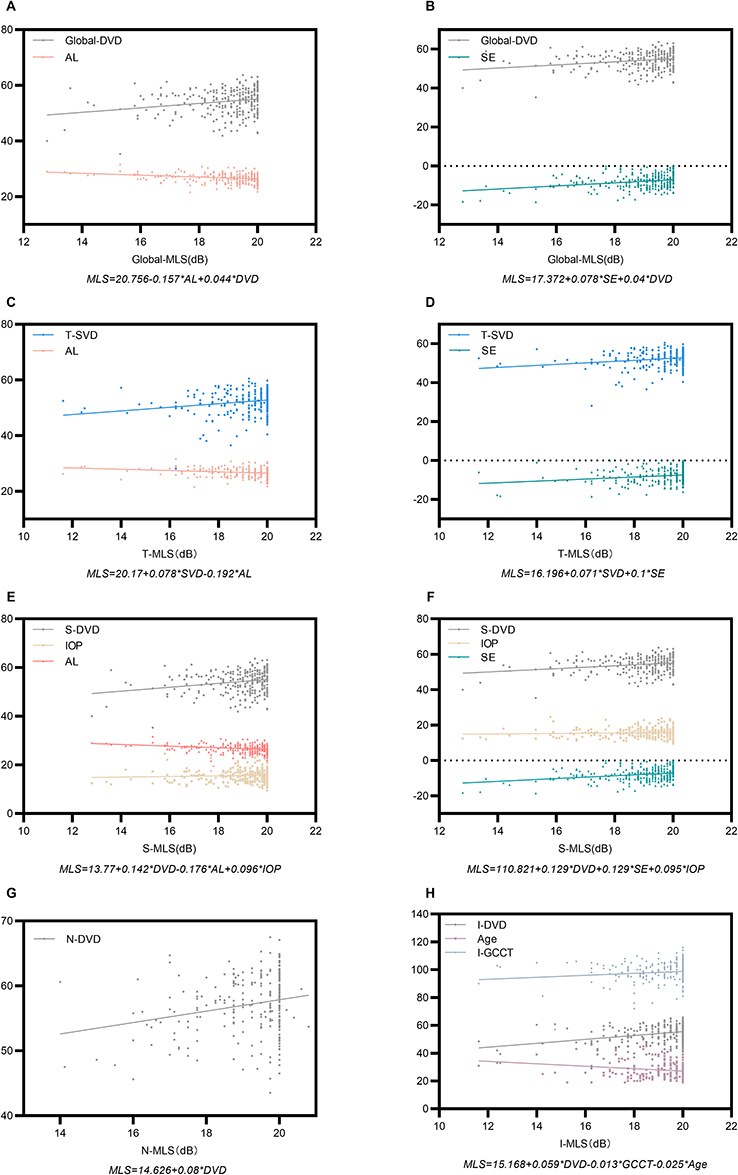 |
Figure 4 Multivariate regression analyses to identify factors associated with MLS across all participants. Results of multivariate regression analyses showed a significantly positive relationships between DVD and MLS in myopic eyes, especially in average and S, N, I regions. AL was negatively correlated with MLS, while SE was positively correlated with MLS. The relationships between SVD, age, IOP, GCCT and the MLS were not stable. The linear regression equation for every regional MLS was marked under the picture. (A) The MLS in average was positively correlated with DVD, while negatively correlated with AL in Model 1. (B) The MLS in average was positively correlated with DVD and SE in Model 2. (C) The MLS in T region was positively correlated with SVD, while negatively correlated with AL in Model 1. (D) The MLS in T region was positively correlated with SVD and SE in Model 2. (E) The MLS in S region was positively correlated with DVD and IOP, while negatively correlated with AL in Model 1. (F) The MLS in S region was positively correlated with DVD, SE and IOP in Model 2. (G) The MLS in N region was only positively correlated with DVD. (H) The MLS in I region was positively correlated with DVD and GCCT, while negatively correlated with age. |
Discussion
Key Findings
This study investigated the link between macular microvasculature and function in myopic eyes, with a focus on high and extreme myopia. We found that DVD in the macula was strongly and positively associated with retinal light sensitivity across most macular regions, particularly in highly and extremely myopic eyes. In contrast, SVD, RT, GCCT showed weaker and less consistent correlations with MLS. Multivariate analyses confirmed that DVD was an independent predictor of regional MLS, whereas SVD, RT, and GCCT did not retain significance after accounting for other factors. These findings suggest that deep retinal microvascular integrity is a key determinant of macular function in myopia, beyond the effects of retinal thinning or refractive error alone.
Interpretation of Results
Our study found that Group HM and Group EHM manifested thinner RT compared to Group LM&MM in average and superior, temporal and inferior regions of the parafovea within 3mm of the macula. However, in the fovea, the RT was thicker in Group HM and Group EHM. Similarly, for the changes of GCCT, we observed the decline in average and regional sectors except for the foveal region as the degree of myopia increased. This observation aligns with the hypothesis that the central retina may be relatively protected against the stretching forces that accompany globe expansion, which are assumed to underlie peripheral retinal thinning in myopia. The pathogenesis of thicker central foveal RT and GCCT associated with refractive error has not yet been clearly established, however, a possible mechanism is that the increase in axial length of myopic eyes causes mechanical stretching of the sclera in the posterior pole, which would cause traction of the vitreous, resulting in an increase of the foveal thickness.17 Therefore, the increase in the foveal thickness with higher myopic diopters could be an early sign of vitreoretinal traction.18
The pronounced relationship between reduced deep plexus perfusion and diminished sensitivity provides insight into the pathophysiology of myopic vision loss.
The deep capillary plexus lies in the inner retina (around the inner nuclear and outer plexiform layers) and may be particularly vulnerable to the axial stretching in myopia.19 Reduction in DVD typically indicates regional ischemia or inadequate metabolic support for retinal neurons. This impairment disrupts synaptic and photoreceptor activity, leading to localized sensitivity deficits.20 In contrast, the superficial vascular plexus primarily supplies the nerve fiber and ganglion cell layers, where moderate SVD reduction in myopia may be more readily tolerated or compensated by retinal circulation, which could explain why SVD was not significantly correlated with MLS in our study.
Retinal thinning and GCC loss are well-documented in myopia, but their direct impact on function appears secondary to vascular factors. We observed that although greater RT or GCCT sometimes correlated with higher sensitivity in univariate analysis, these structural metrics were not independent predictors when vascular density and axial length were considered. One possible explanation is that retinal thickness alone cannot guarantee sufficient perfusion; a thinned retina with relatively intact deep vasculature may retain function, while even a normal-thickness retina with compromised perfusion could show sensitivity loss. This aligns with evidence that deep plexus attenuation in myopia is associated with outer retinal alterations and visual dysfunction.7 In essence, our results suggest that microvascular health of the deep vascular plexus plays a more pivotal role than overall anatomical thickness in maintaining macular function in myopic eyes.
Comparison with Previous Studies
Our findings corroborate and extend those of earlier studies examining structure-function relationships in myopia. Tsui et al13 first reported that macular vessel density correlates positively with microperimetric sensitivity in myopic eyes. Consistent with our results, they found that DVD (rather than SVD) was associated with sensitivity in high myopia, and that eyes with lower DVD had worse light sensitivity. They also observed a contribution of retinal thickness (RT) to sensitivity.
In our study, RT showed only limited correlations, which may reflect differences in participant profiles. By including extremely high myopes, who often have universally thin retinas, we found perfusion to be the more distinguishing factor for functional integrity. This extends the findings of previous work by demonstrating that this relationship is not only present but may be particularly critical in the EHM subgroups, even in the absence of classic pathological features. Notably, our regional multivariate analysis demonstrated that DVD predicts sensitivity in nearly all macular sectors (except the T and fovea region) even after controlling for axial length and other covariates, reinforcing the generality of this structure-function link. This regional approach builds on Tsui et al’s sector-based correlations by providing a more robust mapping of functional risk areas.
Previous studies have consistently demonstrated reduced macular vessel density in high myopia.21,22 Extending these structural observations, our study crucially links the vascular changes to functional outcomes. The superficial plexus findings in the literature have been somewhat inconsistent: some authors report superficial flow reductions in high myopia,7,23 while others find superficial density relatively preserved unless pathological myopic degeneration is present.24 Our observation that SVD had little influence on microperimetry aligns with the notion that mild superficial vessel loss may not translate into detectable functional loss in the absence of advanced disease. In contrast, there is strong consensus that deep capillary plexus (DCP) deficits are pronounced in high myopia and likely contribute to retinal dysfunction. Ye et al25 reported that DCP density is significantly reduced in pathological myopia and correlates with outer retinal disruption and poorer visual acuity, underscoring that deep retinal circulation is critical for sustaining photoreceptors and vision when the eye is highly elongated.
Our findings also resonate with a very recent multimodal imaging study by Liang et al.26 Using adaptive optics, OCT, OCTA, and microperimetry, Liang et al identified deep capillary plexus (DCP) hypoperfusion as a key factor in macular dysfunction in high myopia. This is in excellent agreement with our results, reinforcing that the DCP is a pivotal indicator of functional health in myopic eyes. Our study adds further evidence by specifically highlighting this relationship in eyes beyond −10 D (extreme myopia), a group that Liang et al did not isolate. By focusing on extreme myopes without overt fundus pathology, we fill a knowledge gap: even before classic myopic maculopathy sets in, microvascular attenuation in the deep retina can flag functional decline.
In comparing structural metrics, prior work has shown that thinning of the retina and ganglion cell layer in myopia can relate to function, but with variability. Tsui et al13 observed regional retinal thickness-sensitivity correlations in moderate and high myopes, and others have reported that ganglion cell complex thickness correlates with visual field or perimetric outcomes in myopia.27 However, those studies also noted that thickness alone explains only part of the variance in function. Our multivariate findings suggest that once DVD is accounted for MLS, RT or GCCT provide little additional predictive value. It is possible that RT/GCC thinning and reduced perfusion occur together during axial elongation, but perfusion more directly impacts neuronal function. Indeed, in vivo analyses in highly myopic eyes indicate that intact retinal microstructure, like continuous photoreceptor layers, is necessary but not sufficient for normal sensitivity, sufficient blood supply must also be present.28 Park et al29 underscores that retinal sensitivity is critically dependent on perfusion, even in structurally intact regions. Thus, structure and circulation are both vital, our study suggests that early in the myopic continuum, measuring the circulation (DVD) may be the more sensitive way to gauge subtle functional compromise that thickness alone does not reveal.
Our methodology and results also advance the field by leveraging non-invasive OCTA alongside microperimetry for regional structure-function mapping. Previous studies have often examined global or quadrant averages, here we performed a point-to-point sectoral analysis within the central 10° field. This approach, similar to that of Tsui et al but applied to extremely myopic eyes, strengthens causal inferences by showing the correspondence of local perfusion deficits with localized sensitivity loss. It also underscores the reproducibility of the OCTA-microperimetry relationship: despite different populations and devices (we used MP-1 microperimetry vs MAIA), the deep vasculature’s role in macular function consistently emerges. By integrating these modalities, our study design offers a framework for future research and for potentially improving clinical assessments of myopic patients.
Significance and Clinical Implications
The demonstrated link between deep retinal vessel density and macular function has significant academic and clinical implications. Academically, it highlights DVD as a quantifiable biomarker that bridges anatomical changes and functional outcomes in myopia. This furthers our understanding of myopic degeneration: even in eyes without overt lesions, microvascular insufficiency in DCP may herald functional impairment. Clinically, our findings suggest that OCTA, an objective, rapid, and non-invasive imaging tool, could be harnessed to screen myopic patients for early functional decline.
Currently, macular function in myopia is most directly assessed by microperimetry or multifocal ERG, but these tests are time-consuming and require considerable patient cooperation. In contrast, a macular OCTA scan takes only seconds and does not rely on patient responses. If reduced macular DVD is observed in a myopic eye, our results indicate it is likely that the patient’s retinal sensitivity is already suboptimal in those regions, even if visual acuity remains 0 logMAR. This could enable a proactive approach: clinicians might identify high-risk high myopes (eg an extreme myope with significantly low parafoveal DVD) and counsel more aggressive myopia control or closer follow-up to preserve vision.
Importantly, such use of OCTA would allow regional functional deficits to be detected before they manifest as noticeable vision loss. Indeed, microperimetry has shown that macular function can decline in myopic eyes prior to obvious fundus changes.30 During routine OCT imaging, a rapid macular OCTA scan can be simultaneously acquired. A significantly low DVD value would objectively identify eyes with likely subclinical functional impairment, prompting two key actions: (1) initiating more frequent monitoring and (2) reinforcing the importance of myopia control, thereby personalizing management based on vascular health before vision loss is apparent.
Additionally, our findings underscore the value of mapping where in the macula function is most threatened in myopia. For example, we noted DVD was most strongly linked to sensitivity in nasal, inferior, and superior inner macular regions (with temporal and fovea regions somewhat less affected). This pattern might reflect the distribution of stress from axial elongation. Identifying such patterns could help clinicians pay special attention to certain retinal subfields in high myopes. It also suggests a hypothesis for future testing: are some macular regions more resilient due to better collateral circulation or choroidal support? Overall, the ability to perform regional functional-structural correlation in vivo, as we have done, is a step forward for personalized ocular monitoring in myopia.
Limitations and Future Directions
We acknowledge several limitations in our study. First, the design was cross-sectional, capturing a single time-point in each eye. While we established associations between DVD and function, we cannot confirm causality or the direction of change. Longitudinal studies are needed to determine if reduced DVD precedes and predicts subsequent sensitivity loss.
Second, our sample included only myopic eyes without evident macular pathology. While this homogeneity was intentional to study early changes, it limits generalizability.
Moreover, our study did not evaluate the choriocapillaris and choroidal vasculature. Given the crucial role of the choroid in nourishing the outer retina and the known choroidal thinning in myopia, the omission of choriocapillaris data is a limitation. Future studies incorporating enhanced-depth imaging OCTA or other techniques to assess the choriocapillaris are needed to provide a more complete picture of the vascular contributions to functional deficits in high myopia.
The relationships we found may not hold once pathological myopic degeneration sets in. In advanced myopia with macular atrophy, the dominant factors reducing sensitivity are the atrophic lesions and RPE-photoreceptor loss.31 In such cases, OCTA might underrepresent choroidal circulation loss or may be confounded by OCT signal attenuation over areas of atrophy. Future studies should examine how the addition of early pathological changes (for example, subtle RPE disruption or tessellation) affects the perfusion-function link.
Another limitation is that we only analyzed one eye per participant. Although this avoids statistical interdependence of two eyes from the same person, it potentially discards information and could introduce selection bias if the chosen eye had systematically better or worse metrics. We attempted to mitigate bias by selecting the eye randomly when both met inclusion criteria. In practice, both eyes of an individual with high myopia often share similar refractive and axial characteristics, but subtle asymmetries do occur. A future study could include both eyes and use hierarchical models to account for inter-eye correlation, allowing us to explore whether asymmetry in DVD corresponds to asymmetry in functional outcomes for a given patient.
Technical considerations of OCTA and microperimetry also apply. OCTA can be prone to segmentation errors and projection artifacts, especially in highly myopic eyes with posterior staphyloma or tilted discs. We rigorously quality-controlled the images and used software auto-focus adjustments to account for axial length differences, but minor errors in layer segmentation could affect measured vessel densities. In extremely elongated eyes, the projected scan area may differ slightly from actual retinal area despite magnification correction, which could influence absolute VD values.
In summary, despite these limitations, our study provides a clearer picture of how microvascular changes relate to visual function in myopia, and it paves the way for several future investigations.
Conclusion
In conclusion, this study demonstrates that macular DVD is a sensitive indicator of regional visual function in myopic eyes, particularly in high and extreme myopia. Eyes with better-preserved DVD maintained higher light sensitivities, whereas superficial vascular metrics and retinal thickness were less predictive of function. These findings strengthen the concept that microvascular integrity underlies retinal health in myopia, even before overt degeneration occurs. The use of OCTA to non-invasively map perfusion offers a valuable tool for early detection and monitoring of at-risk myopic eyes in a quick and objective manner. Clinically, adopting OCTA alongside routine exams could enable timely interventions to preserve vision, addressing a growing public health challenge as myopia prevalence rises.
Abbreviations
OCT, optical coherence tomography; OCTA, optical coherence tomography angiography; ERG, electroretinography; MLS, macular light sensitivity; MVD, macular vessel density; SE, spherical equivalent; BCVA, best corrected visual acuity; VF, visual field; LASIK, laser-assisted in situ keratomileusis; LM&MM, low and moderate myopia; HM, high myopia; EHM, extremely high myopia; IOP, intraocular pressure; CCT, central corneal thickness; SSADA, split-spectrum amplitude-decorrelation angiography; ILM, internal limiting membrane; IPL, inner plexiform layer; OPL, outer plexiform layer; VD, vessel density; SVD, superficial vessel density; DVD, deep vessel density; DCP, deep capillary plexus; GCCT, ganglion cell complex thickness; AL, axial length.
Data Sharing Statement
The data sets used and/or analyzed during the current study available from both corresponding authors (Hua Zhong and Qin Chen) on reasonable request.
Ethics Approval and Informed Consent
Ethical approval was obtained from the ethics committee of the First Affiliated Hospital of Nanjing Medical University (2020-SR-339). The study adhered to the principles of the Declaration of Helsinki and written informed consent was obtained from each participant.
Acknowledgments
The authors thank the First Affiliated Hospital with Nanjing Medical University and the First Affiliated Hospital of Kunming Medical University for data collection.
Author Contributions
All authors made a significant contribution to the work reported, whether that is in the conception, study design, execution, acquisition of data, analysis and interpretation, or in all these areas; took part in drafting, revising or critically reviewing the article; gave final approval of the version to be published; have agreed on the journal to which the article has been submitted; and agree to be accountable for all aspects of the work.
Funding
This work was supported by the National Natural Science Foundation of China (Qin Chen: Grant No. 81970800, Hua Zhong: Grant No. 82360212) and “Top Talents Project” of the First Affiliated Hospital with Nanjing Medical University (Qin Chen).
Disclosure
The authors have no financial or other conflicts of interest concerning this study.
References
1. Morgan IG, Ohno-Matsui K, Saw SM. Myopia. Lancet. 2012;379(9827):1739–1748. doi:10.1016/s0140-6736(12)60272-4
2. Wong TY, Ferreira A, Hughes R, Carter G, Mitchell P. Epidemiology and disease burden of pathologic myopia and myopic choroidal neovascularization: an evidence-based systematic review. Am J Ophthalmol. 2014;157(1):9–25.e12. doi:10.1016/j.ajo.2013.08.010
3. Lee MW, Lee SE, Lim HB, Kim JY. Longitudinal changes in axial length in high myopia: a 4-year prospective study. Br J Ophthalmol. 2020;104(5):600–603. doi:10.1136/bjophthalmol-2019-314619
4. Baird PN, Saw SM, Lanca C, et al. Myopia. Nat Rev Dis Primers. 2020;6(1):99. doi:10.1038/s41572-020-00231-4
5. Ng DS, Cheung CY, Luk FO, et al. Advances of optical coherence tomography in myopia and pathologic myopia. Eye. 2016;30(7):901–916. doi:10.1038/eye.2016.47
6. Read SA, Alonso-Caneiro D, Vincent SJ. Longitudinal changes in macular retinal layer thickness in pediatric populations: myopic vs non-myopic eyes. PLoS One. 2017;12(6):e0180462. doi:10.1371/journal.pone.0180462
7. Al-Sheikh M, Phasukkijwatana N, Dolz-Marco R, et al. Quantitative OCT angiography of the retinal microvasculature and the choriocapillaris in myopic eyes. Invest Ophthalmol Vis Sci. 2017;58(4):2063–2069. doi:10.1167/iovs.16-21289
8. Fan H, Chen HY, Ma HJ, et al. Reduced macular vascular density in myopic eyes. Chin Med J. 2017;130(4):445–451. doi:10.4103/0366-6999.199844
9. Venkatesh R, Sinha S, Gangadharaiah D, et al. Retinal structural-vascular-functional relationship using optical coherence tomography and optical coherence tomography - angiography in myopia. Eye Vis. 2019;6:8. doi:10.1186/s40662-019-0133-6
10. Moskowitz A, Hansen R, Fulton A. Early ametropia and rod photoreceptor function in retinopathy of prematurity. Optom Vis Sci. 2005;82(4):307–317. doi:10.1097/01.opx.0000159367.23221.2d
11. Ratra V, Ratra D, Gupta M, Vaitheeswaran K. Comparison between humphrey field analyzer and micro perimeter 1 in normal and glaucoma subjects. Oman J Ophthalmol. 2012;5(2):97–102. doi:10.4103/0974-620x.99372
12. Pfau M, Jolly JK, Wu Z, et al. Fundus-controlled perimetry (microperimetry): application as outcome measure in clinical trials. Prog Retin Eye Res. 2021;82:100907. doi:10.1016/j.preteyeres.2020.100907
13. Tsui CK, Yang B, Yu S, et al. The relationship between macular vessel density and thickness with light sensitivity in myopic eyes. Curr Eye Res. 2019;44(10):1104–1111. doi:10.1080/02713683.2019.1627461
14. Han W, Yap MK, Wang J, Yip SP. Family-based association analysis of hepatocyte growth factor (HGF) gene polymorphisms in high myopia. Invest Ophthalmol Vis Sci. 2006;47(6):2291–2299. doi:10.1167/iovs.05-1344
15. Harb E, Hyman L, Fazzari M, Gwiazda J, Marsh-Tootle W. Factors associated with macular thickness in the COMET myopic cohort. Optom Vis Sci. 2012;89(5):620–631. doi:10.1097/OPX.0b013e318251293a
16. Harb E, Hyman L, Gwiazda J, et al. Choroidal thickness profiles in myopic eyes of young adults in the correction of myopia evaluation trial cohort. Am J Ophthalmol. 2015;160(1):62–71.e2. doi:10.1016/j.ajo.2015.04.018
17. Dubis AM, McAllister JT, Carroll J. Reconstructing foveal pit morphology from optical coherence tomography imaging. Br J Ophthalmol. 2009;93(9):1223–1227. doi:10.1136/bjo.2008.150110
18. Chen S, Wang B, Dong N, Ren X, Zhang T, Xiao L. Macular measurements using spectral-domain optical coherence tomography in Chinese myopic children. Invest Ophthalmol Vis Sci. 2014;55(11):7410–7416. doi:10.1167/iovs.14-13894
19. Scarinci F, Jampol LM, Linsenmeier RA, Fawzi AA. Association of diabetic macular nonperfusion with outer retinal disruption on optical coherence tomography. JAMA Ophthalmol. 2015;133(9):1036–1044. doi:10.1001/jamaophthalmol.2015.2183
20. Selvam S, Kumar T, Fruttiger M. Retinal vasculature development in health and disease. Prog Retin Eye Res. 2018;63:1–19. doi:10.1016/j.preteyeres.2017.11.001
21. Wang T, Li H, Zhang R, Yu Y, Xiao X, Wu C. Evaluation of retinal vascular density and related factors in youth myopia without maculopathy using OCTA. Sci Rep. 2021;11(1):15361. doi:10.1038/s41598-021-94909-8
22. Veselinović M, Trenkić M, Čanadanović V, et al. The significance of OCTA in studying vessel density and retinal thickness in individuals with myopia. Medicina. 2025;61(3):532. doi:10.3390/medicina61030532
23. Su L, Ji YS, Tong N, et al. Quantitative assessment of the retinal microvasculature and choriocapillaris in myopic patients using swept-source optical coherence tomography angiography. Graefes Arch Clin Exp Ophthalmol. 2020;258(6):1173–1180. doi:10.1007/s00417-020-04639-2
24. Nam KY, Lee MW, Lee KH, Kim JY. Superficial capillary plexus vessel density/deep capillary plexus vessel density ratio in healthy eyes. BMC Ophthalmol. 2022;22(1):482. doi:10.1186/s12886-022-02673-8
25. Ye J, Wang M, Shen M, et al. Deep retinal capillary plexus decreasing correlated with the outer retinal layer alteration and visual acuity impairment in pathological myopia. Invest Ophthalmol Vis Sci. 2020;61(4):45. doi:10.1167/iovs.61.4.45
26. Liang J, Fang D, Diao Y, et al. Photoreceptor cone loss is associated with decreased deep retinal vessel density and impaired retinal sensitivity in high myopia. Br J Ophthalmol. 2025;109(10):1194–1200. doi:10.1136/bjo-2024-326609
27. Moghadas Sharif N, Shoeibi N, Ehsaei A, Atchison D. Structure versus function in high myopia using optical coherence tomography and automated perimetry. Clin Exp Optom. 2019;102(3):335–340. doi:10.1111/cxo.12836
28. Zhao M, Lam AK, Ying MT, Cheong AM. Hemodynamic and morphological changes of the central retinal artery in myopic eyes. Sci Rep. 2022;12(1):7104. doi:10.1038/s41598-022-11087-x
29. Park UC, Yoon CK, Bae K, Lee EK. Association of retinal sensitivity with optical coherence tomography microstructure in highly myopic patients. Invest Ophthalmol Vis Sci. 2022;63(11):13. doi:10.1167/iovs.63.11.13
30. da Silva FBB, Silva LCP, Cunha LP, et al. Relationship between automated choroidal thickness measurements and retinal sensitivity using microperimetry in patients with myopia and different stages of myopic maculopathy. Int J Retina Vitreous. 2024;10(1):26. doi:10.1186/s40942-024-00541-9
31. da Cruz L, Chen FK, Ahmado A, Greenwood J, Coffey P. RPE transplantation and its role in retinal disease. Prog Retin Eye Res. 2007;26(6):598–635. doi:10.1016/j.preteyeres.2007.07.001
 © 2025 The Author(s). This work is published and licensed by Dove Medical Press Limited. The
full terms of this license are available at https://www.dovepress.com/terms
and incorporate the Creative Commons Attribution
- Non Commercial (unported, 4.0) License.
By accessing the work you hereby accept the Terms. Non-commercial uses of the work are permitted
without any further permission from Dove Medical Press Limited, provided the work is properly
attributed. For permission for commercial use of this work, please see paragraphs 4.2 and 5 of our Terms.
© 2025 The Author(s). This work is published and licensed by Dove Medical Press Limited. The
full terms of this license are available at https://www.dovepress.com/terms
and incorporate the Creative Commons Attribution
- Non Commercial (unported, 4.0) License.
By accessing the work you hereby accept the Terms. Non-commercial uses of the work are permitted
without any further permission from Dove Medical Press Limited, provided the work is properly
attributed. For permission for commercial use of this work, please see paragraphs 4.2 and 5 of our Terms.