Back to Journals » Journal of Blood Medicine » Volume 7
Study of knowledge and attitude among college-going students toward voluntary blood donation from north India
Authors Mishra SK ![]() , Sachdev S
, Sachdev S ![]() , Marwaha N, Avasthi A
, Marwaha N, Avasthi A
Received 24 June 2015
Accepted for publication 5 January 2016
Published 16 March 2016 Volume 2016:7 Pages 19—26
DOI https://doi.org/10.2147/JBM.S91088
Checked for plagiarism Yes
Review by Single anonymous peer review
Peer reviewer comments 2
Editor who approved publication: Dr Martin H Bluth
Video abstract presented by author Suchet Sachdev
Views: 740
Shailesh Kumar Mishra,1 Suchet Sachdev,1 Neelam Marwaha,1 Ajit Avasthi2
1Department of Transfusion Medicine, 2Department of Psychiatry, Postgraduate Institute of Medical Education and Research, Chandigarh, India
Introduction: The study was conducted to assess the knowledge and attitude of college-going students toward voluntary blood donation and to bring out and compare the reasons for donating or not donating blood.
Materials and methods: This cross-sectional study was conducted on 1,000 college-going students after taking their consent for participation using a prevalidated, self-administered, structured questionnaire after its content and construct validation.
Results: The difference in the means of the level of knowledge among the donor (mean: 14.71±2.48) and nondonor students (mean: 11.55±2.82) was statistically significant. There was significant impact of previous blood donation on the level of knowledge in donor students. The attitude toward blood donation was more positive among blood donor as compared to nondonor students, and the difference in their means was statistically significant. About one in two (45.8%) college-going students fear that either they are not fit enough to donate blood (26.8%) or that they will become weak (19%) after blood donation. Almost one in four (27.4%) have fear of needle pain; therefore, they do not come forward for blood donation.
Interpretation and conclusion: The most significant reason hindering blood donation comes out to be related to health of the individual donor. The findings of this study conclude that the national targets of voluntary blood donation could be better met with specific blood donor information, education, motivation, and recruitment strategies focusing on the myths and misconceptions prevalent in the donor demographic area of that particular region, specifically targeting high-school children in countries developing a volunteer donor base.
Keywords: knowledge, attitude, voluntary blood donation
Introduction
The foundation of a health care system rests on a backbone of a well-organized blood transfusion services (BTS), which in turn is anchored on the availability of human blood volunteers. BTS involve the application of scientific technology on the societal mobilization of the precious human resource in the form of voluntary blood donation (VBD).1 Blood transfusion has been recognized as one of the eight key life-saving interventions in health-care facilities.2 Blood services are facing shortage of blood all over the world. Demand for blood is rising day by day, and current blood donation is insufficient to meet the demand.3 Evidence-based strategies for provision of safe and adequate blood supply have been successfully implemented in developed countries. Developing and transitional countries are making efforts toward this goal by utilizing the time-tested approach based on surveys carried out to identify knowledge, attitude, and practice (KAP) on the subject of blood donation.2 Objective eight of the National Blood Policy (NBP) advocates KAP studies to obtain factual information through operational research on blood donation with the aim of achieving the first objective of the NBP, the government’s commitment to provide safe and adequate quantity of blood.4 The World Health Organization has categorized India as having less than 10 blood donations per 1,000 population, with voluntary collection of 50%–89.9% of the total blood collection.2 There was a shortfall of 2.73 million units of blood collection in India, against the set target of 10 million units under the National AIDS Control Programme-III as per the annual report of 2010–2011.5 In a review of KAP studies in developing countries, the authors concluded that KAP studies provide information on strategies that can be formulated to sustain VBD.6 The authors further observed that despite differences in these studies with regard to the approach adopted, sampled population, demography, etc, it was noted that misinformation about blood donation, fear of blood donation, concern about selling blood, and despite the potentially positive effect of altruism, willingness to donate for family and friends, there existed a failure to transform positive attitudes into donations.6
This study was done to understand and generate evidence to improve VBD in the region’s demography. The college-going students were aimed at for conducting the survey, because they represent the potential blood donor population pool of tomorrow for the entire nation.
The study was designed to assess college-going students’ knowledge regarding voluntary, nonremunerated blood donation, to assess the attitudes of the college-going students regarding voluntary, nonremunerated blood donation, and to find out and compare the reasons for donating blood or not donating blood in college-going students.
Materials and methods
Study design
The cross-sectional study was conducted by the Department of Transfusion Medicine, Postgraduate Institute of Medical Education and Research, Chandigarh, India, from March to September 2013 at the colleges where VBD camps are conducted after obtaining approval from the ethics committee of the Postgraduate Institute of Medical and Research, Chandigarh. This department in this region is one of the pioneers in the field of VBD since 1963. Volunteer blood is collected at the blood donation camps organized by the National Service Scheme units of the motivated colleges on mutually convenient dates obtained from the department annually for the last several years. All technical support is provided by the staff posted for the blood donation camp by the department and the students of colleges volunteer for blood donation.
Sample size
For this pilot study, the data were collected from 1,000 students of nine colleges from Chandigarh and adjoining areas of Punjab. Five hundred blood donor students and 500 nondonor students at the camp venue who consented to enroll for the study after being explained the nature and purpose of the study were enrolled after taking written informed consent and were given the prevalidated self-administered structured questionnaire.
Sampling technique
The selection of study participants was voluntary and nonrandom (convenience sampling).
Study population
The questionnaire was offered to the students of colleges selected for blood donation at blood donation camps who consented to participate in the study after being selected for blood donation, irrespective of whether they had donated blood earlier or this was the first attempt to donate (donor students). The other college students who consented to participate but not to donate blood at the present venue and had never donated blood previously were enrolled after taking written informed consent (nondonor students).
Study tool: self-administered structured questionnaire
The questionnaire was designed by the authors after going through various parameters that were included in similar studies and the “Methodological Guidelines for Socio-Cultural Studies on Issues Related to Blood Donation”.1 The questionnaire was adapted for usage in our population, and care was taken to include questions to include knowledge pertaining to use of collected blood, typing of blood, testing on donated blood, age and general requirements for blood donation, amount of blood collected, frequency of blood donation, and eligibility to donate blood. The first section of the questionnaire incorporated 25 questions that assessed the knowledge level among the participants, and thus the maximum score that one participant could score in this section was 25 and the minimum score 0, since 1 mark was awarded for each correct answer, and a 0 for a wrong answer or a nonattempt. No negative marking was done. The second section assessed the attitude and consisted of 12 questions that were analyzed as percentage of participants with a particular response. It included six positive items and six negative items, which were graded on a three-point Likert’s scale. The third section assessed the reasons why people did not come forward to donate blood. The fourth section assessed the reasons that people come forward and donated blood. The questionnaire was distributed among ten Doctors from the Departments of Transfusion Medicine and Psychiatry, and clinical prescriber’s of blood, for the construct and content validation. The changes recommended were incorporated as far as possible for the construct and content validation of the questionnaire. Then the questionnaire was tested on ten college-going students as a pilot pretest validation among students of Punjab Engineering College, Chandigarh, India.
Data collection
The questionnaire was distributed in a separately demarcated area at the blood donation venue and was collected personally from the participants at Punjab Engineering College, Sector 12, Chandigarh; Government College for Girls, Sector 11, Chandigarh; Government College for Men, Sector 11, Chandigarh; DAV College, Sector 10, Chandigarh; PG Government College for Girls, Sector 42, Chandigarh; University Institute of Engineering and Technology, Sector 25, Punjab University, Chandigarh; Chandigarh University, Gharuan, Mohali; Gian Jyoti Institute of Engineering and Technology, Phase 2, Mohali; and Longowal Polytechnic College, Derabassi, Mohali, Punjab. The data collected were transferred to a master sheet for each section of the tool. Data were analyzed under following subheadings: age and sex, knowledge score, attitude, and the reasons for both donating and not donating blood in donor and nondonor students, respectively.
Statistical analysis
The statistical analysis was carried out using Statistical Package for Social Sciences (SPSS Inc., Chicago, IL, USA; version 15.0 for Windows). Scores were presented as mean ± standard deviation (SD), median, and interquartile range. Qualitative or categorical variables (eg, age and sex) were described as frequencies and proportions. Kruskal–Wallis test was applied to find if difference/variance exists between scores of donors. Then Mann–Whitney test was applied to check this for statistical significance. Comparison for donors and nondonors was done using Mann–Whitney U-test. Proportions were compared using chi-square or Fisher’s exact test as applicable. All statistical tests were two sided and were performed at a significance level of 0.05.
Results
Demography
The mean age of blood donor students was 19.80±1.31 (years) and that of nondonor students was 19.69±1.69 (years), with overall mean of 19.75±1.51 (years). Range for age in blood donors students was 18–24 (years) and in nondonor students was 18–26 (years), with overall range from 18 to 26 (years). Majority of the donors were males (75.8%), and there were only 24.2% female blood donor students, whereas among nondonor students there were 55% males and 45% females.
Knowledge on aspects related to VBD
Data presented in Table 1 depict the response by the participant blood donor and nondonor students to the knowledge-related questions. The average of correct response to the 25 questions obtained by blood donor students was 293 (58.6%), while it was 235 (47.0%) in nondonor students. The overall difference in number of correct responses to knowledge-related questions between blood donor and nondonor students was statistically significant (P=0.0002).
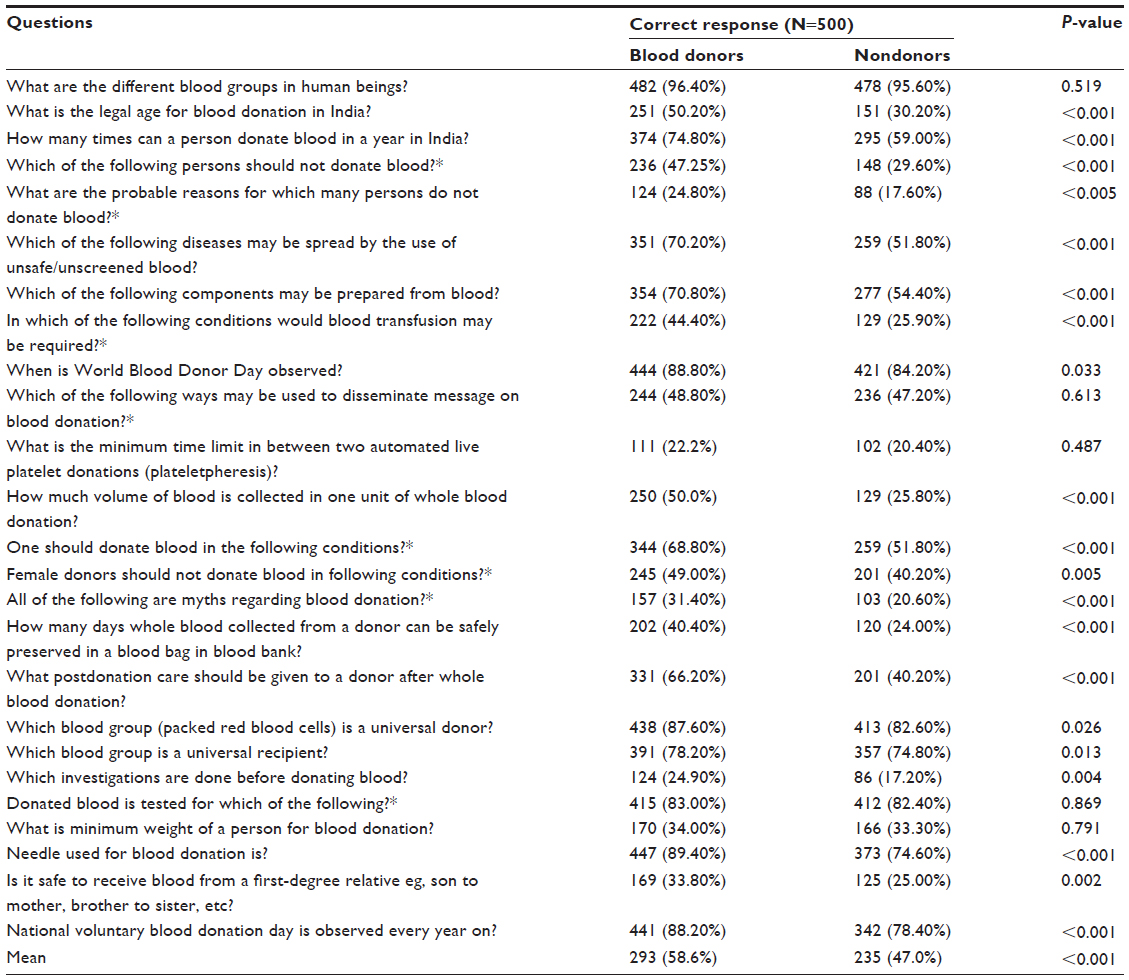 | Table 1 Responses to knowledge questions by both the donor and nondonor students |
The mean of knowledge score obtained by the blood donor students was 14.71±2.48, whereas among nondonor students it was 11.55±2.82, with a overall mean of 13.13±3.09 (Table 2). Range of scores obtained by the participants among blood donor students was 10–22, and among nondonor students was 3–16 (Figure 1). The difference in the means of knowledge score between donor and nondonor students was statistically significant (P<0.001). The association between the number of previous blood donation in donor students and the knowledge score was statistically significant (Table 3).
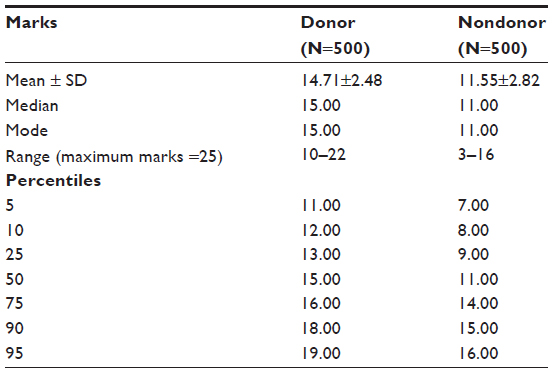 | Table 2 Knowledge score obtained by both donor and nondonor students |
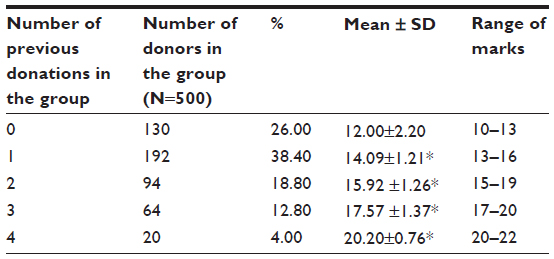 | Table 3 Number of previous donations and knowledge in donor students |
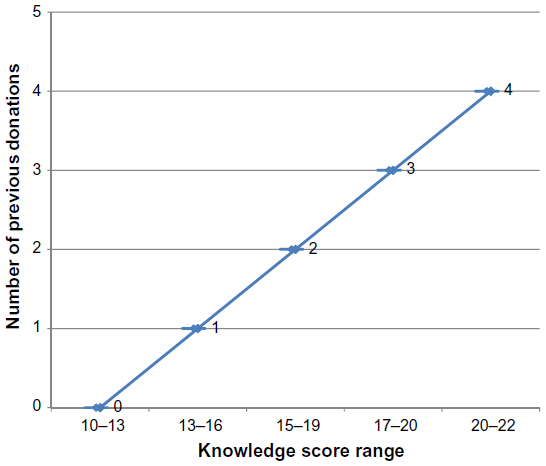 | Figure 1 Knowledge score with respect to number of previous blood donations. |
Attitude toward VBD
The data presented in Table 4 depict itemwise comparative distribution of response of students regarding attitude toward blood donation for positive and negative items. When average of all positive questions was considered, it was observed that among blood donor students 407 (81.4%) students agreed, 60 (12.0%) disagreed, and 33 (6.6%) were uncertain toward positive questions, whereas among nondonor students 360 (72.0%) students agreed, 77 (15.4%) disagreed, and 63 (12.6%) were uncertain toward positive questions (Figure 2). The difference between the mean of attitude level among blood donors and nondonors for positive items was statistically significant (P<0.05). Thus, it could be concluded that blood donor students had a more positive attitude toward blood donation as compared to nondonor students. For a similar exercise when average of all negative questions was considered, it was observed that among blood donor students only 77 (15.4%) students agreed, 60 (12.0%) were uncertain, and majority (363 [72.6%]) disagreed to negative questions, whereas among nondonor students a slightly higher number of 98 (19.6%) students agreed, 101 (20.2%) were uncertain, and a majority of 301 (60.2%) disagreed to negative questions (Figure 3). Blood donor students disagreed more on negative questions as compared to nondonor students. The difference in the mean of attitude level among blood donor and nondonor students regarding negative items was statistically significant (P<0.05). Thus, it could be concluded that blood donor students had more positive attitude toward blood donation with regard to negative items.
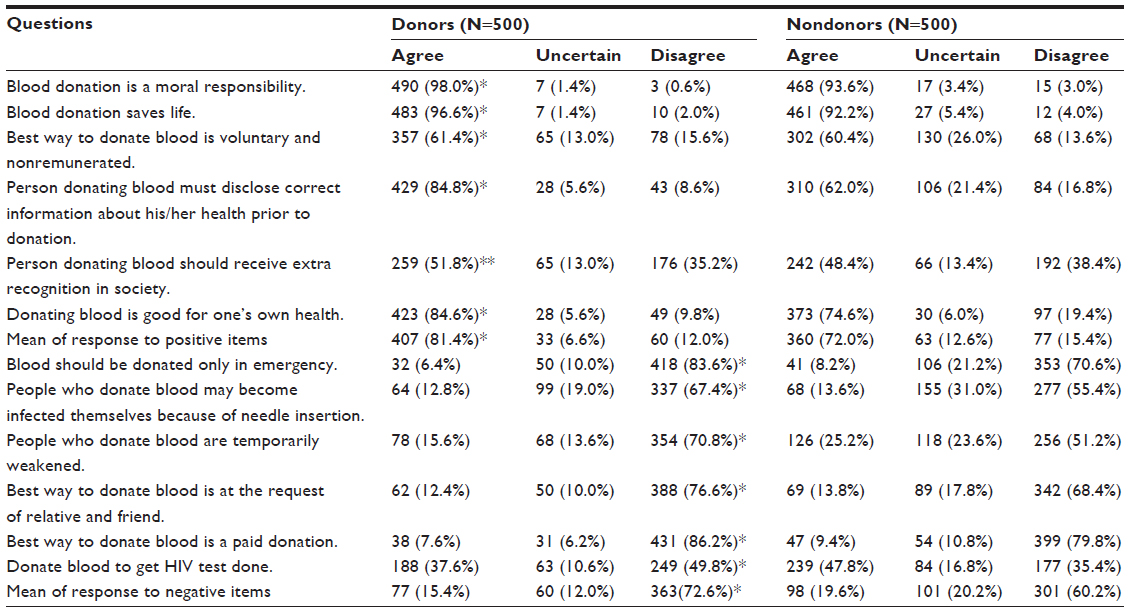 | Table 4 Response of both donor and nondonor students toward positive and negative items |
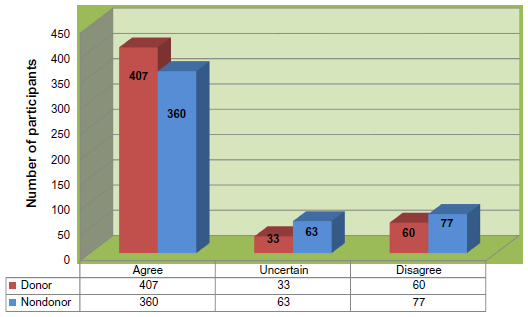 | Figure 2 Mean response of participants to positive items on blood donation. |
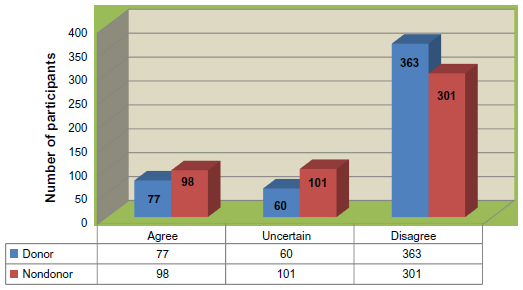 | Figure 3 Mean response of participants to negative items on blood donation. |
Reasons for donating or not donating blood
Data presented in Table 5 depict various reasons given by students for both donating and not donating blood. Majority, 371 (74.2%) students mentioned moral responsibility as a reason for their blood donation. Sixty one (12.2%) students cited altruism as their main reason for blood donation. Seventeen (3.4%) students donated blood due to peer pressure, 12 (2.4%) donated blood to lose weight, and 10 (2.0%) donated blood to know about their blood group.
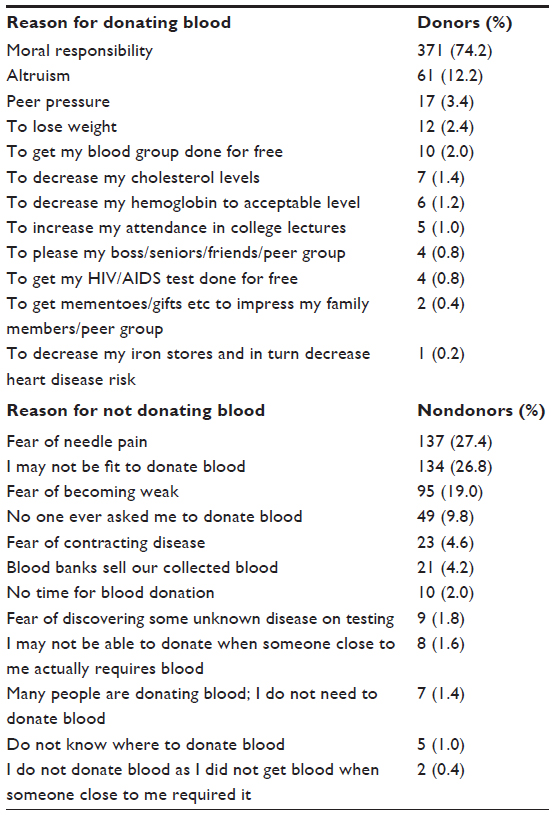 | Table 5 Reasons for both donating and not donating blood in college-going students |
While studying the reasons mentioned by students for not donating blood, 137 (27.4%) students mentioned that they had fear of needle pain because of which they do not donate blood. One hundred and thirty four (26.8%) students thought that they were not fit to donate blood. Ninety five (19%) students reported fear of becoming weak as a reason for their nondonation. Forty nine (9.8%) reported that no one ever asked them to donate blood, so they never considered donating blood.
Discussion
Assessment of the knowledge on aspects related to VBD
The finding in this study that blood donors have more knowledge on blood donation when compared to nondonors is also observed in the studies conducted at Moldova, Saudi Arabia, and China.7–9 The knowledge on legal age of blood donation and interval between two blood donations is in general lower when compared to the knowledge on uses, typing, and testing of donated blood in this study, which is similar to the observation from Moldova, the People’s Republic of China, Bangladesh, Chile, and Iran (2006, 2007).7,9,10–13 The knowledge on aspects of uses, typing, and testing of donated blood could reflect the education acquired during school or college. However, the knowledge on legal age and interval between two blood donations could reflect the efficiency of the strategies targeted to inform, educate, motivate, recruit, and retain blood donors. Therefore, sensitization to blood donation should begin at high-school level. This will help develop a culture of blood donation in the eligible donor population.
Assessment of the attitude toward VBD
Statistically significant observation in this study was that blood donor students had more positive attitude toward blood donation than nondonor students. This is in agreement with similar findings by Lownik et al in their review of studies from other developing countries.6
Reasons for donating blood
Blood donors across the studies surveyed cite either moral responsibility or altruism for donating blood. It is important to note that altruism does not come out as the main driving force for blood donation in this study. However, this may be attributable to the possibility that students could not comprehend the meaning of altruism, when given the questionnaire at the blood donation venue.
Encouragingly, the test-result-seeking behavior is very low in this study (0.8%), but this was higher in studies from from Burkina Faso (14.4%) and Brazil (45%).14,15 The desire of receiving an incentive for blood donation is also very less in this study (0.4%), whereas it was higher in the People’s Republic of China (18.4%), Moldova (23%), Trinidad and Tobago (29%), and Tanzania (36.8%).9,7,16,17
Reasons for not donating blood
Fear of needles (27.4%) was the most common reason for not donating blood brought out during this study, and this value was much higher in the People’s Republic of China (44%).9 Fear of not being fit to donate (26.8%) was the second most common reason for not donating blood brought out in this study, whereas this was lower in respondents from Lucknow in India (6.75%).18 This fear was more in respondents from Moldova (60%), the People’s Republic of China (63.2%), and Chile (64.2%).7,9,11 Fear of physical harm/weakness (19%) was the third most common reason for not donating blood brought out during this study, which was higher than observed in respondents from Lucknow (9.25%).18 This fear was even higher in respondents from Bangladesh (50%) and the People’s Republic of China (90.1%).9,10 The myth of contracting infection (HIV or other) was a lot less in this study (4.6%), whereas it was higher in respondents from Togo (31.7%), Tanzania (52.3%), Nigeria (52.4%), and Chile (73.4%).11,17,19,20 “No one ever asked us to donate blood” was reported by a lower number of respondents in this study (9.8%), whereas this was higher in respondents from Lucknow (40.7%), Moldova (40%), Saudi Arabia (42.6%), and Pakistan (51.6%).7,8,18,21 This is in agreement with the VBD movement in this region, as this was one of the regions where pioneering work on VBD was started in India.
The study supports the view that despite sociodemographic, interregional differences whether across or within the countries, there may be some common themes that could facilitate or hinder blood donation as observed by the authors of the review of KAP studies from the developing countries.6 Nevertheless, such differences in regional donor demographic reasons need to be identified by conducting KAP survey on blood donation to plan and execute blood donor recruitment.
Conclusion
The most significant finding in this study is the reasons brought out for not donating blood. The most common reason comes out to be related to health of the individual donor; almost one in two (45.8%) college-going students fear that either they are not fit enough to donate blood (26.8%) or that they will become weak (19%) after blood donation. Almost one in four (27.4%) have fear of needle pain; therefore, they do not come forward for blood donation.
The findings of this study conclude that the national targets of VBD could be better met with specific blood donor information, education, motivation, and recruitment strategies, focusing on the myths and misconceptions prevalent in the donor demographic area of that particular region, specially targeting high-school children in countries developing a volunteer donor base.
Limitations
The authors acknowledge a reciprocal temporal relationship between students with a higher knowledge on blood donation being more likely to donate and vice versa.
Disclosure
The authors report no conflicts of interest in this work.
References
Pan American Health Organization. Area of Health Technology and Services Delivery. Unit of Essential Medicines, Vaccines and Health Technologies. Methodological Guidelines for Socio-cultural Studies on Issues Related to Blood Donation. Washington, DC: PAHO; 2005. Available from: http://www.paho.org/hq/index.php?option=com_docman&task=doc_details&gid=1865&Itemid=1525. Accessed February 16, 2014. | |
World Health Organization. Universal Access to Safe Blood Transfusion. Geneva, Switzerland: WHO; 2008. Available from: http://www.who.int/bloodsafety/publications/UniversalAccesstoSafeBT.pdf. Accessed February 6, 2014. | |
Horton R. Blood supply and demand. Lancet. 2005;365(9478):2151. | |
National AIDS Control Organization, Ministry of Health and Family Welfare, Government of India, New Delhi. National Blood Policy. Available from: http://www.who.int/bloodsafety/transfusion_services/nat_blood_pol/en/index.html. Accessed May 5, 2014. | |
Department of AIDS Control, National AIDS Control Organisation, Ministry of Health and Family Welfare, Government of India. Blood Safety. Annual Report 2011–2012. Available from: http://www.nacoonline.org/upload/reports/NACO%20Annual%20report%202010-11.pdf. Accessed May 5, 2014. | |
Lownik E, Riley E, Konstenius T, Riley W, McCullough J. Knowledge, attitudes and practices surveys of blood donation in developing countries. Vox Sang. 2012;103(1):64–74. | |
United States Agency for International Development. Blood donation in Moldova: knowledge, attitudes, and practice in the general population: survey final report. Available from: http://aids.md/aids/files/342/report-cap-blood-donation-2007-en-ro.pdf. Accessed May 5, 2014. | |
Alam M, Masalmeh Bel D. Knowledge, attitudes and practices regarding blood donation among the Saudi population. Saudi Med J. 2004;25(3):318–321. | |
Zaller N, Nelson KE, Ness P, Wen G, Bai X, Shan H. Knowledge, attitude and practice survey regarding blood donation in a Northwestern Chinese city. Transfus Med. 2005;15(4):277–286. | |
Hosain GM, Anisuzzaman M, Begum A. Knowledge and attitude towards voluntary blood donation among Dhaka university students in Bangladesh. East Afr Med J. 1997;74(9):549–553. | |
Vasquez M, Ibarra P, Maldonado M. Blood donation: knowledge and attitudes of a university population in Chile. Rev Panam Salud Publica. 2007;22(5):323–328. | |
Javadzadeh Shahshahani H, Yavari MT, Attar M, Ahmadiyeh MH. Knowledge, attitude and practice study about blood donation in the urban population of Yazd, Iran, 2004. Transfus Med. 2006;16(6):403–409. | |
Javadzadeh Shahshahani H. Why don’t women volunteer to give blood? A study of knowledge, attitude and practice of women about blood donation, Yazd, Iran, 2005. Transfus Med. 2007;17(6):451–454. | |
Nebie KY, Olinger CM, Kafando E, et al. Lack of knowledge among blood donors in Burkina Faso (West Africa); potential obstacle to transfusion security. Transfus Clin Biol. 2007;14(5):446–452. | |
Goncalez TT, Sabino EC, Chen S, et al. Knowledge, attitudes and motivations among blood donors in São Paulo, Brazil. AIDS Behav. 2008;12(4 Suppl):S39–S47. | |
Sampath S, Ramsaran V, Parasram S, et al. Attitudes towards blood donation in Trinidad and Tobago. Transfus Med. 2007;17(2):83–87. | |
Jacobs B, Berege ZA. Attitudes and beliefs about blood donation among adults in Mwanza Region, Tanzania. East Afr Med J. 1995;72(6):345–348. | |
Dubey A, Sonker A, Chaurasia R, Chaudhary R. Knowledge, attitude and beliefs of people in North India regarding blood donation. Blood Transfus. 2014;(1 Suppl):S21–S27. | |
Agbovi KK, Kolou M, Fétéké L, Haudrechy D, North ML, Ségbéna AY. Knowledge, attitudes and practices about blood donation. A sociological study among the population of Lomé in Togo. Transfus Clin Biol. 2006;13(4):260265. | |
Olaiya MA, Alakija W, Ajala A, Olatunji RO. Knowledge, attitudes, beliefs and motivations towards blood donations among blood donors in Lagos, Nigeria. Transfus Med. 2004;14(1):13–17. | |
Gilani I, Kayani ZA, Atique M. Knowledge, attitude and practices (KAP) regarding blood donation prevalent in medical and paramedical personnel. J Coll Physicians Surg Pak. 2007;17(8):473–476. |
 © 2016 The Author(s). This work is published and licensed by Dove Medical Press Limited. The
full terms of this license are available at https://www.dovepress.com/terms
and incorporate the Creative Commons Attribution
- Non Commercial (unported, 3.0) License.
By accessing the work you hereby accept the Terms. Non-commercial uses of the work are permitted
without any further permission from Dove Medical Press Limited, provided the work is properly
attributed. For permission for commercial use of this work, please see paragraphs 4.2 and 5 of our Terms.
© 2016 The Author(s). This work is published and licensed by Dove Medical Press Limited. The
full terms of this license are available at https://www.dovepress.com/terms
and incorporate the Creative Commons Attribution
- Non Commercial (unported, 3.0) License.
By accessing the work you hereby accept the Terms. Non-commercial uses of the work are permitted
without any further permission from Dove Medical Press Limited, provided the work is properly
attributed. For permission for commercial use of this work, please see paragraphs 4.2 and 5 of our Terms.