Back to Journals » Clinical Ophthalmology » Volume 20
Structural and Microvascular Changes in Demyelinating Optic Neuritis Assessed by OCT and OCTA: A 6-Month Longitudinal Study
Authors Bezerra S ![]() , Teixeira-Martins R
, Teixeira-Martins R ![]() , Ribeiro M
, Ribeiro M ![]() , Rocha P
, Rocha P ![]() , Faria O, Guimarães J, Rocha-Sousa A
, Faria O, Guimarães J, Rocha-Sousa A ![]()
Received 22 September 2025
Accepted for publication 4 December 2025
Published 7 March 2026 Volume 2026:20 569321
DOI https://doi.org/10.2147/OPTH.S569321
Checked for plagiarism Yes
Review by Single anonymous peer review
Peer reviewer comments 2
Editor who approved publication: Dr Scott Fraser
Sofia Bezerra,1,2,* Rita Teixeira-Martins,3,* Margarida Ribeiro,4,5 Paulo Rocha,3 Olinda Faria,3,6 Joana Guimarães,1,2,7 Amândio Rocha-Sousa3,6
1Department of Clinical Neurosciences and Mental Health, Faculty of Medicine, University of Porto, Porto, Portugal; 2RISE-Health, Department of Clinical Neurosciences and Mental Health, Faculty of Medicine, University of Porto, Porto, Portugal; 3Department of Ophthalmology, São João Local Health Unit, Porto, Portugal; 4Department of Ophthalmology, Alto Ave Health Unit, Guimarães, Portugal; 5Department of Biomedicine, Faculty of Medicine, University of Porto, Porto, Portugal; 6Department of Surgery and Physiology, Faculty of Medicine, University of Porto, Porto, Portugal; 7Department of Neurology, São João Local Health Unit, Porto, Portugal
*These authors contributed equally to this work
Correspondence: Rita Teixeira-Martins, Department of Ophthalmology, São João Local Health Unit, Alameda Professor Hernâni Monteiro, Porto, 4202-451, Portugal, Email [email protected]
Purpose: To longitudinally characterize structural and vascular density changes in demyelinating optic neuritis (DON) using spectral-domain optical coherence tomography (OCT) and OCT angiography (OCTA).
Methods: This prospective study included 23 patients (mean age 41.1 ± 15.3 years; 75.9% female) with first unilateral DON at a Portuguese tertiary center. Baseline (T0) and 6-month (T6) assessments included best-corrected visual acuity (BCVA), peripapillary retinal nerve fiber layer (pRNFL), ganglion cell complex (GCC), focal loss volume (FLV), global loss volume (GLV), and vessel densities from the radial peripapillary capillary (RPC) and macular superficial vascular plexus (SVP). Affected and fellow eyes were compared. The Wilcoxon test was applied, and p-values were adjusted using the Benjamini–Hochberg method (p < 0.05).
Results: At baseline, affected eyes showed increased pRNFL thickness compared with fellow eyes, particularly in nasal sectors including nasal, inferonasal, nasal-upper, and nasal-lower regions (p ≤ 0.024). At 6 months, significant thinning was detected in average pRNFL and temporal quadrant (both p = 0.036), accompanied by higher FLV and GLV values (p ≤ 0.036). Longitudinally (T0–T6), progressive thinning occurred across all quadrants and ONH sectors in affected eyes (p < 0.05), while fellow eyes remained stable. OCTA revealed reduced vessel density in whole-image all-vessels, as well as in superior and inferior peripapillary sectors (p ≤ 0.028) at T6, with no significant longitudinal change after correction.
Conclusion: Demyelinating optic neuritis exhibits a dynamic course with early structural thickening followed by progressive neuroaxonal loss. Significant longitudinal pRNFL and ONH thinning supports sustained axonal degeneration beyond the acute phase. OCTA changes were restricted to selected peripapillary sectors, suggesting subtle parallel microvascular alterations. OCT and OCTA offer complementary information for comprehensive assessment and monitoring of demyelinating optic neuropathies.
Keywords: demyelinating optic neuritis, neuroaxonal degeneration, vascular density, optical coherence tomography angiography
Introduction
Demyelinating optic neuritis (DON) is one of the most frequent causes of acute optic nerve dysfunction in young adults, typically presenting with unilateral painful monocular vision loss that develops over hours to days. It is strongly associated with multiple sclerosis (MS) and other inflammatory disorders, representing a typical manifestation of central nervous system demyelination.1 Beyond its acute impact on vision, optic neuritis (ON) provides an accessible model for studying the dynamics of inflammation, demyelination, axonal degeneration, and neuroaxonal remodelling in vivo.1,2
Optical coherence tomography (OCT) has revolutionized the study of optic neuropathies by enabling quantitative assessment of retinal axonal and neuronal integrity. Measurements such as peripapillary retinal nerve fiber layer (pRNFL) and macular ganglion cell complex thickness (GCC) have been validated as structural biomarkers in MS and ON.2 The OCT studies consistently show that ON leads to progressive thinning of these layers, reflecting neuroaxonal injury and correlating with both visual function and central nervous system disease activity.3 However, the temporal profile of acute structural changes remains incompletely understood.
Optical coherence tomography angiography (OCTA) has further expanded the scope of retinal imaging by providing a non-invasive means of visualizing and quantifying the retinal and peripapillary microvasculature.4 Early evidence suggests that vascular alterations, including reductions in vessel density, may accompany or follow axonal damage in ON.5 Nonetheless, vascular changes in DON appear less pronounced in the acute phase than in ischemic optic neuropathies. Their pathophysiological relevance, whether secondary to axonal loss or representing an independent mechanism, remains unclear.6
Despite these advances, the current literature is limited by small sample sizes, heterogeneous methodologies, and a lack of longitudinal prospective studies systematically integrating OCT and OCTA assessments from the acute episode of DON through follow-up.7,8 This gap limits understanding of how structural and vascular parameters evolve over time and does not yet allow strong prognostic conclusions. The primary objective of this study is to longitudinally characterize these changes in DON, comparing the acute phase with a 6-month follow-up. By integrating OCT and OCTA parameters, this study aims to provide exploratory insights into the longitudinal course of DON.
Materials and Methods
Study Design and Population
This single-center prospective cohort study was conducted at São João Local Health Unit (Porto, Portugal) in collaboration between the Departments of Neurology and Ophthalmology. Only patients with unilateral involvement were included, with the unaffected fellow eye serving as an internal control. Consecutive adult patients (≥18 years) with a first clinical episode of acute or subacute DON within one month of symptom onset were enrolled between January 2021 and December 2022. Follow-up assessments continued until December 2023, when the last enrolled participant completed the 6-month visit. Patients were scheduled for follow-up visits at baseline (acute phase), 6 months, and 12 months; however, due to substantial loss to follow-up after the 6-month visit, only data up to this timepoint were included in the present analysis. Limiting inclusion to hospitalized patients ensured a standardized diagnostic work-up and ophthalmologic evaluation.
The clinical diagnosis of ON was based on established criteria,2 requiring at least one of the following: decreased visual acuity, dyschromatopsia, relative afferent pupillary defect, ocular pain with eye movements, optic disc swelling, or visual field loss. Patients with prior ON, optic disc pallor in either eye, or confounding ocular/systemic diseases were excluded. Additional exclusions comprised significant media opacities (corneal opacity, dense cataract, vitreous cells > trace), macular pathology, refractive error >6D myopia or >3D hyperopia/astigmatism, glaucoma or intraocular pressure >30 mmHg, traumatic optic neuropathy, and use of retinotoxic medications (eg, ethambutol, hydroxychloroquine, phenothiazines). Patients with recent systemic corticosteroid or corticotropin therapy (within 3 months or >7 days in the previous 6 months), as defined by the Optic Neuritis Treatment Trial (ONTT),9 were also excluded. Patients lost to follow-up or with poor-quality imaging were excluded.
All participants underwent a standardized diagnostic protocol comprising brain, spinal cord, and orbital MRI; blood biochemistry and immunology; MOG-IgG and AQP4-IgG cell-based assays; and cerebrospinal fluid (CSF) analysis.10
Ophthalmologic Evaluation
Ophthalmologic assessments were performed at baseline (during hospitalization) and at 6-month follow-up. Examinations included best-corrected visual acuity (BCVA) using ETDRS charts, intraocular pressure (iCare tonometer), automated refraction (TOPCON), slit-lamp biomicroscopy, dilated fundus examination with color photography, and color vision testing with Hardy-Rand-Rittler pseudoisochromatic plates. To rule out potential inter-eye confounding, axial length, spherical equivalent, and intraocular pressure were compared between affected and fellow eyes at baseline, with no significant differences detected.
Imaging Protocol
Retinal imaging was performed using spectral-domain OCT (RTVue XR Avanti, Optovue Inc., Fremont, CA, USA) equipped with the AngioVue OCTA module. Protocols included macular cube and line scans, and a 3.45-mm diameter peripapillary circle scan. OCT structural parameters comprised peripapillary retinal nerve fiber layer (pRNFL) thickness and macular ganglion cell complex (GCC) metrics, obtained by automated segmentation. GCC analysis was performed on 6×6 mm macular scans centered on the fovea. It included the RNFL, ganglion cell layer (GCL), and inner plexiform layer (IPL), reflecting the structural integrity of retinal ganglion cells and their axons. The device provided mean and sectoral GCC thickness values (µm), as well as Global Loss Volume (GLV) and Focal Loss Volume (FLV), quantifying diffuse and focal thinning relative to a normative database, expressed as percentages. Experienced technicians performed all imaging, and quality control followed the Advised Protocol for OCT Study Terminology and Elements (APOSTEL)11 recommendations. Both eyes were imaged, with the unaffected fellow eye used as an internal control. Subclinical unilateral ON was excluded using intereye difference thresholds (>5 µm for pRNFL or >4 µm for macular GCC), as proposed in previous studies.12,13
Optical coherence tomography angiography (OCTA) was performed in all patients using the RTVue XR Avanti system (Optovue, Inc., Fremont, CA, USA) with the AngioVue software. Two scan protocols were acquired: a 3×3 mm macular scan centered on the fovea (Figure 1) and a 4.5×4.5 mm peripapillary scan centered on the optic disc (Figure 2). Vessel density (VD) was defined as the proportion of the scanned area occupied by vessels with detectable flow and was automatically reported by the software.
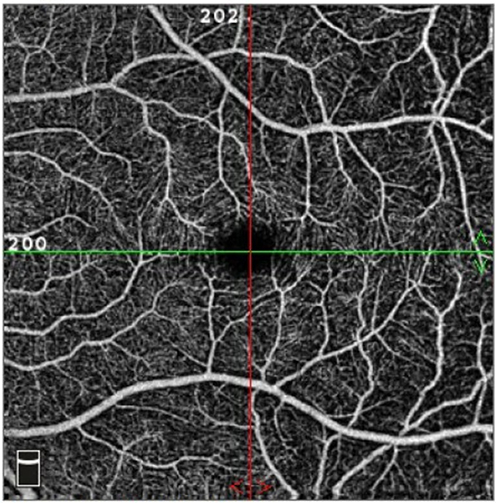 |
Figure 1 OCTA macular scan (3 × 3 mm) centered on the fovea, illustrating the superficial vascular plexus. |
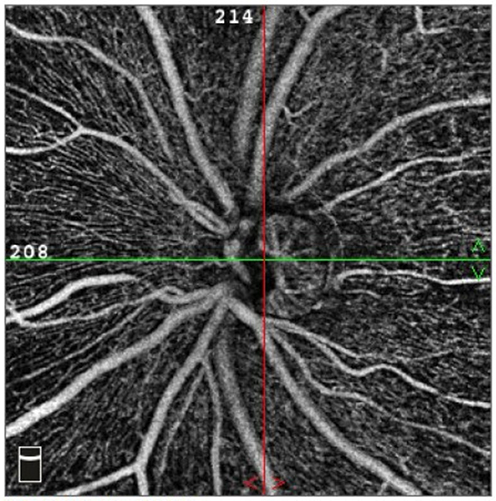 |
Figure 2 OCTA of the optic nerve head (4.5 × 4.5 mm scan) showing peripapillary radial capillary plexus distribution around the optic disc. |
For macular analysis, vessel density was quantified in the superficial vascular plexus (SVP) at the fovea (1 mm), the parafovea (1–3 mm), and the perifovea (3–6 mm), with parafoveal and perifoveal regions further divided into superior, inferior, nasal, and temporal quadrants (Figure 3). The SVP was selected because it supplies the RNFL and GCL, the main structures of interest, and provides more reliable measurements while avoiding the segmentation errors common in the deep plexus.14 For the peripapillary analysis, whole-image VD (wiVD) was calculated over the entire 4.5×4.5 mm scan, while intradisc VD (idVD) corresponded to the average VD within the optic nerve head. In addition, the radial peripapillary capillary (RPC) plexus, defined as the circular network of capillaries running within the retinal nerve fiber layer around the optic disc, was analyzed within a 750-µm elliptical annulus extending from the disc margin. VD was quantified in eight sectors (superonasal [SN], superotemporal [ST], inferonasal [IN], inferotemporal [IT], temporal-superior [TS], temporal-inferior [TI], nasal-superior [NS], and nasal-inferior [NI]) according to the RNFL bundle trajectory schema defined by Garway-Heath et al15 (Figure 4). VD values were obtained separately for small vessels (capillaries only) and for all vessels (capillaries plus larger vessels), and all results were expressed as percentages.
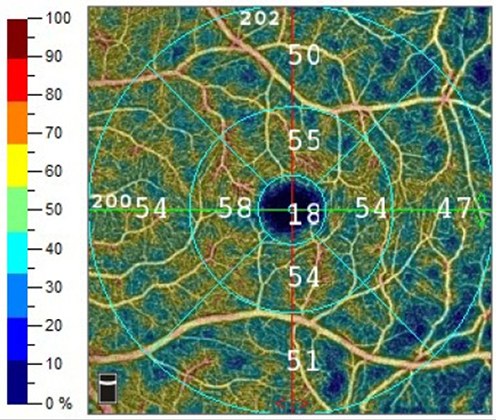 |
Figure 3 Quantitative macular vessel density map segmented into foveal, parafoveal, and perifoveal regions, with further subdivision into four quadrants (superior, inferior, nasal, temporal). Vessel density is displayed using a color-coded scale, where warmer colors represent higher perfusion and cooler colors indicate reduced density. |
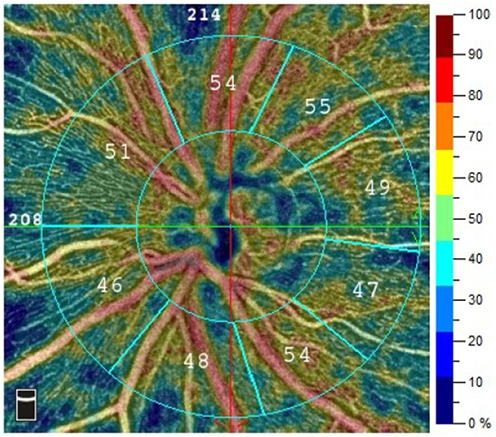 |
Figure 4 Vessel density map of the radial peripapillary capillary plexus segmented into eight Garway-Heath sectors. Cool colors indicate lower vessel density, while warm colors indicate higher density. Sector. Abbreviations: SN, superonasal; ST, superotemporal; IN, inferonasal; IT, inferotemporal; TS, temporal-superior; TI, temporal-inferior; NS, nasal-superior; NI, nasal-inferior. |
Statistical Analysis
Categorical variables were described as absolute and relative frequencies [n (%)]. Continuous variables were assessed for normality using the Shapiro–Wilk test. Variables with p>0.05 were considered normally distributed and were presented as mean (standard deviation), whereas non-normally distributed variables were expressed as median (interquartile range, IQR).
Comparisons between affected eyes and fellow control eyes for each imaging parameter were performed using the Wilcoxon signed-rank test, as the distributions were more suitable for non-parametric analysis. Multiple comparisons were adjusted using the Benjamini–Hochberg procedure.
An adjusted p-value <0.05 was considered statistically significant. Statistical analyses were conducted using IBM SPSS Statistics, version 26 (IBM Corp., Armonk, NY, USA).
Ethics Approval
The study was approved by the Ethics Committee of São João Local Health Unit (project no. 331/22) and conducted in accordance with the principles of the Declaration of Helsinki. All participants provided informed consent for the analysis and publication of their data.
Results
Study Population
Fifty-one patients with acute or subacute optic neuropathies were initially screened. After applying the exclusion criteria, 23 patients with a first episode of DON were included. A flowchart (Figure 5) summarises the patient selection process, including the number of individuals initially assessed, the application of inclusion and exclusion criteria, and the final cohort. The cohort had a mean age of 41.1 ± 15.3 years and was predominantly female (75.9%). The affected eye was the right eye in 15 cases (65.2%) and the left eye in 8 cases (34.8%). At 6 months, three patients were lost to follow-up, leaving 20 patients for the final analysis.
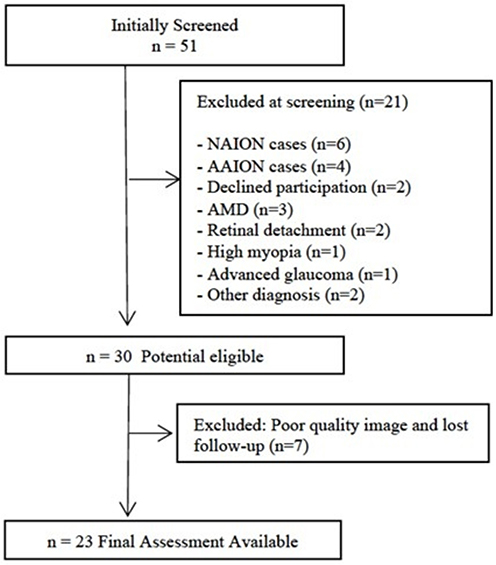 |
Figure 5 Study flowchart depicting patient selection. The diagram summarizes the number of patients initially assessed, the reasons for exclusion according to predefined criteria, and the final cohort included in the analysis. Abbreviations: NAION, Non-arteritic Anterior Ischemic Optic Neuropathy; AAION, Arteritic anterior Ischemic Optic Neuropathy; AMD, Age-Related Macular Degeneration. |
At baseline (T0), BCVA measured with ETDRS charts was significantly reduced in affected eyes compared with fellow eyes [73.0 (21.0) vs 84.0 (12.0) letters; p < 0.001]. At follow-up (T6), BCVA was 79.5 (12.0) vs 83.5 (12.0) letters, with no statistically significant difference (p = 0.333).
Structural OCT Findings
At baseline (T0), affected eyes exhibited significantly greater peripapillary RNFL thickness compared with fellow eyes [107.0 (24.0) vs 104.5 (15.0) µm; p = 0.024], with a statistically significant difference in the nasal quadrant [83.0 (25.0) vs 82.0 (10.0) µm; p = 0.013]. Localized ONH thickening was also significantly greater in the inferonasal [125.5 (45.0) vs 117.5 (26.0) µm; p = 0.007], nasal-upper [88.5 (22.0) vs 86.5 (10.0) µm; p = 0.024], and nasal-lower sectors [79.5 (31.0) vs 76.5 (11.0) µm; p = 0.024].
At 6 months (T6), affected eyes demonstrated significant thinning of the pRNFL compared with fellow eyes [94.5 (18.0) vs 106.5 (16.0) µm; p = 0.036], with a statistically significant reduction in the temporal quadrant [68.5 (16) vs 77.5 (14.0); p = 0.036]. Longitudinal analysis (T0–T6) confirmed significant pRNFL reductions across the average, superior, inferior, temporal, and nasal quadrants (all p ≤ 0.023). Similar thinning patterns were observed within all ONH sectors (p ≤ 0.021).
Macular metrics demonstrated increases in focal and global loss parameters over time. At baseline, FLV was similar between affected and fellow eyes [0.58 (2.50) vs 0.53 (1.03) %; p = 0.389], as was GLV [2.23 (3.79) vs 1.27 (2.64) %; p = 0.542]. At 6 months, both FLV [2.35 (4.49) % vs 0.50 (2.08) %; p = 0.036] and GLV [8.37 (9.84) % vs 2.95 (5.59) %, p = 0.036] were significantly higher in affected eyes. Longitudinal analysis (T0–T6) also showed significant within-eye increases in FLV (p = 0.010) and GLV (p = 0.027). GCC thickness showed no significant longitudinal change in affected eyes between T0 and T6 [96.0 (10.0) µm vs 86.5 (18.0) µm; p = 0.147]. No structural changes were detected in fellow eyes across any parameter. These structural OCT results are summarized in Table 1.
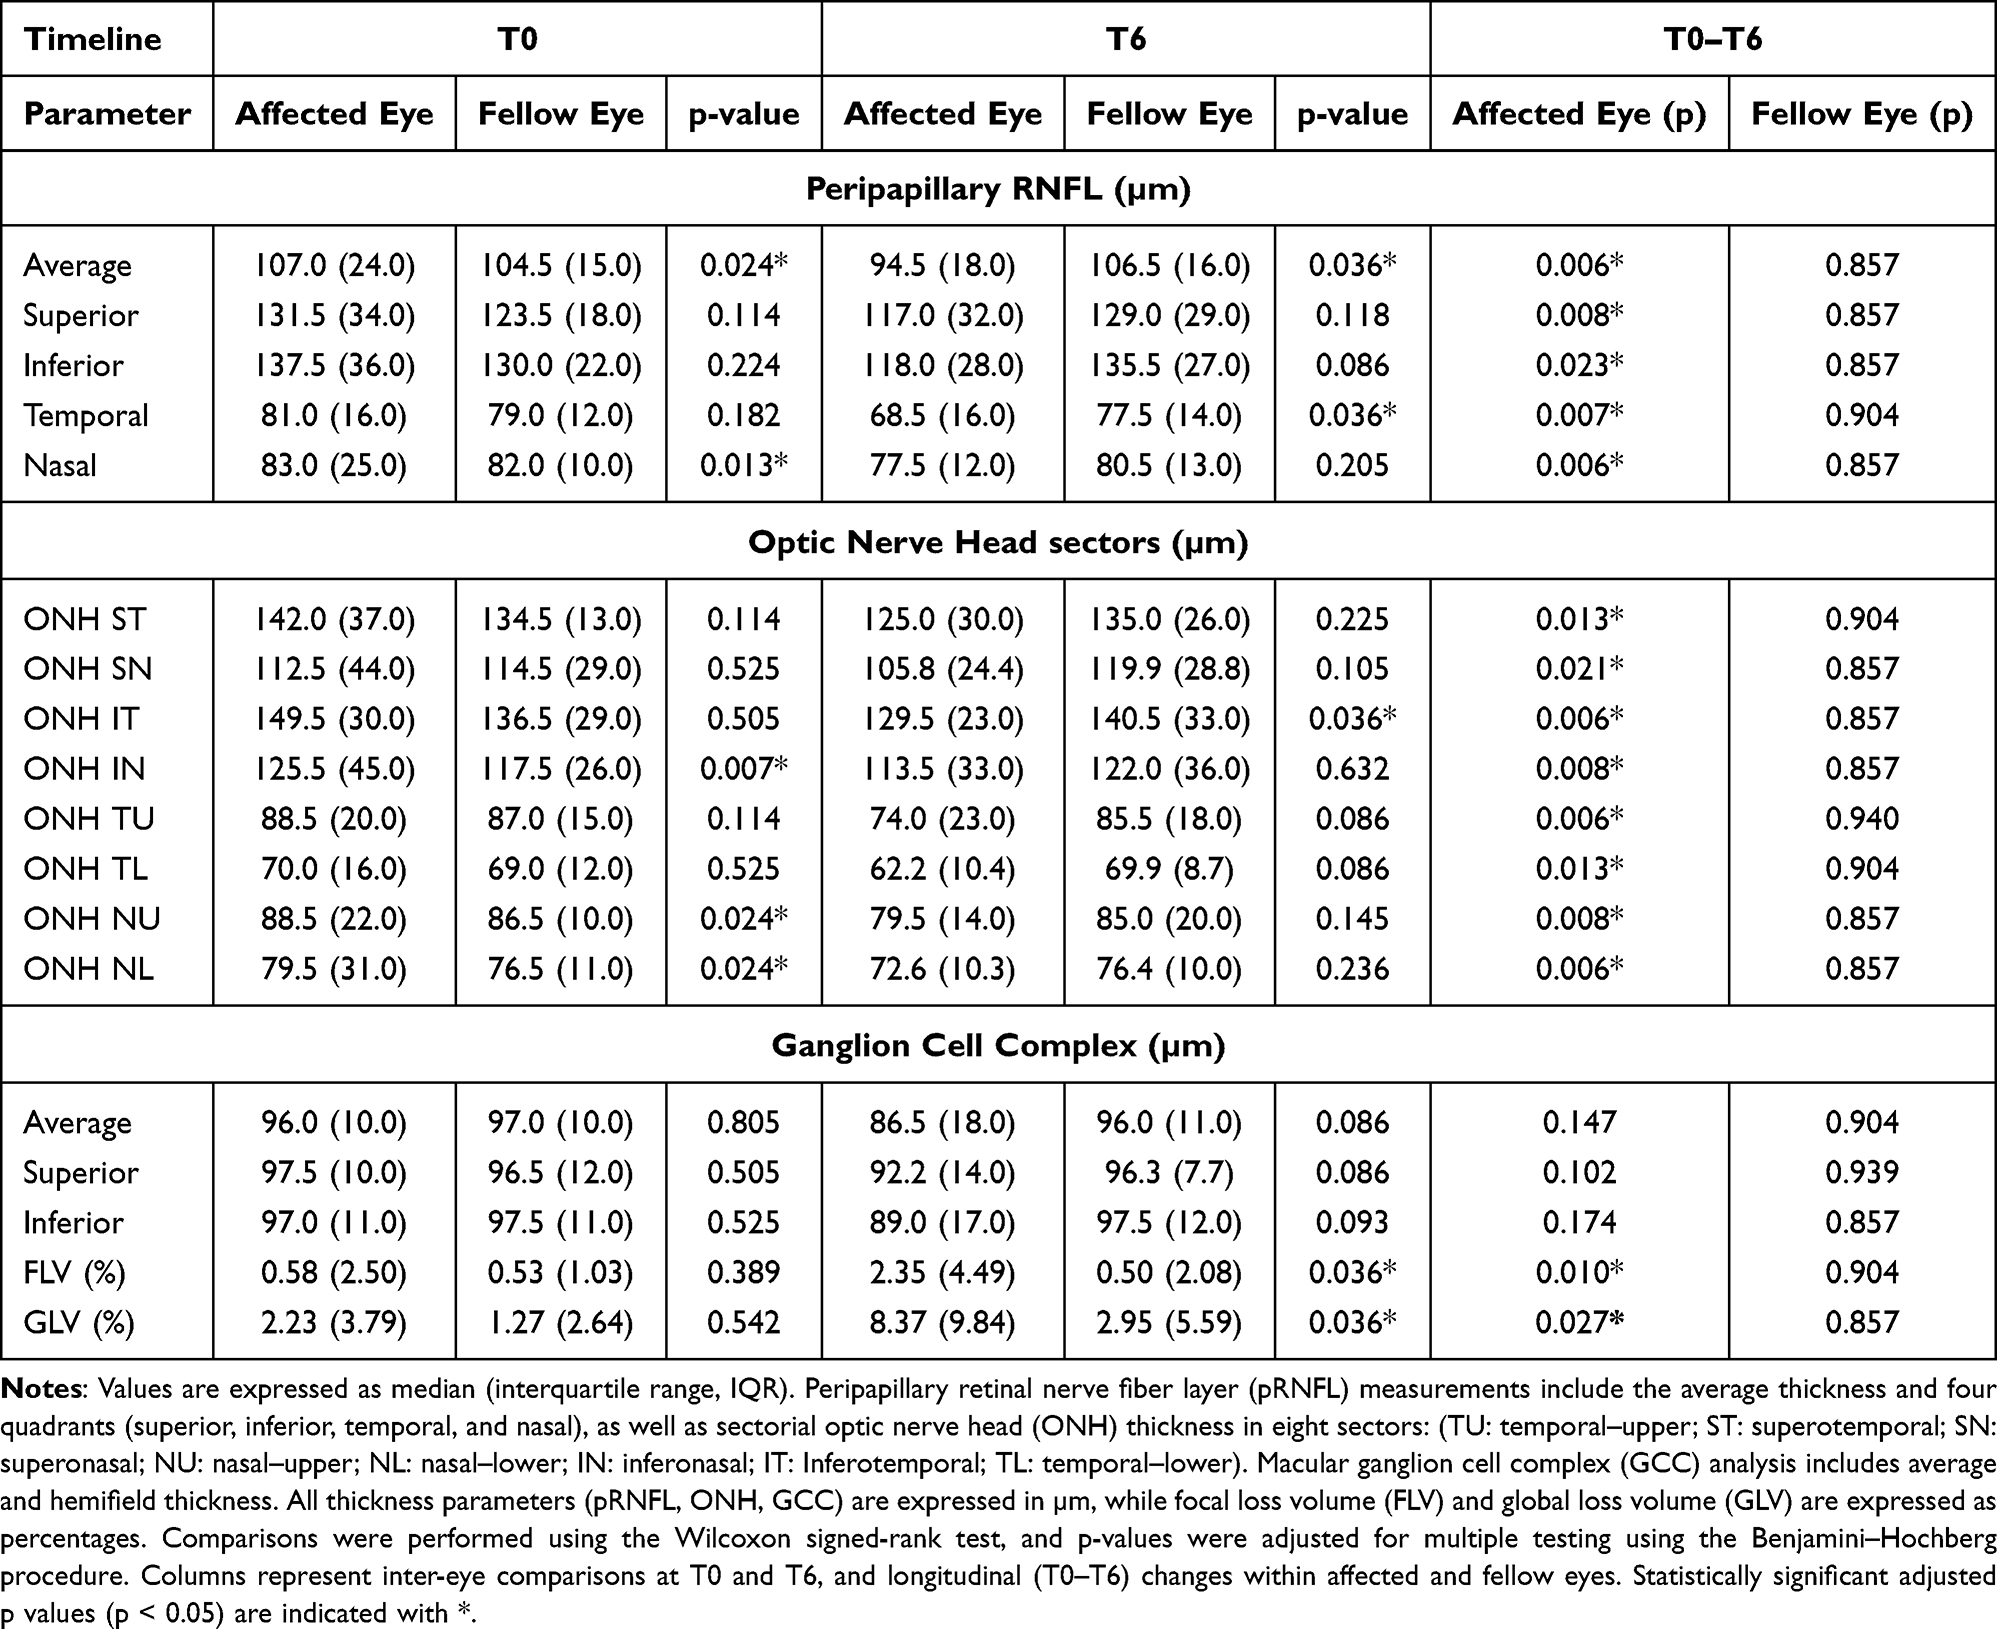 |
Table 1 Structural OCT Parameters in Affected and Fellow Eyes at Baseline (T0) and 6 Months (T6), and Longitudinal Changes (T0–T6) |
Vascular OCTA Findings
The microvascular findings are demonstrated in Table 2. At baseline (T0), affected eyes exhibited comparable overall SVP vessel densities to fellow eyes, particularly in the superior and nasal sectors. No significant differences were detected in any parafoveal sector (all p ≥ 0.376) or in any perifoveal sector (all p ≥ 0.197).
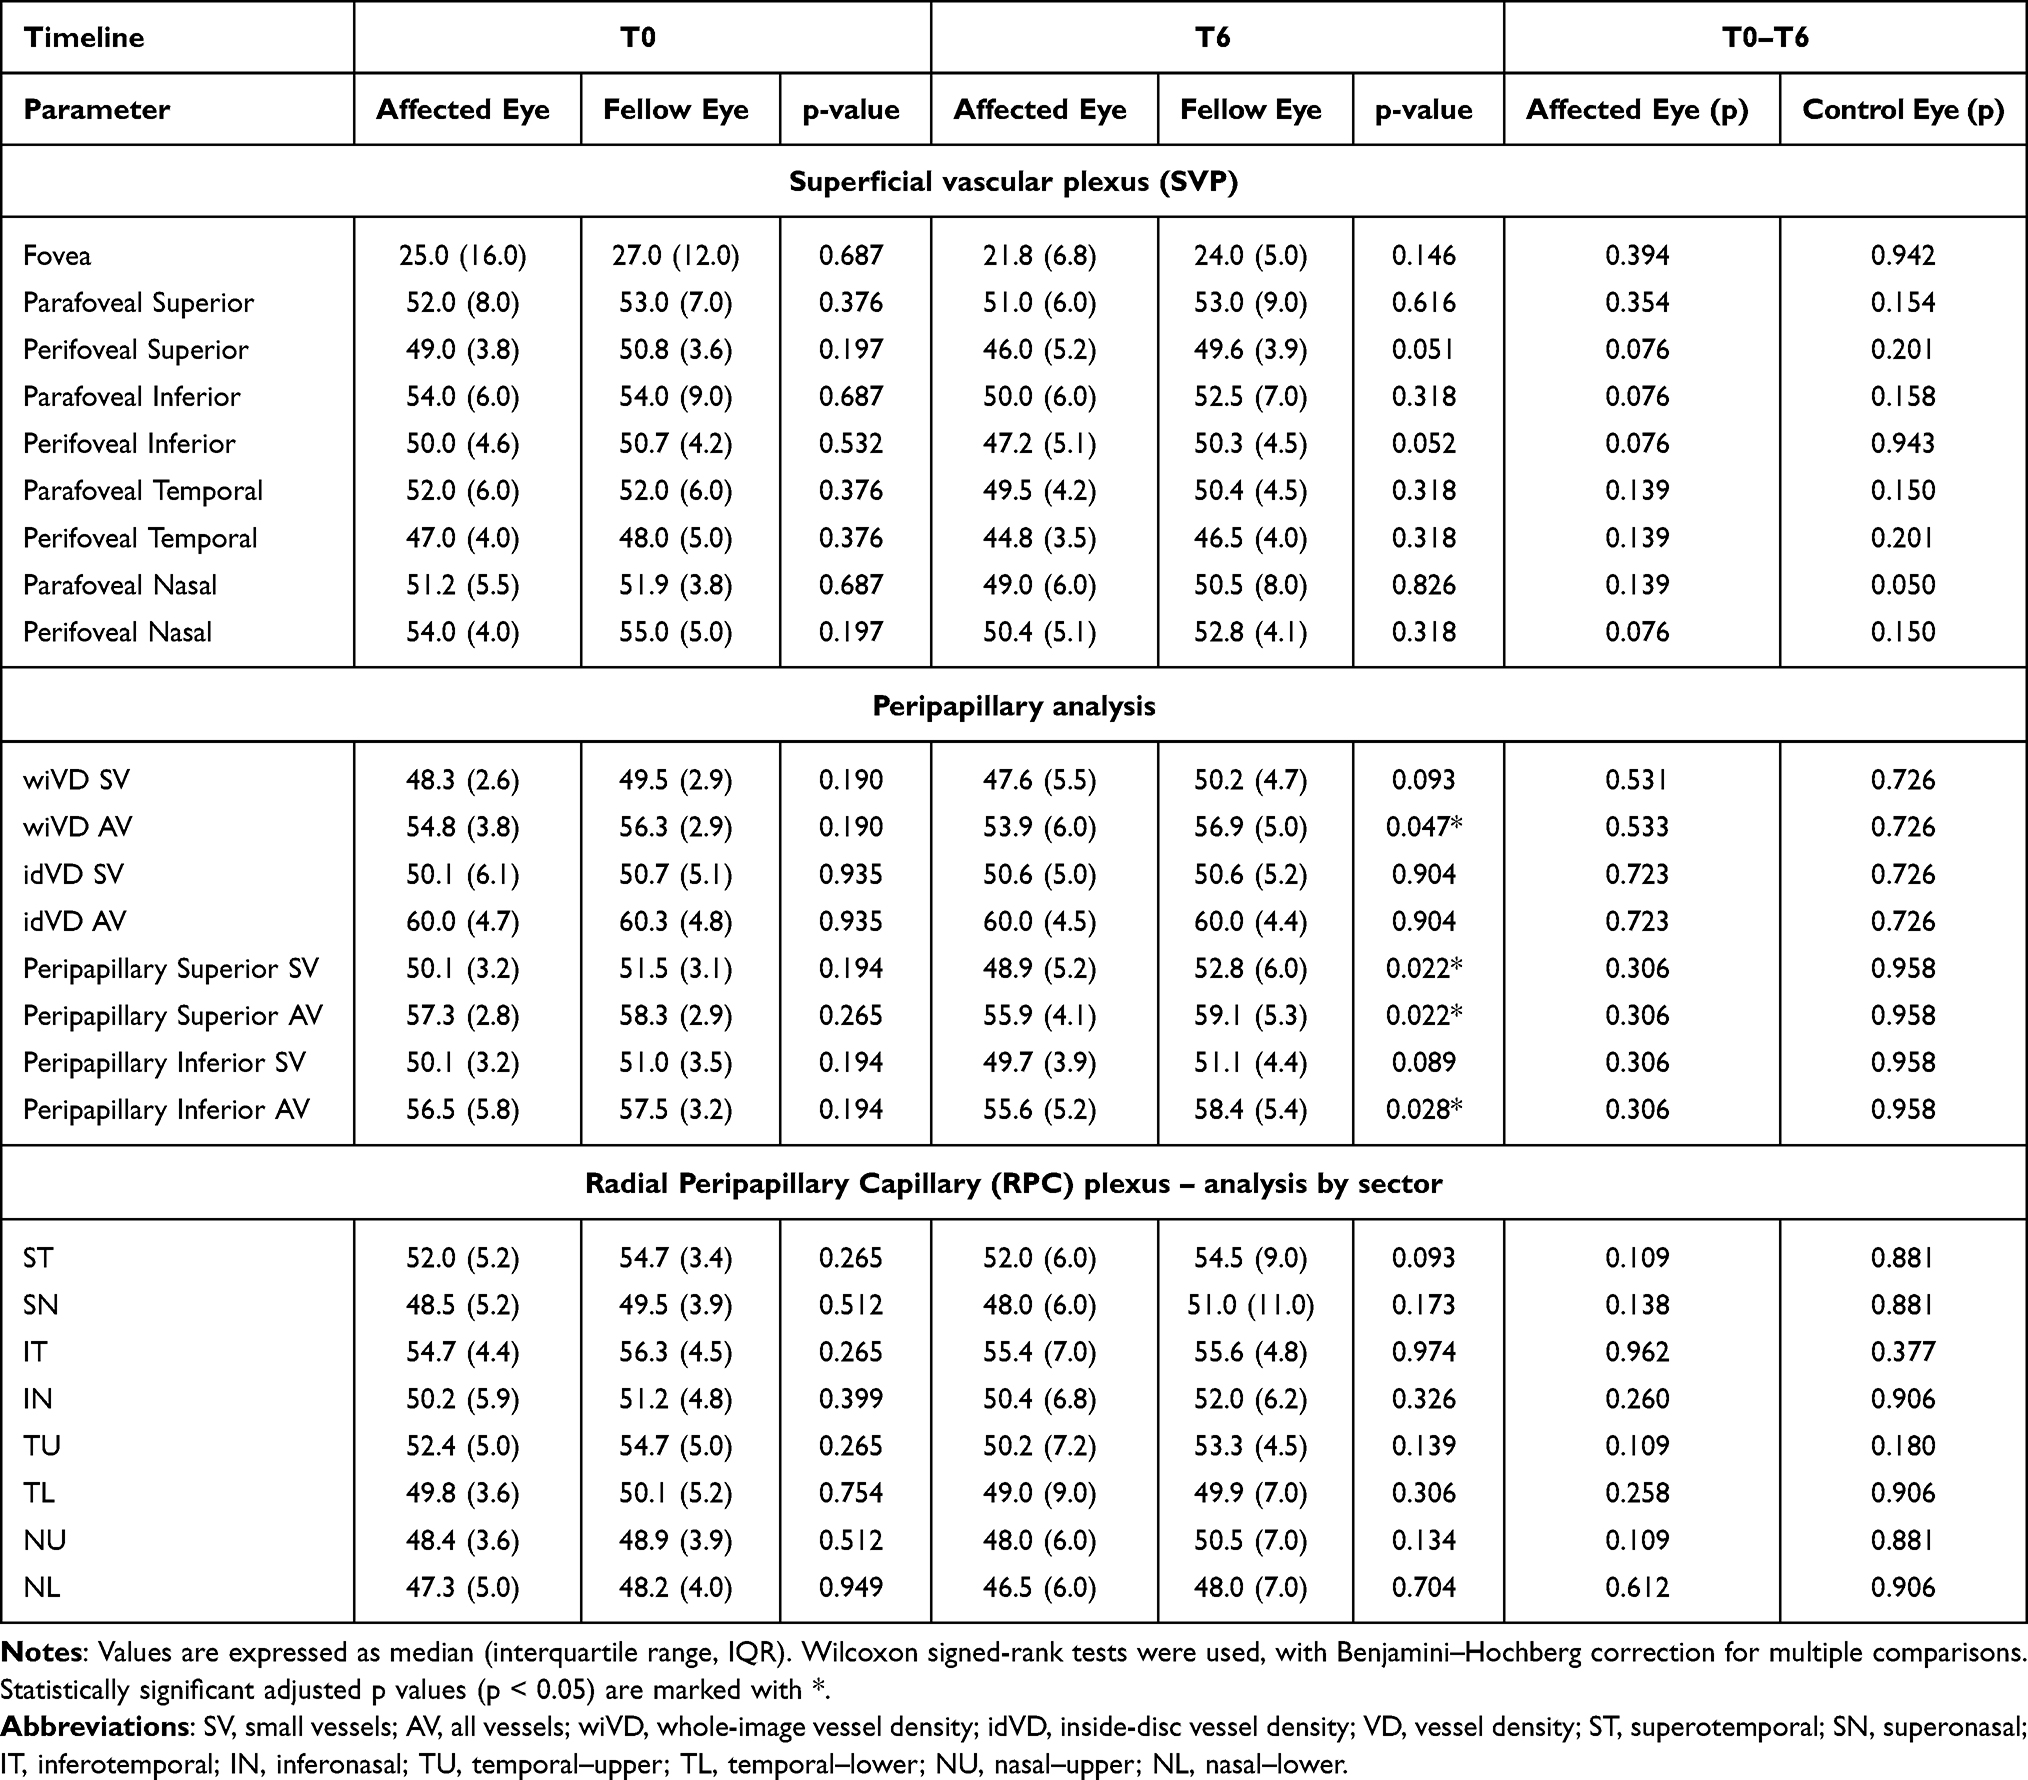 |
Table 2 Vascular OCTA Parameters in Affected and Fellow Eyes at Baseline (T0), 6 Months (T6), and Longitudinal Comparison (T0–T6) |
At 6 months (T6), most vascular parameters remained stable between eyes. Although SVP macular vessel densities were consistently lower in affected eyes across all foveal, parafoveal, and perifoveal regions, none of these differences reached statistical significance. However, analysis of the peripapillary region revealed a reduction in wiVD AV [53.9 (6.0) % vs 56.9 (5.0) %; p = 0.047], which was more evident in the peripapillary superior SV [48.9 (5.2) % vs 52.8 (6.0) %; p = 0.022], superior AV [55.9 (4.1) % vs 59.1 (5.3) %; p = 0.022], and inferior AV sectors [55.6 (5.2) % vs 58.4 (5.4) %; p = 0.028].
Longitudinally (T0–T6), OCTA parameters did not reach statistical significance after Benjamini–Hochberg correction, although vessel density tended to decrease across both macular and peripapillary layers over time.
Discussion
Multiple sclerosis (MS) is primarily known as an autoimmune and neurodegenerative disease, but vascular mechanisms are increasingly recognized as a significant factor contributing to its progression and disability.1 DON is an inflammatory condition, yet recent evidence shows that vascular involvement plays a relevant role in its pathophysiology. Therefore, ON and MS should not be regarded as purely neurodegenerative disorders, but as conditions in which inflammatory and vascular processes interact to drive tissue damage. In this context, structural and vascular parameters derived from OCT and OCTA provide complementary insights into disease mechanisms. Importantly, these imaging modalities must be interpreted alongside, rather than as substitutes for clinical evaluation. Future comparative studies with primarily vascular optic neuropathies, such as NAION, may help further delineate disease-specific imaging features. This highlights that OCT and OCTA structural and vascular metrics complement each other and should not be interpreted in isolation. Taken in consideration, the OCTA is emerging as a key imaging tool in neuro-ophthalmology. Unlike fluorescein angiography, it is non-invasive, dye-free, and allows repeatable depth-resolved assessment of retinal and peripapillary microvasculature.14 This is particularly relevant in demyelinating diseases, where subtle vascular changes may precede detectable permanent structural loss. In line with this, Bostan et al16 showed in MS patients that thinning of the RNFL and GCL, together with reduced vessel density in the superficial capillary plexus, correlates with both MRI findings and clinical disability. In our study, although a parallel decline in structural and vascular parameters was observed, particularly in the peripapillary region, the present design does not allow any causal inference between structural and vascular changes. Our findings are instead compatible with concurrent evolution of vascular and structural changes, without establishing directionality.
In our prospective cohort, we captured the dynamic transition from the acute to the chronic stage. At presentation, affected eyes showed peripapillary RNFL thickening, reflecting axonal swelling, along with early focal SVP loss in the macula. These microvascular alterations were subtle but detectable, suggesting that vascular dysfunction occurs in parallel with the inflammatory process. By six months, a distinct pattern had become evident, with marked thinning of both RNFL and GCC, accompanied by sectoral vascular compromise at both macular and peripapillary levels. The temporal overlap between structural and vascular changes suggests concurrent progression rather than a direct structural–vascular interrelationship. The lack of statistically significant macular vascular alterations after correction does not necessarily indicate absence of change but rather reflects measurement variability and the conservative nature of the Benjamini–Hochberg procedure, which minimizes false-positive associations in small cohorts. Thus, our data support an associative pattern, without determining whether vascular alterations are primary or secondary. This concept aligns with work by Aly et al17 reported similar dynamics, with SVP rarefaction continuing up to six months and paralleling GCIPL loss, but microvascular alterations may stabilize or become less detectable once axonal atrophy predominates. Murphy et al18 further showed that OCTA changes in SVP and RPC correlate with visual outcomes and may persist beyond the structural atrophy phase. Our findings suggest that vascular and structural degeneration progress in parallel, with subtle focal vascular changes already detectable before measurable ganglion cell loss; however, causality cannot be inferred from this analysis.
Other groups have reported similar patterns. In demyelinating ON, significant vessel density reductions were found not only in the affected eye but also, more surprisingly, in the contralateral eye. Latent perfusion changes in fellow eyes suggest that ON is not purely a local event but may trigger more diffuse or systemic microvascular effects.19 Although fellow eyes were analyzed in our cohort, we did not observe the same perfusion changes reported in previous studies. Therefore, our findings do not support the presence of subclinical microvascular involvement in fellow eyes within this timeframe.
Comparisons with antibody-mediated disorders are also promising. Yao et al20 observed that while structural thinning was similar between MOGAD-ON and AQP4-ON, microvascular loss was more severe in MOGAD-ON and closely linked with visual acuity, whereas in AQP4-ON visual loss was better explained by inner retinal thickness. This contrast highlights that vascular and structural biomarkers may carry different weights depending on the underlying pathology. Whether vascular compromise is primary or secondary remains debated. Some studies argue that vascular loss follows GCIPL thinning,19 while others suggest a vascular-first mechanism, especially in MOGAD-ON.20 Our results are compatible with both possibilities, as the observed early vascular changes may reflect either primary microvascular dysfunction or secondary effects of inflammation. However, we did not stratify patients by antibody status, as this would have resulted in very small subgroup sizes, precluding meaningful statistical comparisons.
To our knowledge, longitudinal OCTA studies in demyelinating ON generally report progressive peripapillary VD loss rather than increases.21 In our study, no significant longitudinal vascular decline was detected after correction, yet the stable or downward trend in most sectors suggests that OCTA may be less sensitive than OCT in detecting subtle early changes once edema resolves. Sectoral fluctuations, particularly mild increases in inferior regions, likely reflect edema resolution and local hemodynamic redistribution rather than genuine vascular recovery.
Taken together, these results suggest that vascular impairment in ON is not simply secondary to axonal atrophy but may reflect an early inflammatory or metabolic disturbance. However, as this study was not designed to test direct correlations between structure and vasculature, these findings should be interpreted as associative rather than causal. From a clinical perspective, OCT remains the more reliable marker of disease activity and structural integrity, whereas OCTA contributes complementary information about microvascular status. Their combined interpretation may enhance disease characterization, although further work is needed to explore prognostic value.22,23
Several limitations should be acknowledged. Our sample size was modest, with some attrition at follow-up. Follow-up was limited to six months, which may not capture later divergence in structural and vascular trajectories. We focused only on the superficial macular plexus and RPC without exploring the deep plexus or choroid. This choice was partly due to technical limitations, as the automated segmentation algorithm available on our device does not reliably analyze the deeper layers, and partly conceptual, since the superficial plexus is the main vascular supply for retinal nerve fibers and ganglion cells, making it the most pathophysiological relevant to investigate in this context. However, this precludes evaluating deeper plexus alterations known to differentiate MOGAD from AQP4 phenotypes.24,25 Furthermore, a methodological issue is the use of the fellow eye as control. This intra-individual design reduces intersubject variability and strengthens statistical comparisons. However, evidence shows that contralateral eyes in ON and MS may harbor subclinical damage, limiting their validity as true “healthy” controls.21,23 Nolan-Kenney et al12 and Bsteh et al13 validated inter-eye difference thresholds as sensitive diagnostic markers of ON, but they also recognized that even fellow eyes may be partially affected. Volpe et al24 recently demonstrated that inter-eye differences remain highly diagnostic in MOG-ON, despite these caveats. Thus, while our design improves sensitivity to subtle asymmetries, it may underestimate the absolute magnitude of disease-associated change. Also, OCTA remains prone to artifacts, despite strict quality control. Finally, our single-center design may limit generalizability.
Future work should expand on these findings in larger, multicenter cohorts and incorporation of antibody status to clarify vascular versus structural trajectories across different demyelinating entities. Determining whether early vascular alterations have prognostic relevance would be an important area for future investigation. Extending follow-up beyond six months will also help determine whether the changes we observed stabilize or continue to progress. Ultimately, the integration of OCTA into clinical trials may clarify its role not only as a diagnostic tool but also as a prognostic biomarker and outcome measure for emerging neuroprotective therapies.
Conclusion
In summary, demyelinating ON follows a biphasic course characterized by acute RNFL swelling with focal vascular impairment, evolving into diffuse neuroaxonal thinning and microvascular attenuation. These observations suggest a parallel evolution of structural and vascular alterations rather than a direct causal relationship. Our findings are consistent with previous reports and illustrate the temporal progression of both parameters in a Portuguese cohort. Integrating OCT and OCTA parameters provides complementary, but not interchangeable, information about ON pathophysiology and their prognostic value remain to be clarified. Together, these imaging modalities may therefore offer associative markers that may support clinical assessment and future therapeutic research in demyelinating optic neuropathies.
Ethics Approval and Informed Consent
The study protocol was approved by the Ethics Committee of São João Local Health Unit, Porto, Portugal (approval No. 331/22). Written informed consent was obtained from all participants in accordance with the tenets of the Declaration of Helsinki.
Funding
This research received no specific grant from funding agencies in the public, commercial, or not-for-profit sector.
Disclosure
The authors report no conflicts of interest in this work.
References
1. Petzold A, Fraser CL, Abegg M, et al. Diagnosis and classification of optic neuritis. Lancet Neurol. 2022;21(12):1120–11. doi:10.1016/S1474-4422(22)00200-9
2. Petzold A, Balcer LJ, Calabresi PA, et al. Retinal layer segmentation in multiple sclerosis: a systematic review and meta-analysis. Lancet Neurol. 2017;16(10):797–812. doi:10.1016/S1474-4422(17)30278-8
3. Noval S, Contreras I, Muñoz S, Oreja-Guevara C, Manzano B, Rebolleda G. Optical coherence tomography in multiple sclerosis and neuromyelitis optica: an update. Mult Scler Int. 2011;2011:472790. doi:10.1155/2011/472790
4. Spaide RF, Fujimoto JG, Waheed NK, Sadda SR, Staurenghi G. Optical coherence tomography angiography. Prog Retin Eye Res. 2018;64:1–55. doi:10.1016/j.preteyeres.2017.11.003
5. Chu Z, Lin J, Gao C, et al. Quantitative assessment of the retinal microvasculature using optical coherence tomography angiography. J Biomed Opt. 2016;21(6):66008. doi:10.1117/1.JBO.21.6.066008
6. Augstburger E, Zéboulon P, Keilani C, Baudouin C, Labbé A. Retinal and choroidal microvasculature in nonarteritic anterior ischemic optic neuropathy: an optical coherence tomography angiography study. Invest Ophthalmol Vis Sci. 2018;59(2):870–877. doi:10.1167/iovs.17-22996
7. Falavarjani KG, Sadda SR. Optical coherence tomography angiography of the optic nerve head, current situation and future perspective. J Eye Sci. 2016;1:38. doi:10.21037/jes.2016.09.03
8. Marmoy OR, Viswanathan S. Clinical electrophysiology of the optic nerve and retinal ganglion cells. Eye. 2021;35(9):2386–2405. doi:10.1038/s41433-021-01614-x
9. Beck RW. The optic neuritis treatment trial. Arch Ophthalmol. 1988;106(8):1051–1053. doi:10.1001/archopht.1988.01060140207023
10. von Elm E, Altman DG, Egger M, et al. The strengthening the reporting of observational studies in epidemiology (STROBE) statement: guidelines for reporting observational studies. Lancet. 2007;370(9596):1453–1457. doi:10.1016/S0140-6736(07)61602-X
11. Aytulun A, Cruz-Herranz A, Aktas O, et al. APOSTEL 2.0 recommendations for reporting quantitative optical coherence tomography studies. Neurology. 2021;97(2):68–79. doi:10.1212/WNL.0000000000012125
12. Nolan-Kenney RC, Liu M, Akhand O, et al. Optimal intereye difference thresholds by optical coherence tomography in multiple sclerosis: an international study. Ann Neurol. 2019;85(5):618–629. doi:10.1002/ana.25462
13. Bsteh G, Hegen H, Altmann P, et al. Validation of inter-eye difference thresholds in optical coherence tomography for identification of optic neuritis in multiple sclerosis. Mult Scler Relat Disord. 2020;45:102403. doi:10.1016/j.msard.2020.102403
14. Douglas VP, Douglas KAA, Torun N. Optical coherence tomography angiography in neuro-ophthalmology. Curr Opin Ophthalmol. 2023;34(4):354–360. doi:10.1097/ICU.0000000000000955
15. Garway-Heath DF, Poinoosawmy D, Fitzke FW, et al. Mapping the visual field to the optic disc in normal tension glaucoma eyes. Ophthalmology. 2000;107(10):1809–1815. doi:10.1016/S0161-6420(00)00284-0
16. Bostan M, Pîrvulescu R, Tiu C, Bujor I, Popa-Cherecheanu A. OCT and OCT-A biomarkers in multiple sclerosis - review. Rom J Ophthalmol. 2023;67(2):107–110. doi:10.22336/rjo.2023.20
17. Aly L, Noll C, Wicklein R, et al. Dynamics of retinal vessel loss after acute optic neuritis in patients with relapsing multiple sclerosis. Neurol Neuroimmunol Neuroinflamm. 2022;9(3):e1159. doi:10.1212/NXI.0000000000001159
18. Murphy OC, Kalaitzidis G, Vasileiou E, et al. Optical coherence tomography and optical coherence tomography angiography findings after optic neuritis in multiple sclerosis. Front Neurol. 2020;11:618879. doi:10.3389/fneur.2020.618879
19. Lee G-I, Park K-A, Oh SY, Min J-H, Kim BJ. Peripapillary and parafoveal microvascular changes in eyes with optic neuritis and their fellow eyes measured by optical coherence tomography angiography: an Exploratory Study. Acta Ophthalmol. 2021;99(3):288–298. doi:10.1111/aos.14577
20. Yao Y, Li X, Xu Y, et al. The difference of the retinal structural and microvascular characteristics in patients with MOGAD-ON and AQP4-ON. BMC Neurol. 2022;22(1):323. doi:10.1186/s12883-022-02848-2
21. Codron P, Masmoudi I, Tran THC. Retinal vascular density using optical coherence tomography-angiography in optic neuritis. J Clin Med. 2023;12(16):5403. doi:10.3390/jcm12165403
22. Outteryck O, Lopes R, Drumez É, et al. Optical coherence tomography for detection of asymptomatic optic nerve lesions in clinically isolated syndrome. Neurology. 2020;95(6):e733–e744. doi:10.1212/WNL.0000000000009832
23. Cordon B, Vilades E, Orduna E, et al. Angiography with optical coherence tomography as a biomarker in multiple sclerosis. PLoS One. 2020;15(12):e0243236. doi:10.1371/journal.pone.0243236
24. Volpe G, Jurkute N, Girafa G, et al. Diagnostic value of inter-eye difference metrics on OCT for myelin oligodendrocyte glycoprotein antibody-associated optic neuritis. Neurol Neuroimmunol Neuroinflamm. 2024;11(6):e200291. doi:10.1212/NXI.0000000000200291
25. Lang Y, Kwapong WR, Kong L, et al. Retinal structural and microvascular changes in myelin oligodendrocyte glycoprotein antibody disease and neuromyelitis optica spectrum disorder: an OCT/OCTA study. Front Immunol. 2023. doi:10.3389/fimmu.2023.1029124
 © 2026 The Author(s). This work is published and licensed by Dove Medical Press Limited. The
full terms of this license are available at https://www.dovepress.com/terms
and incorporate the Creative Commons Attribution
- Non Commercial (unported, 4.0) License.
By accessing the work you hereby accept the Terms. Non-commercial uses of the work are permitted
without any further permission from Dove Medical Press Limited, provided the work is properly
attributed. For permission for commercial use of this work, please see paragraphs 4.2 and 5 of our Terms.
© 2026 The Author(s). This work is published and licensed by Dove Medical Press Limited. The
full terms of this license are available at https://www.dovepress.com/terms
and incorporate the Creative Commons Attribution
- Non Commercial (unported, 4.0) License.
By accessing the work you hereby accept the Terms. Non-commercial uses of the work are permitted
without any further permission from Dove Medical Press Limited, provided the work is properly
attributed. For permission for commercial use of this work, please see paragraphs 4.2 and 5 of our Terms.