Back to Journals » Clinical Ophthalmology » Volume 19
Structural and Functional Outcomes of Optic Pathway Compression in Pituitary Adenoma: A Prospective Pilot OCT Study
Authors Březík M ![]() , Němčanský J, Krejčí T, Polách O
, Němčanský J, Krejčí T, Polách O ![]() , Timkovič J
, Timkovič J ![]() , Chrapek O
, Chrapek O ![]()
Received 25 July 2025
Accepted for publication 5 November 2025
Published 6 December 2025 Volume 2025:19 Pages 4433—4445
DOI https://doi.org/10.2147/OPTH.S556193
Checked for plagiarism Yes
Review by Single anonymous peer review
Peer reviewer comments 2
Editor who approved publication: Dr John Miller
Michal Březík,1,2 Jan Němčanský,1,3 Tomáš Krejčí,4,5 Ondřej Polách,1,6 Juraj Timkovič,1,3 Oldřich Chrapek2,7
1Clinic of Ophthalmology, University Hospital Ostrava, Ostrava, Czech Republic; 2Department of Ophthalmology, Faculty of Medicine Masaryk University, Brno, Czech Republic; 3Department of Craniofacial Surgery, Faculty of Medicine University of Ostrava, Ostrava, Czech Republic; 4Clinic of Neurosurgery, University Hospital Ostrava, Ostrava, Czech Republic; 5Department of Clinical Neurosciences, Faculty of Medicine University of Ostrava, Ostrava, Czech Republic; 6Department of Ophthalmology, Faculty of Medicine in Hradec Kralove Charles University, Hradec Kralove, Czech Republic; 7Clinic of Ophthalmology, University Hospital Brno, Brno, Czech Republic
Correspondence: Jan Němčanský, Clinic of Ophthalmology, University Hospital Ostrava, 17. listopadu 1790/5, 708 52, Ostrava–Poruba, Czech Republic, Email [email protected]
Purpose: To evaluate the anatomical and functional effects of optic chiasm compression caused by a pituitary adenoma both before and after surgery.
Patients and Methods: Short-term prospective study of 48 eyes from 24 patients who underwent radical surgery for pituitary adenoma. Comprehensive ophthalmological assessment was performed and OCT (optical coherence tomography) parameters (RNFL - retinal nerve fiber layer, GCL - ganglion cell layer, BMO-MRW - Bruch’s membrane opening-minimum rim width) and BVCA (best corrected visual acuity) using ETDRS (Early Treatment Diabetic Retinopathy Study) chart were evaluated before surgery and 3 months after surgery.
Results: Over time, a decline in RNFL was observed in circular scans of 3.5 mm, 4.1 mm, and 4.7 mm (p = 0.001– 0.04), as well as in GCL (p = 0.001– 0.022) and BMO-MRW (p = 0.001– 0.033). The median improvement in vision was 4 letters (IQR 0– 6) (p < 0.001). A positive correlation between RNFL and visual improvement was found only in the TS (temporo-superior) sector in the 4.7 mm circle (p = 0.018). A negative correlation was observed between the difference between preoperative and normative RNFL and GCL values and the postoperative BCVA (RNFL p = 0.005– 0.046, GCL p = 0.009– 0.022).
Conclusion: Following radical surgery all three OCT parameters show a significant decline. While the reduction between preoperative and postoperative values does not influence the final visual outcome, preoperative atrophy of the RNFL and the GCL is negatively correlated with postoperative BCVA. The BMO-MRW may represent a novel marker of compressive neuropathy.
Keywords: RNFL, GCL, BMO-MRW, ETDRS
Introduction
Pituitary adenomas account for 10–25% of all brain tumors and are the most common sellar lesion.1,2 They occur twice as often in women.3 Based on size on MRI (magnetic resonance imaging) scans, adenomas are classified as microadenomas (diameter <10mm), macroadenomas (diameter >10mm), and giant adenomas (diameter >25mm).2 The clinical manifestation of pituitary adenomas depends on tumor size, its relation to the optic chiasm, and the presence of hormonal overproduction.4 Surgical therapy via endonasal approach is the first-line treatment for nonfunctioning tumors, while the treatment of functioning adenomas depends on the type of hormone secreted.3 Stereotactic radiosurgery is the treatment of choice when surgery is not sufficiently radical, hormonal hypersecretion persists, or the tumor recurs and surgery is not indicated.5 The dominant radiosurgical technique is CyberKnife, while the Leksell Gamma Knife is used less frequently.5 Traditionally in these patients, we perform perimetry to assess visual fields and measure the RNFL (retinal nerve fiber layer) to assess the status of the optic nerve, as pathology of both is typical in tumors growing below the pituitary gland causing compression and axoplasmic stasis of fibers from the nasal retina.6 The GCL (ganglion cell layer) has for years been regarded as a valuable newer parameter, believed to be slightly more sensitive to early changes.6 The BMO-MRW (Bruch’s membrane opening-minimum rim width, true neuroretinal rim) was originally designed for glaucoma patients, but due to large-scale analysis of optic discs it has been observed that BMO-MRW also changes in several non-glaucomatous neuropathies.7 We believe that BMO-MRW may be a valuable marker of compressive neuropathy, as it has already been shown to be more sensitive to early glaucomatous changes than RNFL.8 In our study, we compared data before and after surgery and also added a comparison with the manufacturer – provided normative dataset. For the pre versus post-surgery comparison we anticipated a decrease in values, whereas for the comparison with the normative dataset we chose an exploratory two-sided approach.
Materials and Methods
Initially, a prospective analysis was conducted on 76 patients with tumors of the sellar region treated at the Clinic of Ophthalmology, University Hospital Ostrava, between August 1, 2022, and July 16, 2024. From this group, 59 patients with histologically confirmed pituitary adenomas were selected. For the final dataset used in the statistical analysis, 24 patients (48 eyes) were included—only those who met all inclusion criteria and none of the exclusion criteria. Inclusion criteria were: 1. Undergoing ophthalmological examination 1–20 days before surgery and 3 months (12–14 weeks) after surgery, 2. Pituitary adenoma treated surgically via transnasal endoscopic resection, 3. Postoperative MRI showing no residual tumor. Exclusion criteria were: 1. Presence of systemic diseases affecting the monitored parameters (eg, neurodegenerative disorders such as multiple sclerosis), or ocular conditions that reduce media transparency (eg, corneal opacities, cataract), severe retinal disease (eg, age-related macular degeneration), optic nerve disease (eg, glaucoma), or high myopia worse than −6 diopters, 2. Poor cooperation during OCT (optical coherence tomography) examination, 3. Reoperation for a sellar tumor, 4. Revision surgery after primary resection, 5. History of stereotactic radiosurgery. Pituitary adenomas were classified as microadenomas, macroadenomas, and giant adenomas based on tumor size measured on MRI scans after gadolinium contrast administration. Only tumors demonstrating suprasellar extension were included. The study was conducted at a single medical center. It was approved by the Ethics Committee of University Hospital Ostrava (Approval No. 319/2022) and conducted in accordance with the principles of the Declaration of Helsinki.
Data Collection
All patients underwent a comprehensive ophthalmologic examination, including evaluation of BCVA (best corrected visual acuity) using ETDRS (Early Treatment Diabetic Retinopathy Study) chart (Good-Lite, Jansen Farm Dr, Elgin, IL, USA), intraocular pressure (IOP) measured with a Pascal Dynamic Contour Tonometer (Ziemer Group, Port, Switzerland), anterior and posterior segment examination using the CSO-SL 9900 slit lamp (CSO, Scandicci, Italy), and structural assessment of the retina and optic nerve with non-invasive OCT Spectralis (Heidelberg Engineering GmbH, Heidelberg, Germany). At all visits, BCVA testing was standardized: it began at 4 m and continued at 1 m only if the subject read ≤ 19 letters at 4 m. The stopping rule was 0 letters.9 The OCT acquisition process began by defining the anatomic landmarks for the automatic anatomic positioning system (detecting the fovea position – confirming the fovea position, detecting the BMO (Bruch’s membrane opening) center position – confirming the BMO center position). The C – curve (radius of curvature of the anterior corneal surface) remained fixed due to aforementioned inclusion/exclusion criteria. Three types of scans were acquired: 1) optic nerve head – 24 radial scans of 15° length and 7.5° intersectional distance, and 3 circle scans of 3.5 mm, 4.1 mm and 4.7 mm diameter with 0.3 mm intersectional distance, all centered on the the BMO center, 2) horizontal volumetric macular scan of size 30° x 25° centered on the fovea, images oriented parallel to the FoBMOC axis (fovea-to-BMO center axis), with an intersectional distance of 120 µm, 3) vertical volumetric macular scan of size 30° x 15° centered on the fovea, images oriented perpendicular to the FoBMOC axis, with an intersectional distance of 240 µm. Each OCT examination thus met the following criteria: 1. Image orientation based on two fixed landmarks – the center of the fovea and the BMO, 2. Neuroretinal rim evaluation using the BMO-MRW parameter (ie shortest distance between the BMO and the internal limiting membrane – true neuroretinal rim), 3. RNFL analysis in three concentric peripapillary circles, 4. Evaluation of the GCL. The normative database for RNFL, BMO-MRW, and GCL in adult Caucasian subjects was obtained from the Spectralis device manual (User Manual Software version 7.0, Article No. 230129–007 INT.AE21, “unpublished data”). In this normative database, RNFL and BMO-MRW values were adjusted for age and BMO size, while GCL values were adjusted for age and the distance between the fovea center and BMO center. RNFL thickness and BMO-MRW were measured using standard sectors: global (G), temporal (T), temporo-superior (TS), temporo-inferior (TI), nasal (N), naso-superior (NS), and naso-inferior (NI). GCL thickness was assessed using the following sectors: global (G), temporo-superior (TS), superior (S), naso-superior (NS), naso-inferior (NI), inferior (I), and temporo-inferior (TI). The evaluated numerical variables included age, follow-up time, ETDRS, RNFL, GCL, and BMO-MRW.
Data Analysis
Descriptive statistics were used to characterize the numerical variables (median – M, interquartile range – IQR, minimum/maximum values). Categorical variables were described using absolute and relative frequencies (%). Comparisons of measured variables with normative values were performed using the two-sided one-sample Wilcoxon test. Differences between baseline and follow-up parameters were evaluated using the one-sided one-sample Wilcoxon test. Additional between-group comparisons were conducted using the Mann–Whitney test. Correlations between numerical variables were assessed using Spearman correlation coefficient, with accompanying confidence interval and p-value of its test of significance. A significance level of 0.05 was used for all statistical tests, which were performed using R software (version 4.4.1, The R Foundation for Statistical Computing, Vienna, Austria).
Results
The study group included 12 men (50.0%) and 12 women (50.0%). The median age of patients was 62 years (IQR 53–68 years, interval 26–79 years). The median age for women was 56 years (interval 26–72 years), and for men it was 68 years (interval 43–79 years). The median age of women was statistically significantly lower than that of men (p = 0.005, Mann–Whitney test). The median follow-up duration was 94 days (interval 83–120 days). Among the patients, 22 had a macroadenoma (91.67%), one had a giant adenoma (4.17%), and one had a microadenoma (4.17%).
Baseline vs Normative RNFL
A statistically significant difference between baseline and normative RNFL was found in the T sector (p = 0.001–0.003) and the N sector (p =0.003–0.04) (Table 1).
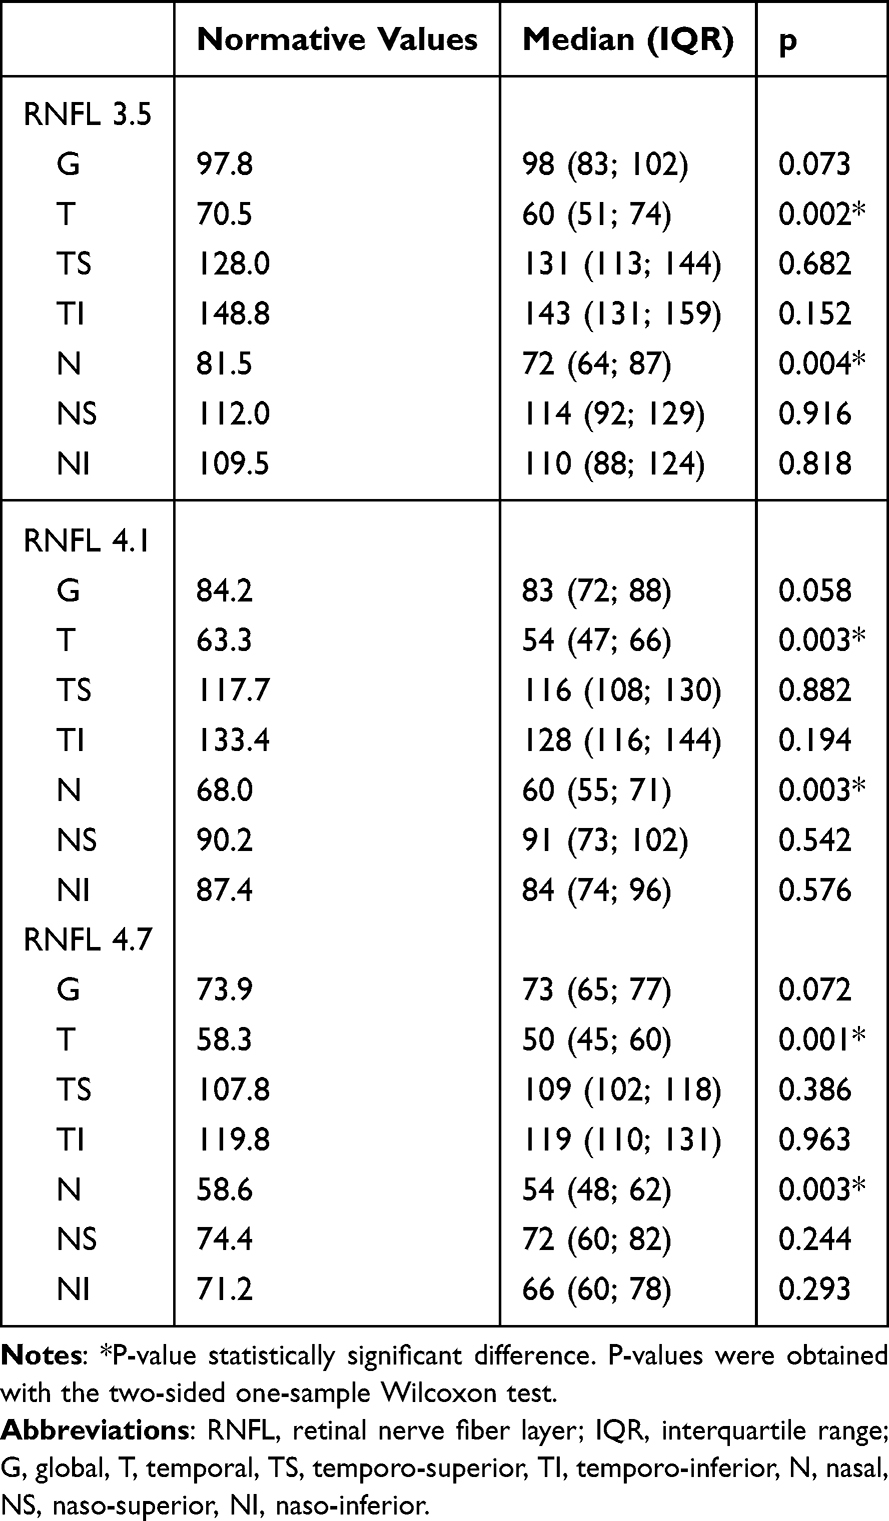 |
Table 1 Comparison of Baseline RNFL (3.5mm, 4.1mm and 4.7mm, All Segments) with Normative Values, n = 48 Eyes |
Baseline vs Normative GCL and BMO-MRW
Statistically significant differences between baseline and normative GCL were found in all sectors (p < 0.001–0.005). For BMO-MRW, significant changes were found in the TS sector (p = 0.042) and the N sector (p = 0.026) (Table 2).
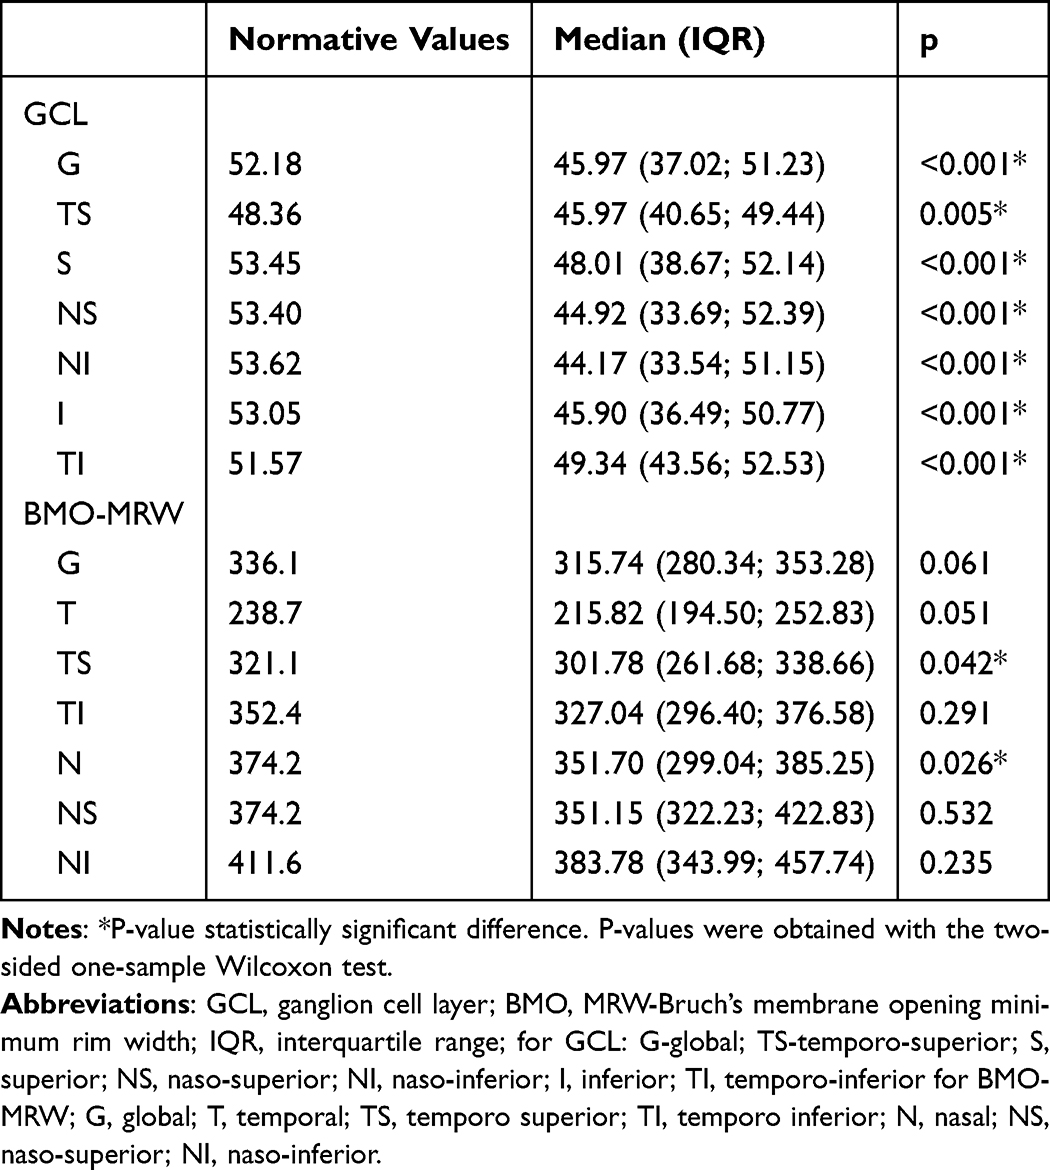 |
Table 2 Comparison of Baseline GCL and BMO-MRW (All Segments) with Normative Values, n = 48 Eyes |
Preoperative vs Postoperative RNFL
A statistically significant decrease was found: in the 3.5 mm circle – all sectors (p = 0.001–0.025), in the 4.1 mm circle - sectors G, T, TS, N, NS (0.001–0.024), in the 4.7 mm circle - sectors G, TS, N, NS (p = 0.001–0.009) (Table 3).
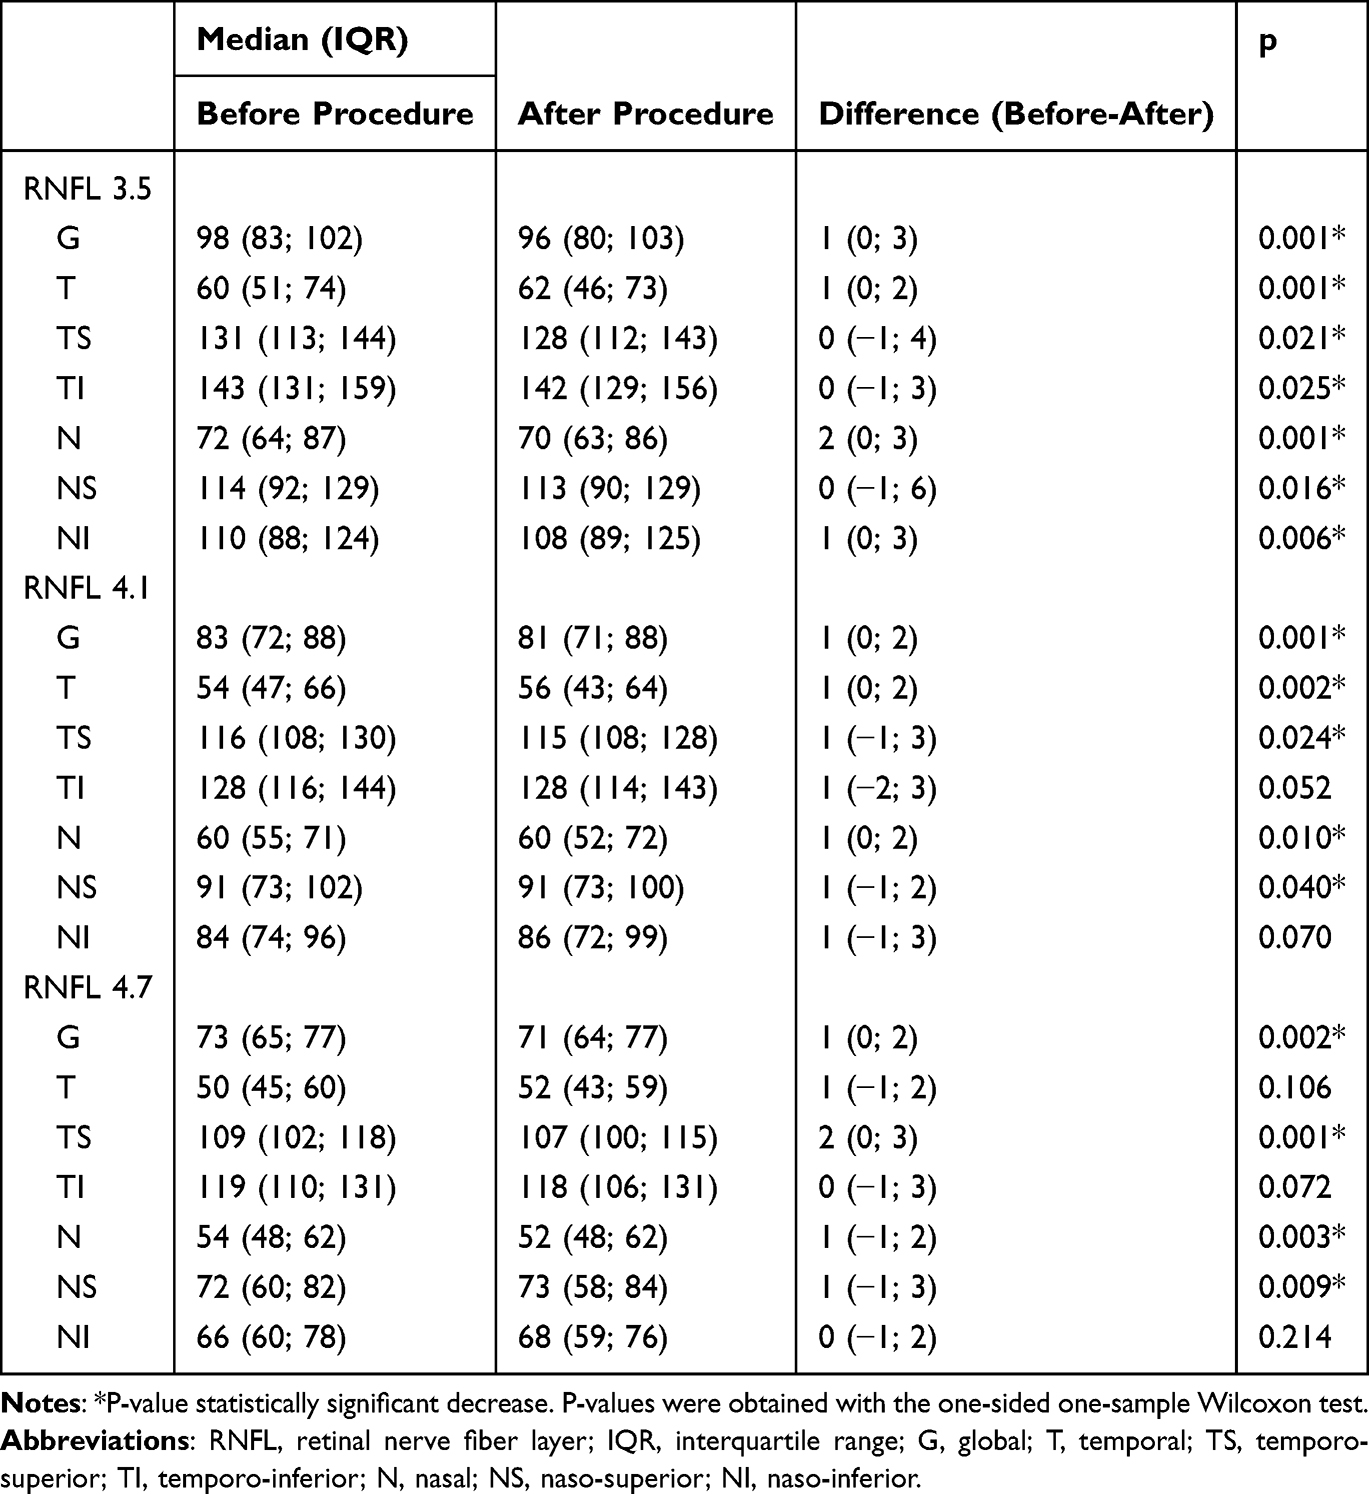 |
Table 3 Comparison of RNFL (3.5 mm, 4.1 mm and 4.7 mm, All Segments) Before and After Procedure, n = 48 Eyes |
Preoperative vs Postoperative GCL and BMO-MRW
For GCL, a statistically significant decrease was observed in sectors S, NS, NI, and I (p =0.001–0.018). For BMO-MRW, a significant decrease was observed in all sectors (p < 0.001–0.034) (Table 4).
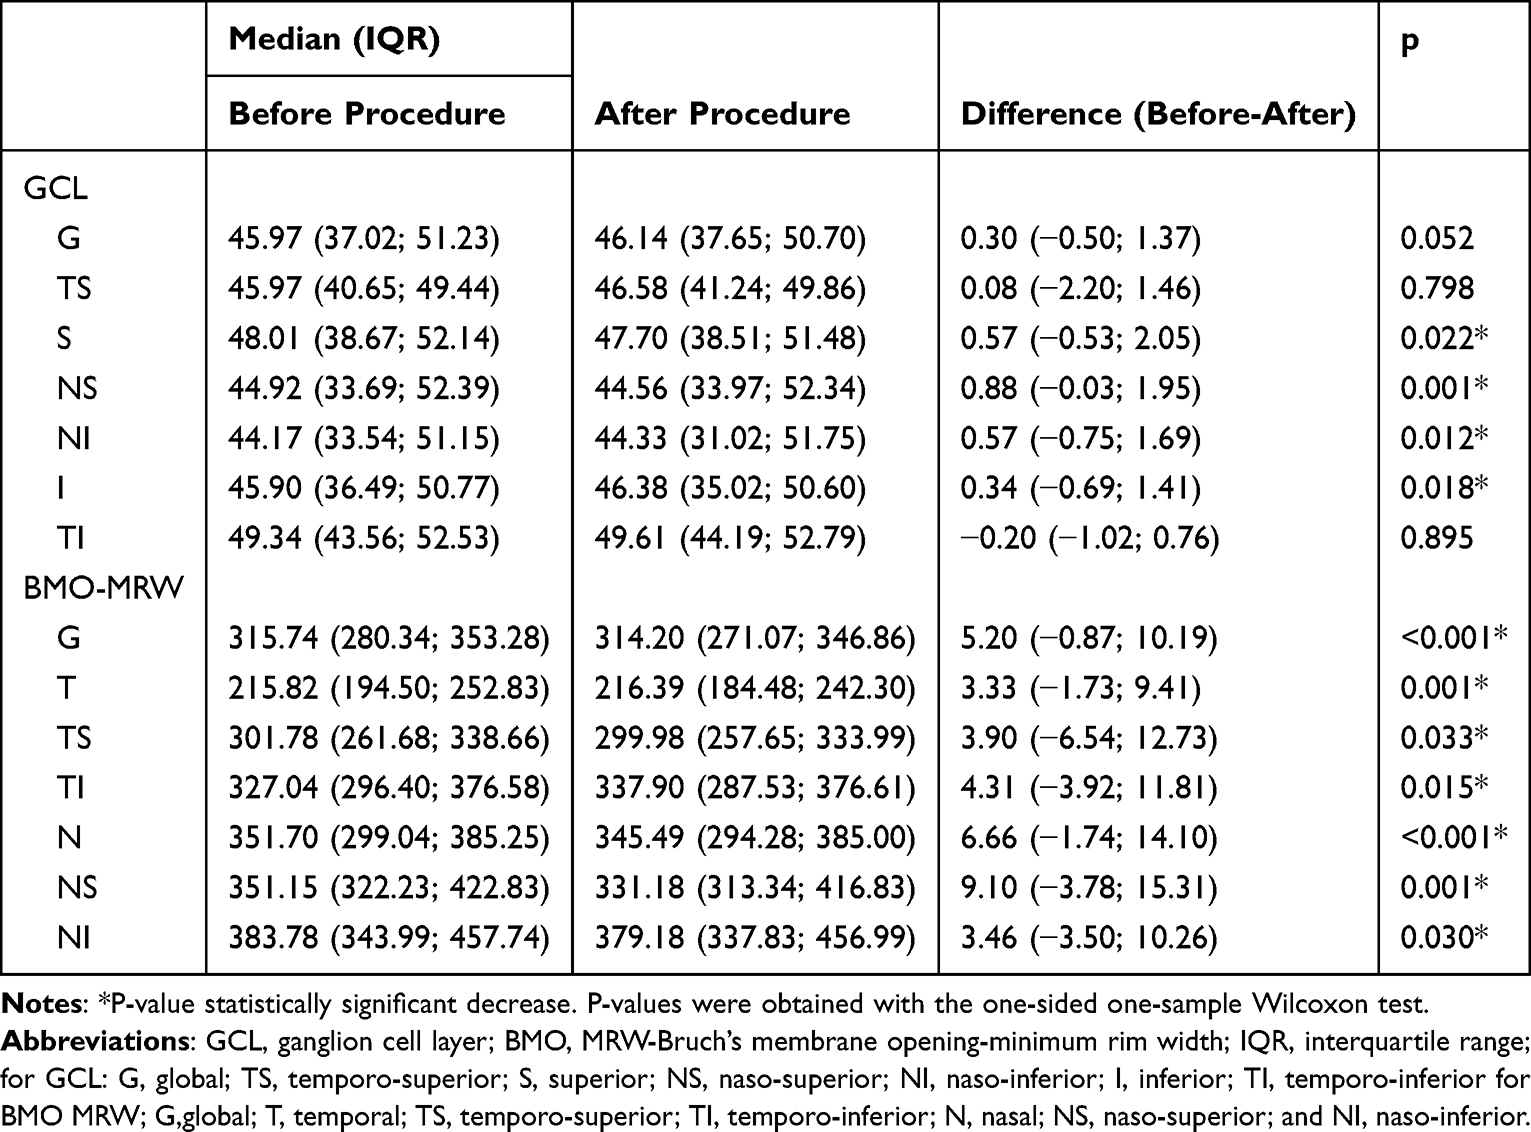 |
Table 4 Comparison of GCL and BMO-MRW (All Segments) Before and After Procedure, n = 48 Eyes |
Visual Acuity
The median preoperative ETDRS score was 84 (IQR 77–88), and the postoperative score was 88 (IQR 80–90) (Figure 1). The median visual acuity gain (postoperative minus preoperative score) was 4 (IQR 0–6), and this change was statistically significant (one-sided Wilcoxon signed-rank test, p < 0.001). A statistically significant positive correlation between RNFL values and visual gain was found only in the TS sector of the 4.7 mm circle (p = 0.018) (Table 5). No statistically significant correlation was found between visual gain and greater/lesser declines in either GCL or BMO-MRW in any sector (Table 6). A statistically significant negative correlation between the difference between preoperative and normative RNFL and postoperative visual gain was found: in the 3.5 mm circle - sectors G, T, TS, TI, NI (p =0.014–0.046), in the 4.1 mm circle - sectors G, T, TS, TI (p = 0.005–0.011), in the 4.7 mm circle - sectors G, T, TS, TI (p = 0.014–0.018) (Table 7). A statistically significant negative correlation between the difference between preoperative and normative GCL and postoperative visual gain was found in the following sectors: G, TS, S, NS, I, TI (p = 0.009–0.022) (Table 8). Neither a positive nor a negative correlation was found between the difference between preoperative and normative BMO-MRW and postoperative visual gain (Table 8).
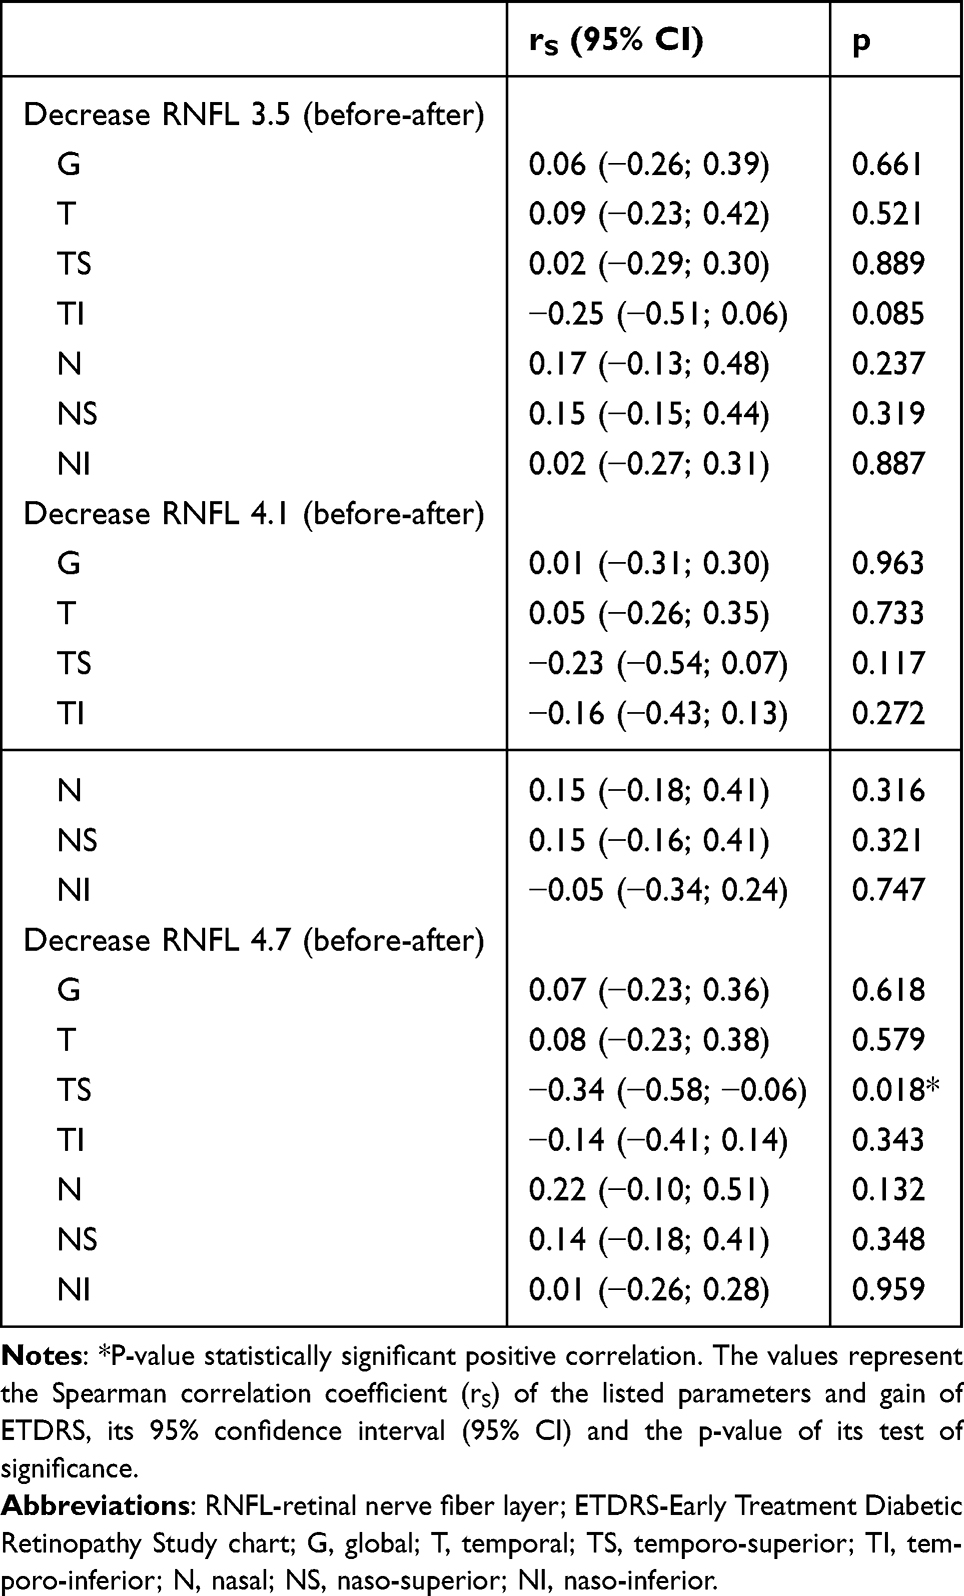 |
Table 5 Analysis of Relationship Between Gain of ETDRS (Difference After-Before Procedure) and RNFL Decrease (3.5 mm, 4.1 mm and 4.7 mm, All Segments, Before-After Procedure), n = 48 Eyes |
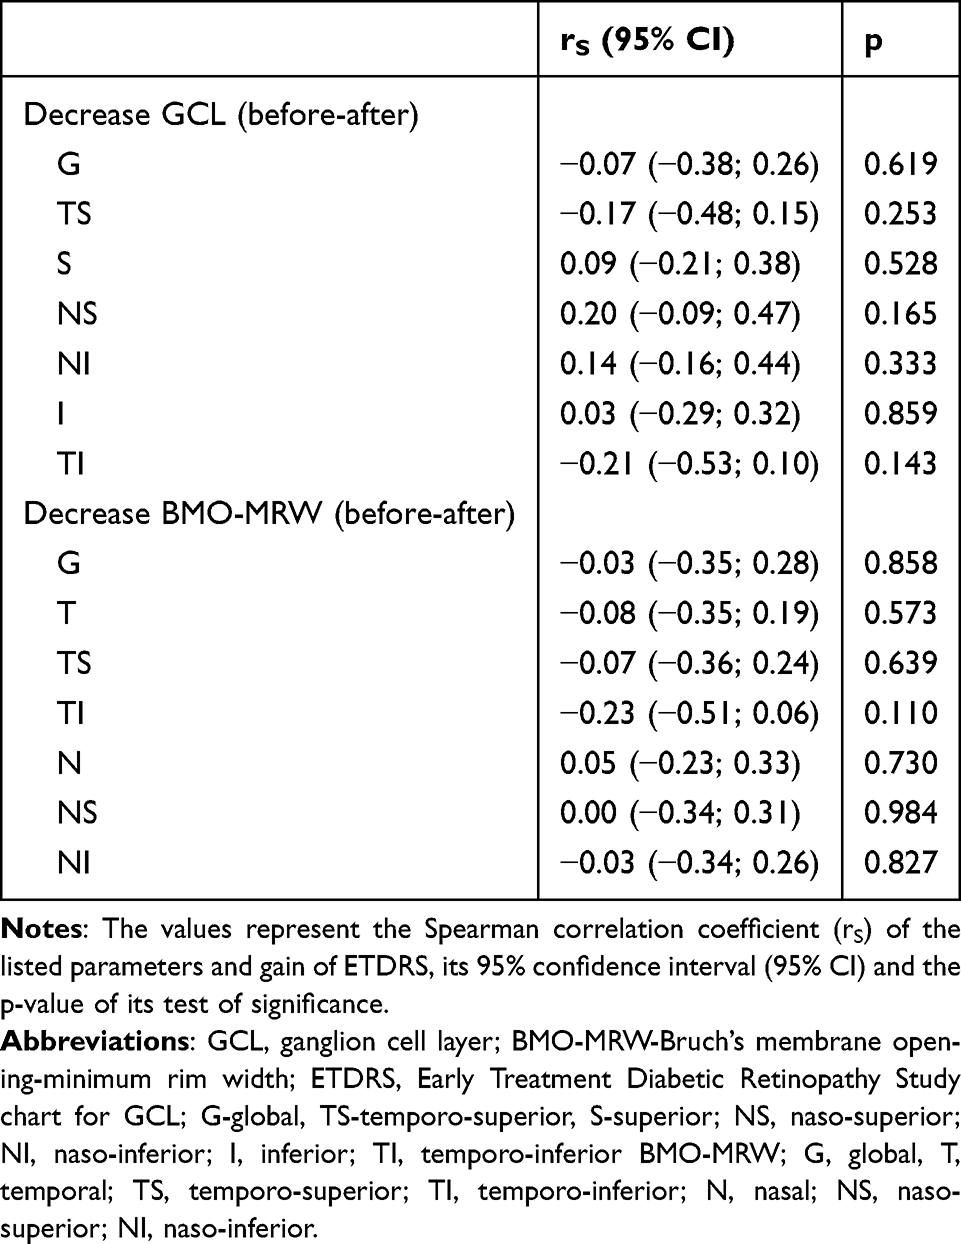 |
Table 6 Analysis of Relationship Between Gain of ETDRS (Difference After-Before Procedure) and GCL and BMO-MRW Decrease (All Segments, Before-After Procedure), n = 48 Eyes |
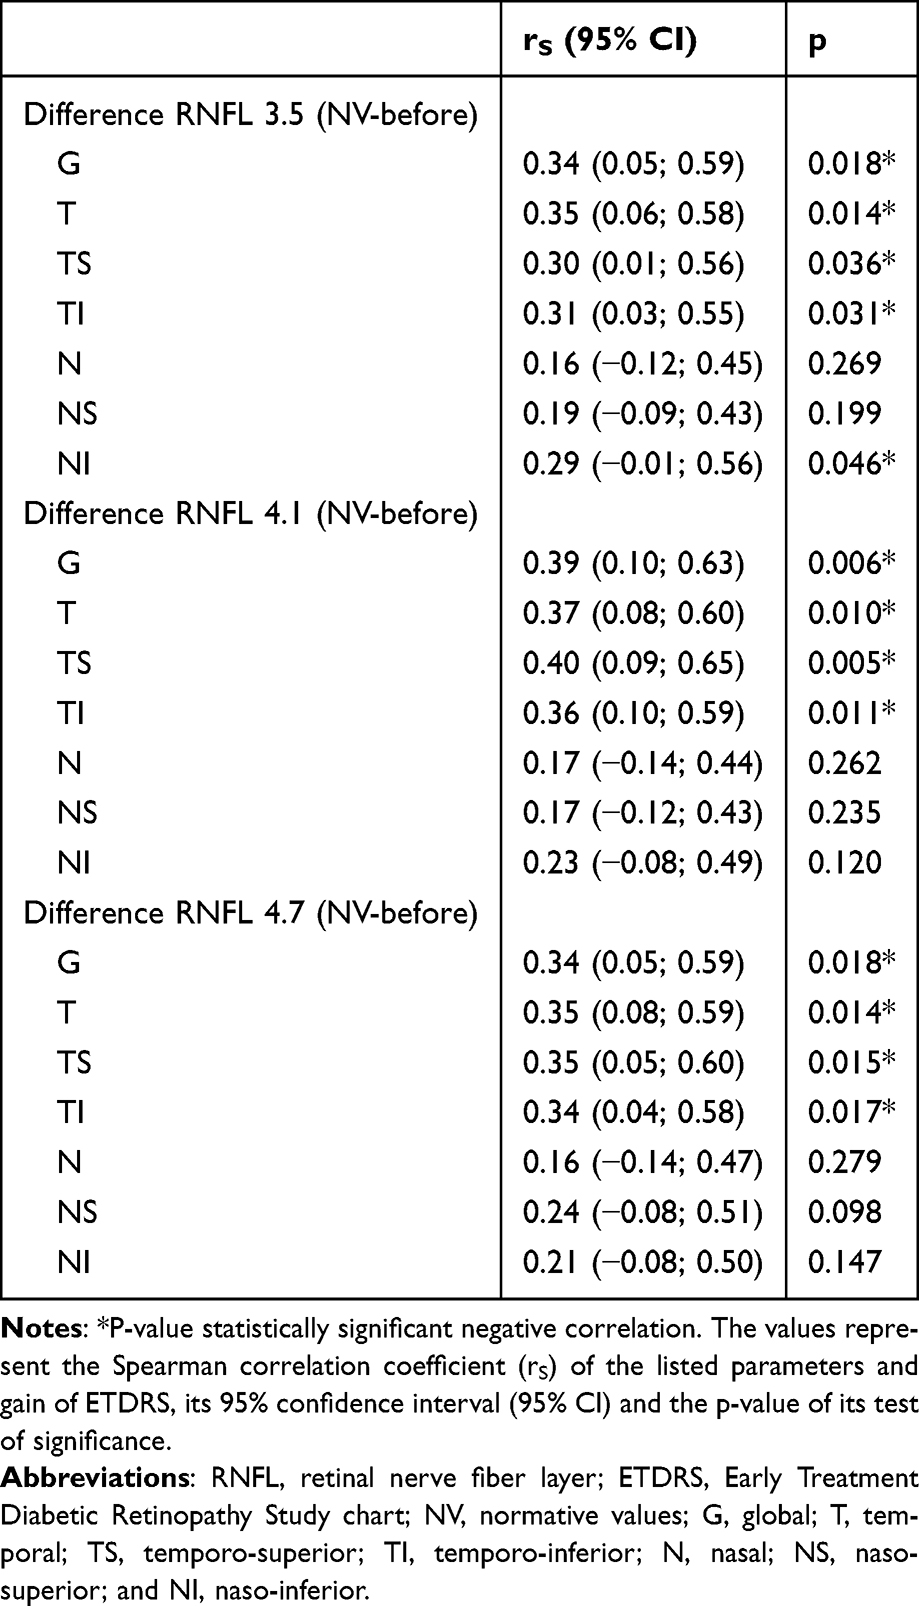 |
Table 7 Analysis of Relationship Between Gain of ETDRS (Difference After-Before Procedure) and Difference Between Preoperative RNFL and Normative Values (3.5 mm, 4.1 mm and 4.7 mm, All Segments, NV – Before Procedure), n = 48 Eyes |
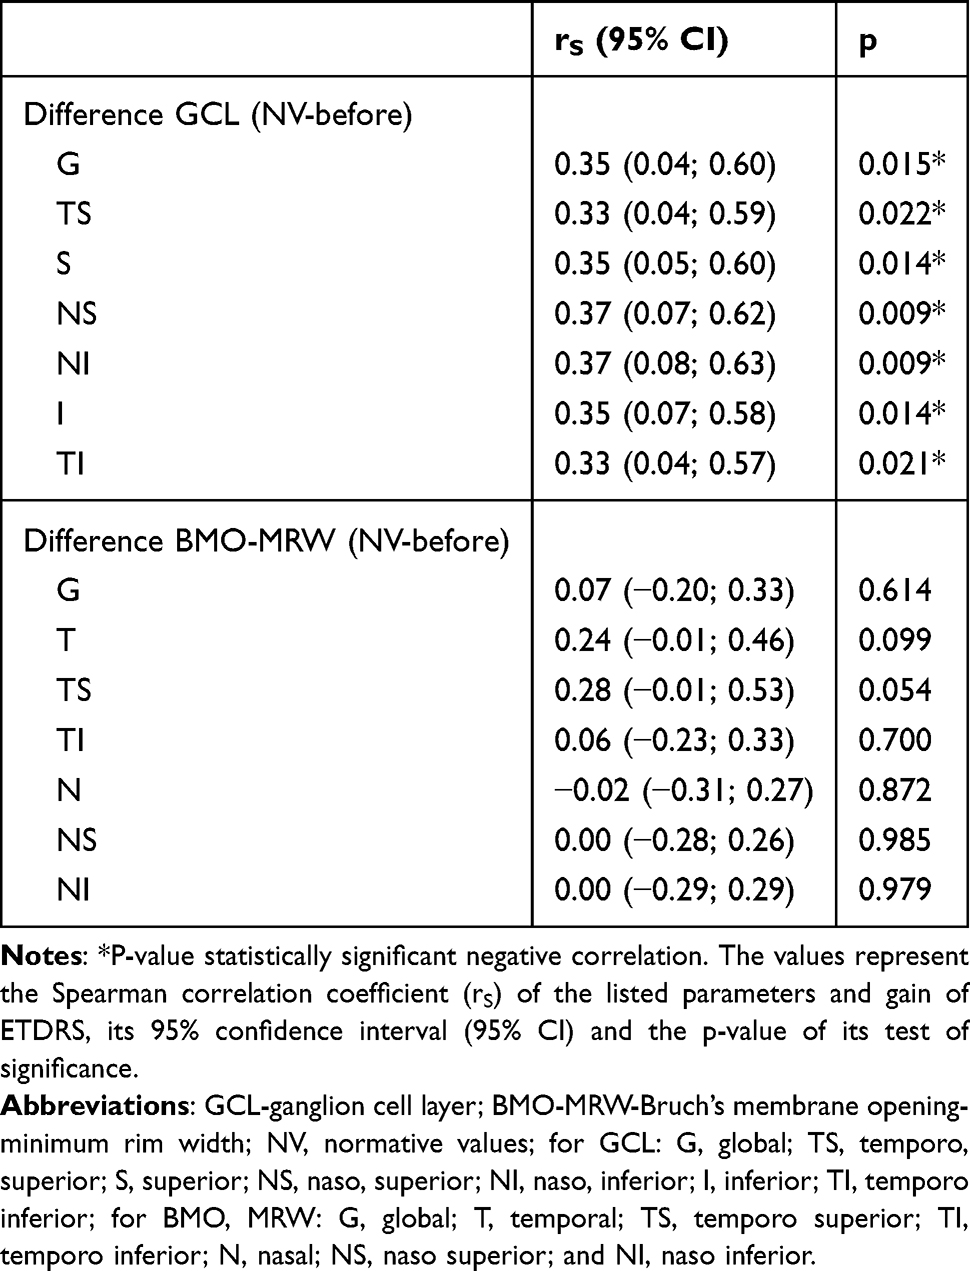 |
Table 8 Analysis of Relationship Between Gain of ETDRS (Difference After-Before Procedure) and Difference Between Preoperative GCL and BMO-MRW and Normative Values (All Segments, NV – Before Procedure), n = 48 Eyes |
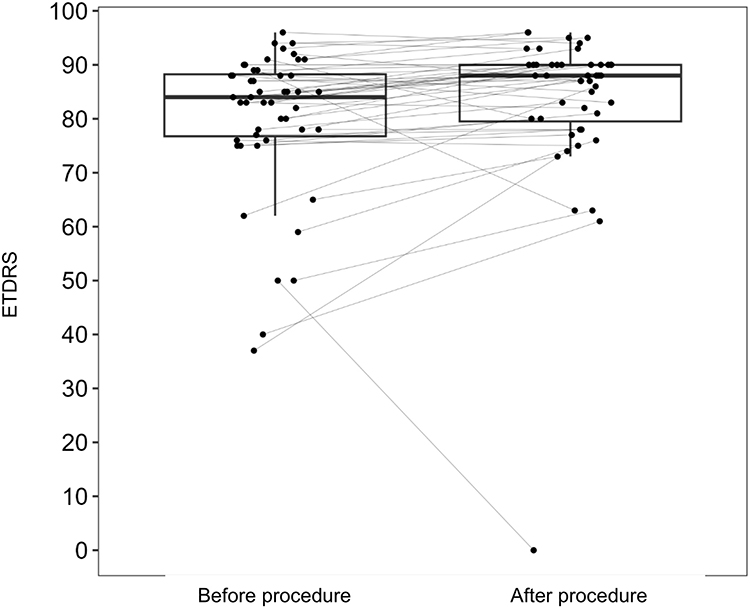 |
Figure 1 Paired boxplot for ETDRS before and after procedure. Abbreviations: ETDRS, Early Treatment Diabetic Retinopathy Study chart. |
Discussion
The number of patients included corresponds to the established inclusion/exclusion criteria, and the equal gender distribution contributes to the consistency of the data. To our knowledge, this is the fifth prospective study on the topic.10–13 The median age of 62 years is slightly higher than that reported in other studies.6 In terms of follow-up duration, studies with up to 3 months of follow-up—consistent with our study—can be found in the literature.14,15 At least one study includes a one-year follow-up period.12 In our current experience, shorter follow-up improves patient adherence and data consistency. The study timeframe was deliberately chosen to include a longer postoperative interval for outcome assessment, as the primary focus was on OCT parameters, and by three months after surgery the healing process was expected to be complete. A longer follow-up in the future increases the risk of tumor recurrence, which could compromise a part of the data. The classification of adenomas by size and direction of expansion is based on our institutional practice. Tumor size may also be assessed by vertical height or by evaluating its anatomical relationship with the optic chiasm.6 Numerous papers have addressed the relationship between pituitary adenomas and RNFL and GCL. Some studies examine only the preoperative condition.16 Others compare RNFL and GCL with each other.6 Only a few studies analyze preoperative and postoperative parameters.17 Only one study was found that also compares RNFL and GCL values to a normative database.10
RNFL
In our study, we observed statistically significant preoperative deviations from normative RNFL values-both positive and negative-in the temporal and nasal sectors across all three circle diameters, consistent with literature findings.18,19 Several authors highlight the temporal sectors as showing the most pronounced RNFL thinning.19,20 Postoperatively, we recorded statistically significant RNFL thinning in all sectors except TI and NI in the 4.1 mm and 4.7 mm circles. Some authors did not observe significant RNFL decline after surgery.14,20 Literature on RNFL decline postoperatively is relatively scarce.10,21 There are even studies describing postoperative RNFL elevation.17 To our knowledge, no other study has analyzed RNFL values across multiple peripapillary circle diameters, which we believe enhances the precision of structural assessment.
GCL
The statistically significant preoperative reduction in GCL across all quadrants in our data matches previous findings in the literature.21 We found a study that similarly reports postoperative GCL decline.11
RNFL versus GCL
Views on the interrelationship between RNFL and GCL are evolving and should always consider the underlying disease. It appears that in pituitary adenomas, GCL tends to atrophy more aggressively than RNFL. We did not find a corresponding report in the literature supporting this observation. However, this may simply reflect insufficient follow-up duration, which could fail to capture gradual RNFL atrophy similar to GCL.
BMO-MRW
Several studies have investigated BMO-MRW in relation to non-glaucomatous optic neuropathies.7,22,23 However, to the best of our knowledge, no work has assessed BMO-MRW in the context of pituitary adenomas. Our findings show that preoperative BMO-MRW thinning in temporal and nasal sectors follows a similar trend as RNFL changes and reflects the “band atrophy” pattern described in lesions compressing the chiasm.24 In our data, preoperative BMO-MRW thinning correlates with RNFL thinning in temporal and nasal sectors. Correlation with GCL sectors, however, was observed only nasally. Postoperative BMO-MRW decline mirrors RNFL and GCL changes, but again GCL correlation is limited to nasal sectors. While BMO-MRW is an established marker in glaucomatous neuropathy, its role in non-glaucomatous optic neuropathies is growing.7 It has already been shown that BMO-MRW does not significantly change in RNFL atrophy caused by non-arteritic ischemic optic neuropathy.25 To date, it remains unclear how BMO-MRW behaves in compressive lesions of the prechiasmal and chiasmal optic pathway. Some studies report no significant correlation between RNFL and BMO-MRW in these cases.23 In our opinion, the value of BMO-MRW may lie in its ability to capture remodeling of the optic disc after RNFL loss, providing a kind of 3D perception of the optic disc. Its specific clinical applications, however, require further study. We refined the interpretation of BMO-MRW with respect to sex and age, and the analysis showed that neither sex nor age acted as a confounding variable.
We attribute the observed postoperative decline in RNFL, GCL, and BMO-MRW to residual post-compressive neurodegeneration continuing as part of the healing process after surgery. We consider the minor positive deviations of RNFL, GCL, and BMO-MRW relative to the normative database to reflect the broader physiological variability of these parameters. Nevertheless, for the comparison with the normative database we found it more appropriate in this pilot study to use a two-sided one-sample Wilcoxon test rather than a one-sided test.
Visual Functions
In this study, BCVA was assessed using ETDRS optotypes. Only one study was found in the literature using ETDRS to assess vision in patients with pituitary adenomas.15 We observed a statistically significant improvement in BCVA after surgery, which aligns with published findings.4 We believe that our use of actual ETDRS chart reading provides greater accuracy compared to studies relying on converted decimal values. Our analysis showed that visual improvement (ETDRS) does not significantly correlate with greater or lesser RNFL decline over time—except in the TS sector of the 4.7 mm circle, where a negative correlation between RNFL decline and vision gain was observed. Similar findings have been reported by other authors.26 We also demonstrated that lower preoperative RNFL values, particularly in the temporal quadrants, are associated with greater visual improvement postoperatively. This negative correlation has already been described.10 This knowledge supports performing surgery even when optic nerve head atrophy is already present. The correlation between visual functions and temporal RNFL sectors is mentioned in multiple studies.18 Our data showed no significant correlation between BCVA improvement and the magnitude of GCL decline over time. At least one study indirectly supports this conclusion.27 However, we did find a negative correlation between preoperative GCL values and postoperative vision gain. A direct correlation of this nature has not been documented in the current body of literature, to the best of our knowledge. Generally, there is a strong traditional reliance on perimetry as the gold standard for assessing visual function in pituitary adenomas. While visual field testing provides valuable information, it can be affected by patient cooperation, which often reduces test validity. In contrast, vision gain following decompression of the visual pathway may reflect rapid postoperative axoplasmic transport improvement—even when GCL and RNFL values are low—explaining significant vision gains despite advanced thinning.26 In our study, the negative correlation between RNFL and GCL deviations from normative values and postoperative visual gain was significant primarily in temporal sectors for RNFL and in both temporal and nasal sectors for GCL. Conversely, no such negative correlation was found between preoperative BMO-MRW and vision gain. Analysis showed that BCVA improvement did not significantly correlate with greater or lesser BMO-MRW decline over time.
The major strength of our study is its prospective design and the assessment of the BMO-MRW parameter with accompanying auxiliary data (age, sex). According to our literature review, this is the first study to explore the relationship between pituitary adenomas and the BMO-MRW parameter.
Our study has several limitations. First is the small sample size and limited number of parameter measurements (due to a shorter follow-up), which constrain more robust statistical analyses, especially regarding inter-parameter relationships. Acute postoperative measurements were not included, as their interpretation could be confounded by the healing process. Additionally, perimetric testing was excluded due to technical issues with data export and the heterogeneity of results, which made them unsuitable for statistical analysis.
Conclusion
In our prospective study, we confirmed that the compressive nature of pituitary adenomas leads to dominantly negative deviations in RNFL, GCL, and, newly, in BMO-MRW parameters compared to the normative database. We ascribe the significant decline in these values after uncomplicated surgery to residual neurodegeneration occurring as part of the postoperative healing process. However, this decline does not appear to have a substantial impact on postoperative visual acuity, which in most cases improved beyond preoperative levels. We also demonstrated a statistically significant negative correlation between preoperative levels of RNFL and GCL and postoperative visual improvement, which has important clinical implications. We demonstrated that the BMO-MRW parameter is a solid marker of compressive neuropathy, though the pathophysiology is still not clear. Our data also suggest a potential relationship between RNFL, GCL, and BMO-MRW, although further studies are necessary to accurately describe these associations over longer follow-up periods.
Acknowledgments
The authors acknowledge the technicians of the Clinic of Ophthalmology at University Hospital Ostrava for their assistance with the instrumental assessments.
Funding
The authors received no financial support or sponsorship for this work.
Disclosure
The authors report no conflicts of interest in this work.
References
1. Li Y, Ren X, Gao W, et al. The biological behavior and clinical outcome of pituitary adenoma are affected by the microenvironment. CNS Neurosci Ther. 2024;30(5):e14729. doi:10.1111/cns.14729
2. Tritos NA, Miller KK. Diagnosis and management of pituitary adenomas: a review. JAMA. 2023;329(16):1386–1398. doi:10.1001/jama.2023.5444
3. Netuka D, Masopust V, Beneš V. Léčba adenomů hypofýzy [Treatment of pituitary adenomas]. Cesk Slov Neurol N. 2011;74(3):240–253.
4. Dusick JR, Esposito F, Mattozo CA, Chaloner C, McArthur DL, Kelly DF. Endonasal transsphenoidal surgery: the patient’s perspective—survey results from 259 patients. Surg Neurol. 2006;65(4):332–341. doi:10.1016/j.surneu.2005.12.010
5. De Nigris Vasconcellos F, Vilela MAD, Garcia Torrico F, et al. Stereotactic radiosurgery for recurrent/residual nonfunctioning pituitary adenoma: a single-arm systematic review and meta-analysis. Acta Neurochir (Wien). 2024;166(1):392. doi:10.1007/s00701-024-06296-4
6. Santorini M, Ferreira De Moura T, Barraud S, et al. Comparative evaluation of two SD-OCT macular parameters (GCC, GCL) and RNFL in chiasmal compression. Eye Brain. 2022;14:35–48. doi:10.2147/EB.S337333
7. Gosalia H, Kumar KM, Karan AK, Saravanan VR, Shah VM. Comparison of glaucomatous from non-glaucomatous optic neuropathy using bruch’s membrane opening minimum rim width optical coherence tomography measurements. Indian J Ophthalmol. 2023;71(8):3005–3009. doi:10.4103/IJO.IJO_3171_22
8. Chauhan BC, O’Leary N, AlMobarak FA, et al. Enhanced detection of open-angle glaucoma with an anatomically accurate optical coherence tomography–derived neuroretinal rim parameter. Ophthalmology. 2013;120(3):535–543. doi:10.1016/j.ophtha.2012.09.055
9. Beck RW, Moke PS, Turpin AH, et al. A computerized method of visual acuity testing: adaptation of the early treatment of diabetic retinopathy study testing protocol. Am J Ophthalmol. 2003;135(2):194–205. doi:10.1016/S0002-9394(02)01825-1
10. Póczoš P, Kremláček J, Česák T, Macháčková M, Jirásková N. Využití optické koherenční tomografie u pacientů s útlakem optického chiasmatu [The use of optical coherence tomography in chiasmal compression]. Cesk Slov Oftalmol. 2019;75(3):120–127. doi:10.31348/2019/3/2
11. Toumi E, Almairac F, Mondot L, et al. Benefit of optical coherence tomography–angiography in patients undergoing transsphenoidal pituitary adenoma surgery: a prospective controlled study. Diagnostics (Basel). 2024;14(16):1747. doi:10.3390/diagnostics14161747
12. Agarwal R, Jain VK, Singh S, et al. Segmented retinal analysis in pituitary adenoma with chiasmal compression: a prospective comparative study. Indian J Ophthalmol. 2021;69(9):2378–2384. doi:10.4103/ijo.IJO_2086_20
13. Singha S, Beniwal M, Mailankody P, et al. Role of optical coherence tomography in predicting visual outcome after surgery for sellar and supra-sellar tumors. Neurol India. 2024;72(1):50–57. doi:10.4103/neurol-india.Neurol-India-D-23-00654
14. Iqbal M, Irfan S, Goyal JL, Singh D, Singh H, Dutta G. An analysis of retinal nerve fiber layer thickness before and after pituitary adenoma surgery and its correlation with visual acuity. Neurol India. 2020;68(2):346–351. doi:10.4103/0028-3886.280634
15. Thammakumpee K, Buddawong J, Vanikieti K, Jindahra P, Padungkiatsagul T. Preoperative peripapillary retinal nerve fiber layer thickness as the prognostic factor of postoperative visual functions after endoscopic transsphenoidal surgery for pituitary adenoma. Clin Ophthalmol. 2022;16:4191–4198. doi:10.2147/OPTH.S392987
16. Pang Y, Tan Z, Chen X, et al. Evaluation of preoperative visual pathway impairment in patients with non-functioning pituitary adenoma using diffusion tensor imaging coupled with optical coherence tomography. Front Neurosci. 2023;17:1057781. doi:10.3389/fnins.2023.1057781
17. Moon JS, Shin SY. Segmented retinal layer analysis of chiasmal compressive optic neuropathy in pituitary adenoma patients. Graefes Arch Clin Exp Ophthalmol. 2020;258(2):419–425. doi:10.1007/s00417-019-04560-3
18. Nair SS, Varsha AS, Hegde A, et al. Correlation of pre-operative and post-operative retinal nerve fibre layer thickness with visual outcome following decompression of pituitary macroadenoma. Clin Neurol Neurosurg. 2024;244:108446. doi:10.1016/j.clineuro.2024.108446
19. Danesh-Meyer HV, Carroll SC, Foroozan R, et al. Relationship between retinal nerve fiber layer and visual field sensitivity as measured by optical coherence tomography in chiasmal compression. Invest Ophthalmol Vis Sci. 2006;47(11):4827–4835. doi:10.1167/iovs.06-0327
20. Danesh-Meyer HV, Wong A, Papchenko T, et al. Optical coherence tomography predicts visual outcome for pituitary tumors. J Clin Neurosci. 2015;22(7):1098–1104. doi:10.1016/j.jocn.2015.02.001
21. Moon CH, Hwang SC, Ohn YH, Park TK. The time course of visual field recovery and changes of retinal ganglion cells after optic chiasmal decompression. Invest Ophthalmol Vis Sci. 2011;52(11):7966–7973. doi:10.1167/iovs.11-7450
22. Boussion F, Guindolet D, Deschamps R, Lamirel C, Vignal-Clermont C. Retinal nerve fiber layer thickness/minimum rim width ratio differentiates glaucoma from other optic neuropathies. J Glaucoma. 2023;32(5):435–441. doi:10.1097/IJG.0000000000002150
23. Braga J, Soares R, Loureiro M, Ribeiro L, Meira D. Bruch’s membrane opening minimum rim width in the differential diagnosis of optic neuropathies. Neuroophthalmology. 2019;44(2):76–88. doi:10.1080/01658107.2019.1650075
24. Ueda K, Kanamori A, Akashi A, Matsumoto Y, Yamada Y, Nakamura M. Evaluation of the distribution pattern of the circumpapillary retinal nerve fibre layer from the nasal hemiretina. Br J Ophthalmol. 2015;99(10):1419–1423. doi:10.1136/bjophthalmol-2014-306100
25. Resch H, Mitsch C, Pereira I, et al. Optic nerve head morphology in primary open-angle glaucoma and nonarteritic anterior ischaemic optic neuropathy measured with spectral domain optical coherence tomography. Acta Ophthalmol. 2018;96(8):e1018–e1024. doi:10.1111/aos.13804
26. Kawaguchi T, Ogawa Y, Tominaga T. Retinal nerve fiber layer thickness measurement for predicting visual outcome after transsphenoidal surgery: optic disc atrophy is not the deciding indicator. World Neurosurg. 2019;127:e427–e435. doi:10.1016/j.wneu.2019.03.143
27. Banc A. The role of optical coherence tomography angiography in the evaluation of chiasmal and retrochiasmal compression. Neuroophthalmology. 2024;48(5):315–327. doi:10.1080/01658107.2024.2338411
 © 2025 The Author(s). This work is published and licensed by Dove Medical Press Limited. The
full terms of this license are available at https://www.dovepress.com/terms
and incorporate the Creative Commons Attribution
- Non Commercial (unported, 4.0) License.
By accessing the work you hereby accept the Terms. Non-commercial uses of the work are permitted
without any further permission from Dove Medical Press Limited, provided the work is properly
attributed. For permission for commercial use of this work, please see paragraphs 4.2 and 5 of our Terms.
© 2025 The Author(s). This work is published and licensed by Dove Medical Press Limited. The
full terms of this license are available at https://www.dovepress.com/terms
and incorporate the Creative Commons Attribution
- Non Commercial (unported, 4.0) License.
By accessing the work you hereby accept the Terms. Non-commercial uses of the work are permitted
without any further permission from Dove Medical Press Limited, provided the work is properly
attributed. For permission for commercial use of this work, please see paragraphs 4.2 and 5 of our Terms.