Back to Journals » Clinical Ophthalmology » Volume 13
Structure–Function Correlation Using OCT Angiography And Microperimetry In Diabetic Retinopathy
Authors Alonso-Plasencia M, Abreu-González R ![]() , Gómez-Culebras MA
, Gómez-Culebras MA
Received 26 June 2019
Accepted for publication 18 September 2019
Published 11 November 2019 Volume 2019:13 Pages 2181—2188
DOI https://doi.org/10.2147/OPTH.S220877
Checked for plagiarism Yes
Review by Single anonymous peer review
Peer reviewer comments 2
Editor who approved publication: Dr Scott Fraser
Marta Alonso-Plasencia,1 Rodrigo Abreu-González,1 Mario Alberto Gómez-Culebras2
1Ophthalmology Department, University Hospital of Nuestra Señora de Candelaria, Santa Cruz de Tenerife, Spain; 2Pediatric Surgery Department, University Hospital of Nuestra Señora de Candelaria, Santa Cruz de Tenerife, Spain
Correspondence: Marta Alonso-Plasencia Ophthalmology Department, University Hospital of Nuestra Señora de Candelaria, Calle Álvaro Rodríguez López, 10, Portal B2, Piso 1ºi, Santa Cruz de Tenerife 38003, Spain
Tel +34616034090
Fax +34922600530
Email [email protected]
Purpose: To evaluate macular vasculature in diabetic retinopathy (DR) with optical coherence tomography angiography (OCTA) and to correlate vessel density (VD) with retinal sensitivity (RS) as a way to assess structural and functional findings in DR.
Design: Prospective observational cross-sectional study.
Methods: Diabetic patients with DR but no clinically significant diabetic macular edema (DME) and healthy subjects were included in this study. All of them underwent comprehensive ophthalmic examination, best corrected visual acuity (BCVA), OCTA with RS-3000 Advance AngioScan (Nidek, Gamagori, Japan) and microperimetry with MP-3 (Nidek, Gamagori, Japan). Retinal vascular density measured by OCT angiography in 9 areas was correlated with RS in the same 9 areas by Spearman correlation.
Results: In this study, 50 subjects were enrolled: 25 eyes of diabetic patients with DR and 25 eyes of non-diabetic subjects. Diabetic patients mean age was 51.88±13.62 years; non-diabetic subjects were 43.48±13.42 years. The BCVA was 20/25 in the diabetic group and 20/20 in the non-diabetic group. Mean RS was decreased in the DR group (27.68±2.71 dB) compared to the non-diabetic group (31.68±1.46 dB) (p<0.05) and in the 9 studied areas (p<0.05). Mean VD was decreased in the DR group compared to non-diabetics (p<0.05) and in 7 of the 9 areas (except temporal superior and inferior squares) (p<0.05). Correlations by areas between VD and RS were assessed, we found moderate correlation in the area temporal to the fovea (r=0.501, p=0.01) in the DR group but not in the non-diabetic subjects. There were no other statistical significant correlations with this pattern.
Conclusion: DR without DME results in a retinal VD decreased that might be the cause of a reduction of RS in one of the studied areas. Microangiopathic changes are correlated with microperimetry sensitivity drop in the temporal to the fovea grid but not in the other studied grids.
Keywords: diabetic retinopathy, vessel density, retinal sensitivity
Introduction
Diabetic retinopathy (DR) is a diabetic microvascular complication that affects macular capillaries and the perifoveal anastomotic arcades.1
New technologies for diagnostic purposes can help us to a better understanding of DR evolution and prognosis for visual function. Currently, optical coherence tomography angiography (OCTA) allows us to assess retinal plexuses, separate them and quantify the vessel density (VD) in each of them.2 OCTA can detect the characteristics of the deep capillary plexus, visualizing separately, which means an advantage over fluorescein angiography, since there are studies that relate the damage in this structure to the first signs of DR,3,4 and with the DR progression.5–8
Macular ischemia in advanced stages determines a poor visual prognosis,9 however, in the large spectrum of DR severity, the relationship between the diffuse damage of the different vascular plexuses and their functional repercussion in visual acuity (VA) and retinal sensitivity (RS) is still unknown. Microperimetry allows an accurate topographic correlation between anatomical lesions in the fundus and corresponding visual function impairment.10 This perimetry with funduscopic control defines the RS according to the different thresholds of light that a subject is able to detect at each point of the retina. Microperimetry shows a positive correlation with retinography and autofluorescence in DR,11 and with OCT in diabetic maculopathy.12,13
The aim of our study is to evaluate the VD in patients with DR without macular edema compared to healthy controls and furthermore, to study if there is a relationship with microperimetry.
Materials And Methods
A Prospective Cross-Sectional Study Was Conducted Between April 2018 And June 2018. The study protocol was approved by Institutional review board of University Hospital Our Lady of Candelaria and follows the tenets of the Declaration of Helsinki. Written informed consent was obtained from all subjects.
Inclusion criteria were subjects with DR without DME, with best corrected visual acuity (BCVA) of 0.2 or better in Snellen eye chart, age over 18 years old, spherical equivalent less than five diopters, no significant media opacities or other pathology that could interfere in RS. Exclusion criteria were macular laser in the past, treatment with antiangiogenic intravitreal therapies in the previous 3 months or dexamethasone implant in the previous 6 months. Normal control eyes were obtained from contralateral eyes of unilateral eye diseases, from patient companions and from health care providers.
All subjects underwent comprehensive ophthalmic examination including BCVA, and anterior and posterior slit-lamp biomicroscopy. DR severity was graded using indirect ophthalmoscopy examination and retinography. In case of doubt, DR severity and proliferative diabetic retinopathy was confirmed using fluorescence angiography as per physician discretion.
OCTA was obtained by Nidek RS-3000 Advance 2 AngioScan (Nidek, Gamagori, Japan) using a custom 4.5 mm×4.5 mm acquisition protocol centered in fovea. VD data were collected by areas from the Navis 1.8 software and they correspond to the percentage of the surface that is occupied with vessel and capillaries per area.
Microperimetry was performed in all eyes in mesopic conditions after 5 mins of dark adaptation with the MP-3 (Nidek, Gamagori, Japan). Diabetic patients were examined after tropicamide eye drops instillation, while the healthy subjects’ pupils were bigger than 2.5 mm or they received mydriatic agents.
We designed a protocol of 13 stimulus points to test RS in the 4.5 mm×4.5 mm square centered in the fovea (Figure 1). Our self-designed grid checked in one-point-per-area RS for nine areas and four extra points were added to evaluate the central area deeply (Figure 2). We used a red circle of 1° as fixation target, the background was 31.4 apostilbs luminance, the stimulus size was equivalent to Goldmann III test spot and a 4–2 double staircase strategy.
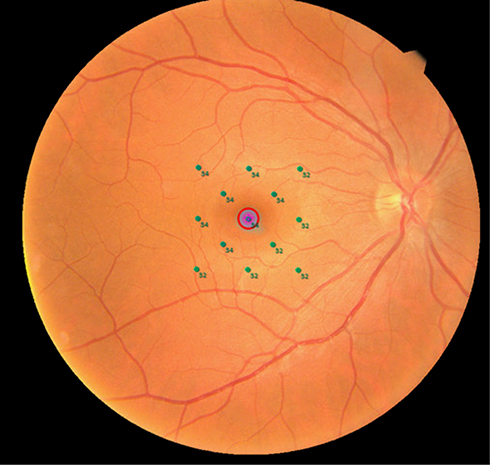 |
Figure 1 Real example of microperimetry performed for the study in a right eye. Microperimetric results of the right eye of a healthy subject. Retinal sensitivity is represented on the studied point in green color by a number and express in decibels. |
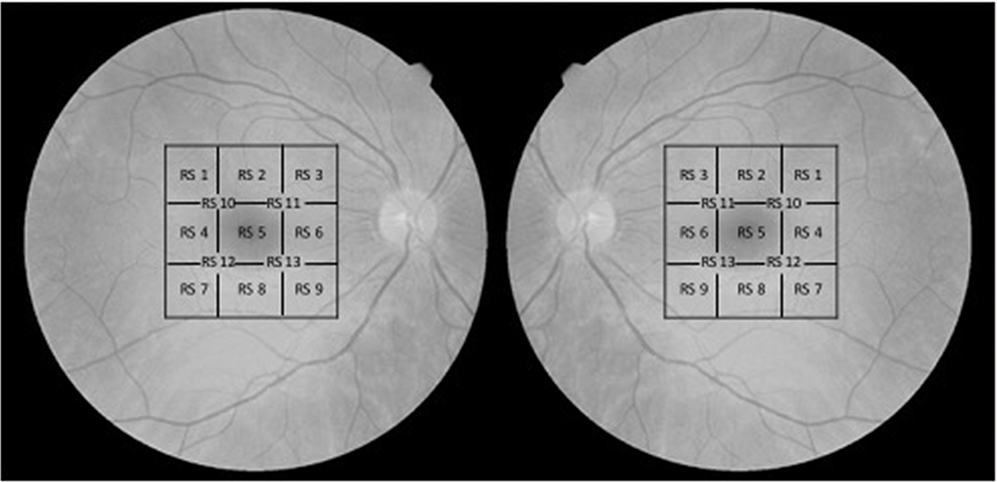 |
Figure 2 Customized 13-points-grid for microperimetry for right and left eyes. Diagram showing the location of each studied point in the microperimetric exam. The microperimetry covers the 4.5×4.5 mm of the central macula. Note that in each area of the macula the grid is named equally to the same grid in the other eye in order to analyze them as the same topographic area. Abbreviation: RS, retinal sensitivity. |
Finally, we correlate VD automatically provided by software in a 9-grid-chart of the superficial and deep plexus (Figure 3) with RS studied in the same nine macular sectors.
 |
Figure 3 Nine-sectors-grid for vessel density measured by OCT-A for right and left eyes. Diagram showing the location of each studied sector in the OCT-A. The exam covers the 4.5×4.5 mm of the central macula. Note that in each area of the macula the grid is named equally to the same grid in the other eye in order to analyze them as the same topographic area. Also, correlation between OCT-A and microperimetry are calculated following this grid. Abbreviation: S, sector. |
Statistical Analysis
Statistical analyses were performed using SPSS, version 22.0 (IBM, Chicago, USA). An alpha error of 5% was chosen. Continuous variables were plotted using t-student test in case of normal distribution and otherwise using the nonparametric Mann–Whitney U-test.
For correlation of VD and RS between both groups Spearman correlation test was used.
Results
Fifty eyes (25 eyes of 25 DR patients without diabetic macular edema (DME) and 25 eyes of 25 subjects) were enrolled in this study. Mean age was 51.88±13.62 years in the diabetic group and 43.48±13.42 years in the control group (p=0.39). Gender distribution was irregular in both groups: 15 males (60%) of diabetic group and 11 males (44%) of the control group.
DR was proliferative DR in 13 patients (52%) and non-proliferative in 12 patients (48%), of this group: 3 patients (12%) suffered from mild DR and 9 (36%) from moderate DR.
Mean Snellen BCVA was 20/25 in diabetic group and 20/20 in the control group, with statistical significant differences between both groups. Patient demographics and clinical characteristics of patients of both groups are shown in Table 1.
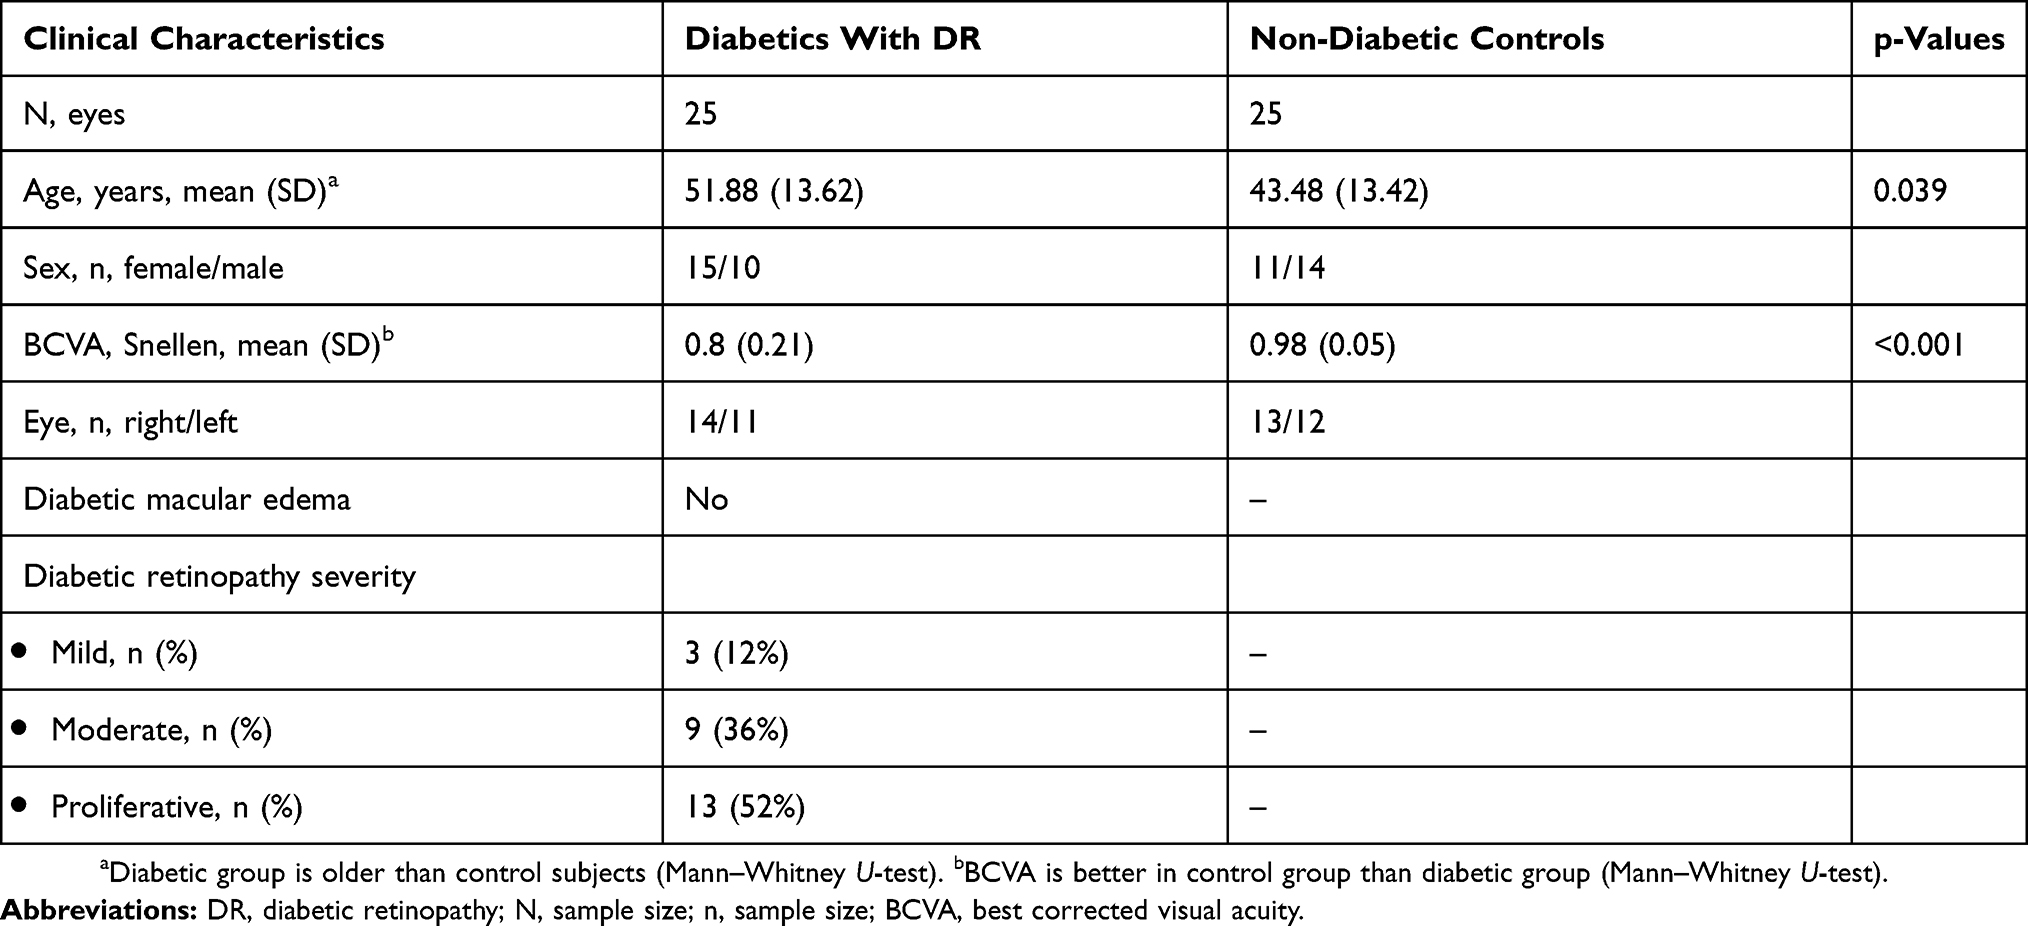 |
Table 1 Patients Demographics And Clinical Characteristics Of Diabetic Patients With Diabetic Retinopathy And Non-Diabetic Controls |
Mean VD in the 4.5 mm×4.5 mm central area for superficial plexus was 17.45 ±2.94% in the DR group and 23.31±3.0% in the healthy controls (p<0.05). Mean VD for the deep plexus was 13.45 ± 2.63% in the DR group and 20.30± 2.4% in the healthy controls (p<0.05). Both plexuses were studied in smaller sectors of 1.5 mm×1.5 mm (Figure 3) and we found statistical significant differences between both groups in 7 of the 9 studied areas (with the exception of temporal-superior (S 1) and temporal-inferior (S 7) areas). In Table 2 are shown VD per areas for the superficial plexus and in Table 3 for the deep plexus.
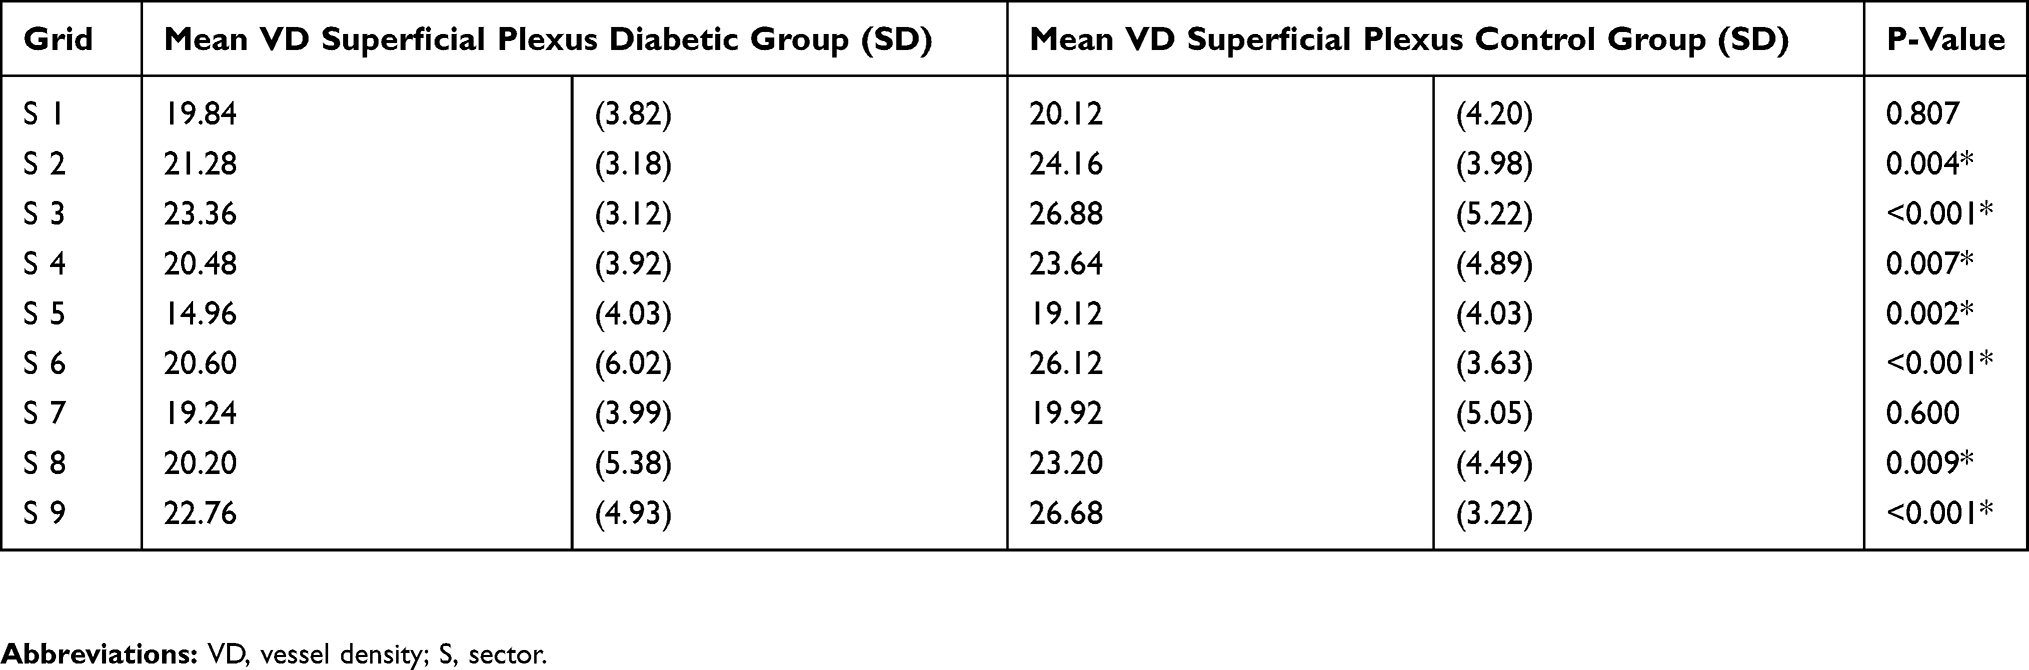 |
Table 2 Vessel Density In Superficial Capillary Plexus In The 9-Areas-Grid In Diabetic Retinopathy And Controls |
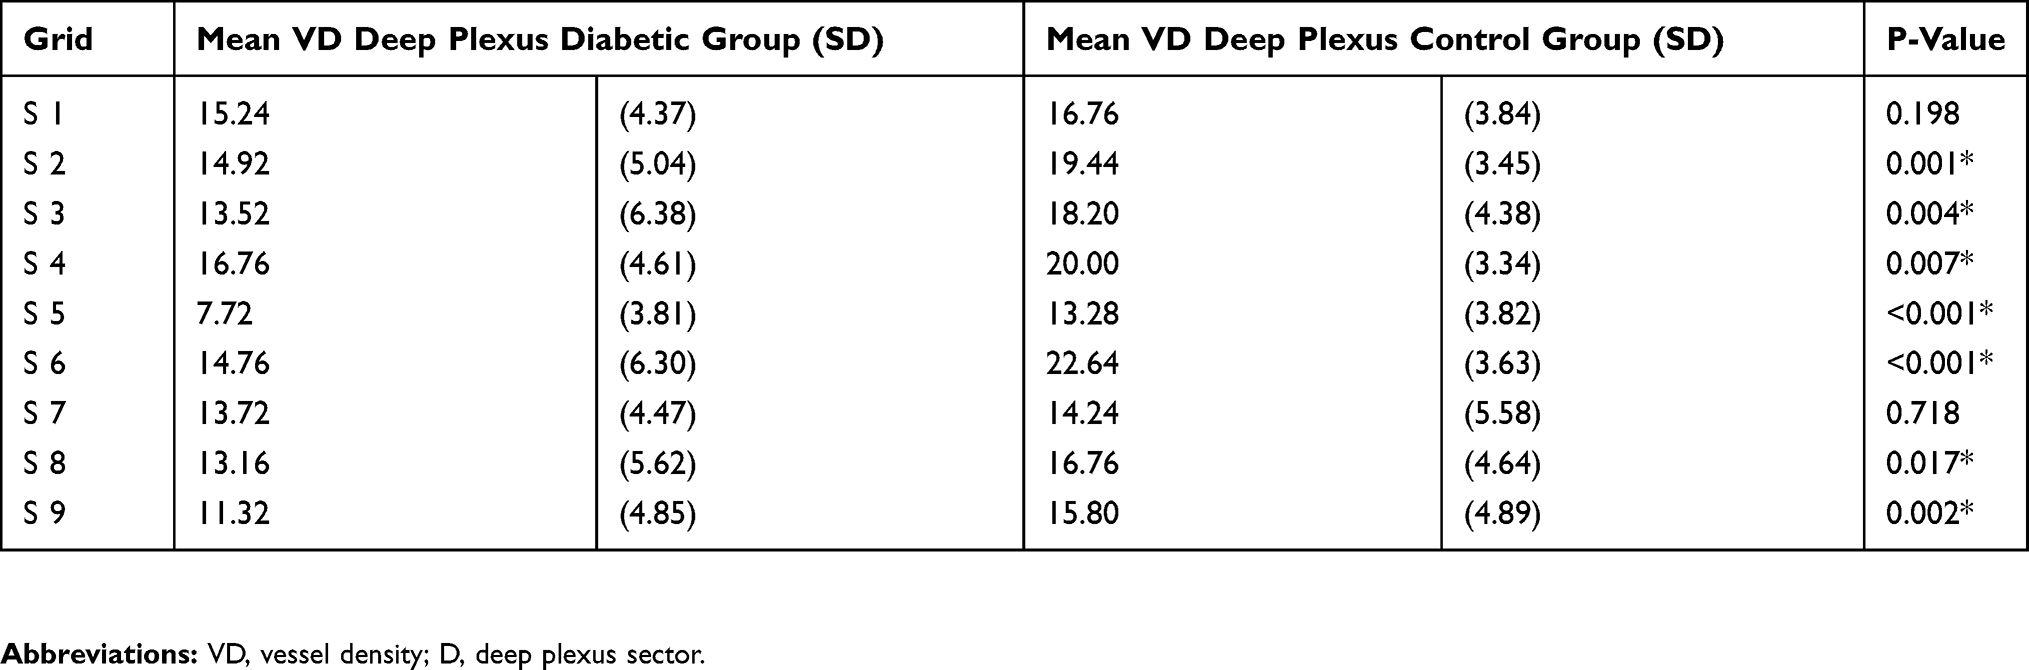 |
Table 3 Mean Vessel Density In Deep Capillary Plexus In The 9-Areas-Grid In Diabetic Retinopathy Group And Healthy Control Group |
Mean RS was 27.68± 2.71 dB in the diabetic group and 31.68±1.46 dB in the control group. Highly significant differences in mean RS were seen in global area and across all the 9 studied areas (p<0.05) (Table 4).
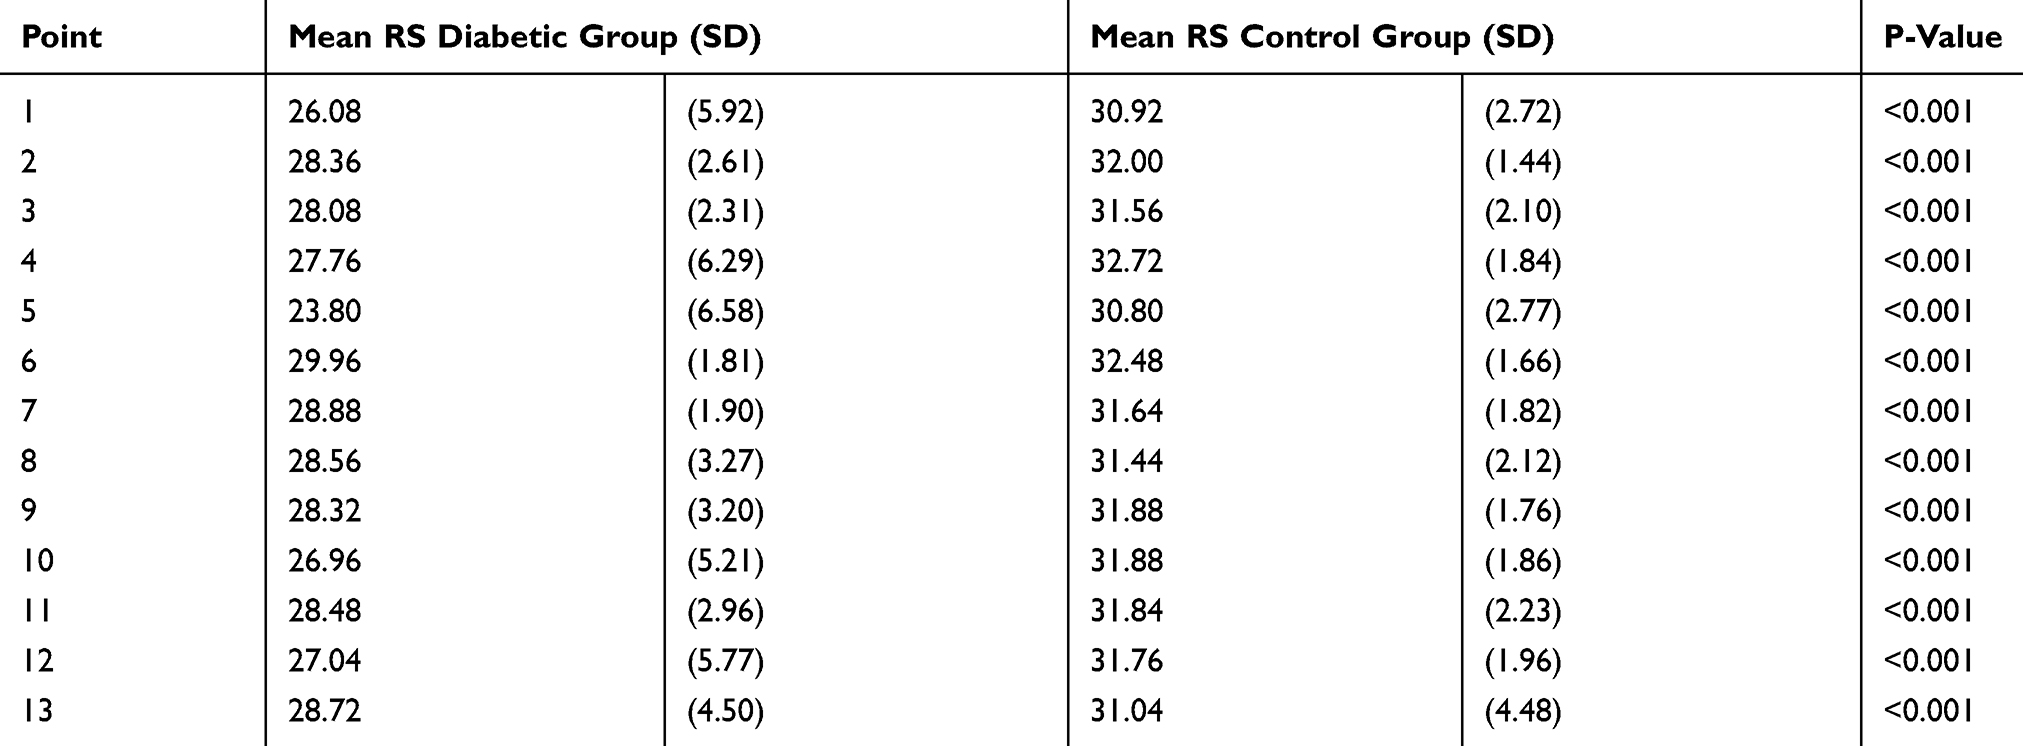 |
Table 4 Mean Retinal Sensitivity In Each Point Of The 13-Points-Grid In Diabetic Retinopathy Group And Control Group |
Correlation between VD and RS in each of the nine areas were calculated for the two plexuses. A moderate correlation in the temporal to fovea area (S 4) (r=0.501, p=0.01) was found in the diabetic group in the deep plexus, but not in the controls. The remaining correlations presented no statistical significant differences.
Discussion
The present study analyzes the VD in the superficial and deep plexuses in healthy subjects and diabetic patients and correlates the capillary drop-out due to diabetic microangiopathy with a decrease in RS measured by microperimetry.
The main interest of our study is that we have related microperimetry with OCTA, something that had not been done before this moment to our knowledge. This correlation examines from the topographic point of view the microvascular damage in the macula of diabetic patients and the repercussion in the function of each area.
There are a small number of publications about microperimetry in DR without macular edema,14 because microperimetry is not a clinical practice test in many countries. However, other macular disorders had been widely studied with microperimetry, for example: age-related macular degeneration,15–20 retinal dystrophies,21–23 myopia24–26 and DME.12,13
Likewise, there is a rising number of publications about OCTA and DR,27 however, nowadays the application of this new technology in clinical practice has still not been settled down. Through the application of image processing and analysis software, OCTA allows us to compare data of the main changes in the macula of diabetics. Recent publications report values of normality of vessels densities in the macula and quantitative parameters of the foveal avascular zone (FAZ) in healthy patients compared with diabetics.28–32 However, the values provided by this new technology depend on the equipment and even the test protocol used.32
DR produces a decrease in capillary vascular mesh in superficial and deep plexuses, which is greater as the severity of DR increases,33–35 and is earlier and more pronounced in the deep plexus than in the superficial one.5,8,27 Similarly, in our report, the mean VD in both plexuses is reduced in patients with DR versus controls. The relationship with the severity of DR has not been analyzed since we do not have a homogeneous distribution of the disease in each of the categories of the DR classification, for instance, 52% of our sample were diagnosed of proliferative DR.
This study provides a topographic point of view of OCTA of the macula, since the new software of our device gives us the global densities and densities divided into nine areas (in a grid of 3×3 cells and in the nine areas of the Early Treatment Diabetic Retinopathy Study diagram). In this way, it provides knowledge about the most affected region of the macula in DR. In our study, we collected data from the grid of 3×3 cells on the protocol of 4.5 mm×4.5 mm. Our data indicate that the loss of capillaries in DR is more pronounced in the nasal and central sectors than in the temporal sectors.
In the past, perifoveal capillary arcade morphology and flow speed were studied with fluorescein angiography, fluorescein videoangiography36 and digital fluorescein angiograms.1 Specifically, in the diabetic eye, it can be found an increase in the area of the FAZ and the intercapillary areas in the perifoveal region.1,34,36 For research purpose, the authors cited below calculated areas using computer tools and thus they obtained quantitative data. However, we have not found a topographic VD analysis, despite that previous reports highlight that the presence of papillomacular ischemia was particularly associated with VA reduction.34
To focus on the correlation between OCTA and microperimetry, we find a statistically significant difference between healthy subjects and diabetic patients in 7 of the 9 areas of both the superficial and deep plexuses and also in all the points of RS studied. However, the correlation between these two tests is weak in 8 of the 9 sectors and only in one sector (temporal to the fovea, S 4) presents a moderate correlation force (r=0.501, p <0.05).
In our study, we measure the functional impairment by microperimetry using a “fast-test”, we explore only one point per sector, as it has already been done previously.37 In this way, we have decreased the test duration but we have subtracted power to detect small scotomas by microperimetry. This may be the reason why our study finds a correlation strength between the two tests lower than we expected and that we only find a medium correlation in one of the nine sectors. Another possible factor that reduces the power of the study is the sample size; however, the fact that most patients with RD have advanced severity degrees of DR may have compensated for this limitation.
In other studies, microperimetry for diabetic maculopathy examination is done with pre-established patterns that study the 20° of central vision.38–40 In contrast, we decided to customize a grid that was superimposable to the OCTA cube of 4.5 mm on each side. We obtained that the mean RS and the RS in each of the 13 studied points was lower in the group of diabetics even though they did not present macular edema.
In clinical practice, VA is used to determine functional damage due to DME; however, this test can be gross and inadequate. Microperimetry is able to detect a decrease in RS in diabetic patients with retinopathy and without macular edema,41 and even without DR.42,43 Likewise, it is able to detect significant differences in RS between a group of pre-diabetics and a group of healthy subjects but is not clear the exact pathophysiological mechanism.44
Frequently, a decreased function (measured by RS or VA) is associated with macular edema.45,46 But there are other disorders that may reduce RS such as, for example, the disruption of the photoreceptor layer in diabetic maculopathy that can be detected with autofluorescence, showing a good correlation with MP in these areas.47,48 A recent study with OCTA indicates that the lack of perfusion of retinal capillaries, particularly those of the deep plexus, is associated with disruption of the photoreceptor inner segment/outer segment layer.49 Therefore, we can conclude that these injuries are related between themselves.
In our protocol, we excluded patients previously treated with macular laser since argon laser decreases RS,37,50 and probably it also modifies VD, although studies about this topic have not been found. Patients with proliferative DR, who had been treated with panretinal photocoagulation in the past, are accepted in the study as this laser does not modify macular perfusion in treated patients.51
In summary, in patients with type 2 diabetes with DR without DME, retinal sensitivities and vessel densities are decreased compared to healthy subjects, proving a statistical significant correlation between microperimetry and OCTA of medium-strength in temporal to the fovea (S 4) area and no statistical significant and weak correlation in the other eight areas. Recent studies find that RS and VD are decreasing according to the severity of RD,33,34,43 so before this study, our hypothesis was that there was a strong correlation between both variables, however the sample size, currently available technology, or microperimetric grid have not been enough powerful to make it evident. Further studies with larger sample sizes are needed to confirm our hypothesis.
Acknowledgments
The results of this publication were partially presented at the European Society of Ophthalmology conference, Nice, 13–16 June 2019.
Disclosure
The authors report no conflicts of interest in this work.
References
1. Arend O, Wolf S, Jung F, et al. Retinal microcirculation in patients with diabetes mellitus: dynamic and morphological analysis of perifoveal capillary network. Br J Ophthalmol. 1991;75(9):514–518. doi:10.1136/bjo.75.9.514
2. Hwang TS, Zhang M, Bhavsar K, et al. Visualization of 3 distinct retinal plexuses by projection-resolved optical coherence tomography angiography in diabetic retinopathy. JAMA Ophthalmol. 2016;134(12):1411–1419. doi:10.1001/jamaophthalmol.2016.4272
3. Carnevali A, Sacconi R, Corbelli E, et al. Optical coherence tomography angiography analysis of retinal vascular plexuses and choriocapillaris in patients with type 1 diabetes without diabetic retinopathy. Acta Diabetol. 2017;54(7):695–702. doi:10.1007/s00592-017-0996-8
4. Yasin Alibhai A, Moult EM, Shahzad R, et al. Quantifying microvascular changes using OCT angiography in diabetic eyes without clinical evidence of retinopathy. Ophthalmol Retina. 2018;2(5):418–427. doi:10.1016/j.oret.2017.09.011
5. Hasegawa N, Nozaki M, Takase N, Yoshida M, Ogura Y. New insights into microaneurysms in the deep capillary plexus detected by optical coherence tomography angiography in diabetic macular edema. Invest Ophthalmol Vis Sci. 2016;57:348–355.
6. Ishibazawa A, Nagaoka T, Takahashi A, et al. Optical coherence tomography angiography in diabetic retinopathy: a prospective pilot study. Am J Ophthalmol. 2015;160:35–44. doi:10.1016/j.ajo.2015.04.021
7. Couturier A, Mané V, Bonnin S, et al. Capillary plexus anomalies in diabetic retinopathy on optical coherence tomography angiography. Retina. 2015;35:2384–2391. doi:10.1097/IAE.0000000000000859
8. Agemy SA, Scripsema NK, Shah CM, et al. Retinal vascular perfusion density mapping using optical coherence tomography angiography in normal and diabetic retinopathy patients. Retina. 2015;35(11):2353–2363. doi:10.1097/IAE.0000000000000862
9. Sim DA, Keane PA, Fung S, et al. Quantitative analysis of diabetic macular ischemia using optical coherence tomography. Invest Ophthalmol Vis Sci. 2014;55(1):417–423. doi:10.1167/iovs.13-12677
10. Kube T, Schmidt S, Toonen F, Kirchhof B, Wolf S. Fixation stability and macular light sensitivity in patients with diabetic maculopathy: a microperimetric study with a scanning laser ophthalmoscope. Ophthalmologica. 2005;219:16–20. doi:10.1159/000081777
11. Midena E, Vujosevic S. Microperimetry in diabetic retinopathy. Saudi J Ophthalmol. 2011;25(2):131–135. doi:10.1016/j.sjopt.2011.01.010
12. Vujosevic S, Midena E, Pilotto E, Radin PP, Chiesa L, Cavarzeran F. Diabetic macular edema: correlation between microperimetry and optical coherence tomography findings. Invest Ophthalmol Vis Sci. 2006;47(7):3044–3051. doi:10.1167/iovs.05-1141
13. Vujosevic S, Torresin T, Berton M, Bini S, Convento E, Midena E. Diabetic macular edema with and without subfoveal neuroretinal detachment: two different morphologic and functional entities. Am J Ophthalmol. 2017;181:149–155. doi:10.1016/j.ajo.2017.06.026
14. Midena E, Bini S. Multimodal retinal imaging of diabetic macular edema: toward new paradigms of pathophysiology. Graefes Arch Clin Exp Ophthalmol. 2016;254(9):1661–1668. doi:10.1007/s00417-016-3361-7
15. Roh M, Laíns I, Shin HJ, et al. Microperimetry in age-related macular degeneration: association with macular morphology assessed by optical coherence tomography. Br J Ophthalmol. 2019. pii:bjophthalmol-2018-313316. doi:10.1136/bjophthalmol-2018-313316
16. Csaky KG, Patel PJ, Sepah YJ, et al. Microperimetry for geographic atrophy secondary to age-related macular degeneration. Surv Ophthalmol. 2019;64(3):353–364. pii:S0039-6257(18)30157-7. doi:10.1016/j.survophthal.2019.01.014
17. Barboni MTS, Récsán Z, Szepessy Z, et al. Preliminary findings on the optimization of visual performance in patients with age-related macular degeneration using biofeedback training. Appl Psychophysiol Biofeedback. 2019;44(1):61–70. doi:10.1007/s10484-018-9423-3
18. Welker SG, Pfau M, Heinemann M, Schmitz-Valckenberg S, Holz FG, Finger RP. Retest reliability of mesopic and dark-adapted microperimetry in patients with intermediate age-related macular degeneration and age-matched controls. Invest Ophthalmol Vis Sci. 2018;59(4):152–159. doi:10.1167/iovs.18-23878
19. Vujosevic S, Pucci P, Casciano M, et al. Long-term longitudinal modifications in mesopic microperimetry in early and intermediate age-related macular degeneration. Graefes Arch Clin Exp Ophthalmol. 2017;255(2):301–309. doi:10.1007/s00417-016-3466-z
20. Reinsberg M, Hilgers RD, Lüdeke I, et al. Testing the clinical value of multifocal electroretinography and microperimetry and the effects of intravitreal therapy with ranibizumab on macular function in the course of wet age-related macular degeneration: a 1-year prospective study. Clin Ophthalmol. 2017;11:621–629. doi:10.2147/OPTH.S123513
21. Chiang WY, Lee JJ, Chen YH, et al. Fixation behavior in macular dystrophy assessed by microperimetry. Graefes Arch Clin Exp Ophthalmol. 2018;256(8):1403–1410. doi:10.1007/s00417-018-4006-9
22. Viana KÍ, Messias A, Siqueira RC, Rodrigues MW, Jorge R. Structure-functional correlation using adaptive optics, OCT, and microperimetry in a case of occult macular dystrophy. Arq Bras Oftalmol. 2017;80(2):118–121. doi:10.5935/0004-2749.20170028
23. Battaglia Parodi M, Castellino N, Iacono P, et al. Microperimetry in best vitelliform macular dystrophy. Retina. 2018;38(4):841–848. doi:10.1097/IAE.0000000000001600
24. Alzaben Z, Cardona G, Zapata MA, Zaben A. Interocular asymmetry in choroidal thickness and retinal sensitivity in high myopia. Retina. 2018;38(8):1620–1628. doi:10.1097/IAE.0000000000001756
25. Raman R, Damkondwar D, Neriyanuri S, Sharma T. Microperimetry biofeedback training in a patient with bilateral myopic macular degeneration with central scotoma. Indian J Ophthalmol. 2015;63(6):534–536. doi:10.4103/0301-4738.162609
26. Parravano M, Oddone F, Giorno P, et al. Influence of macular choroidal thickness on visual function in highly myopic eyes. Ophthalmic Res. 2014;52(2):97–101. doi:10.1159/000362880
27. Khadamy J, Abri Aghdam K, Falavarjani KG. An update on optical coherence tomography angiography in diabetic retinopathy. J Ophthalmic Vis Res. 2018;13(4):487–497. doi:10.4103/jovr.jovr_57_18
28. Kulikov AN, Maltsev DS, Burnasheva MA. Improved analysis of foveal avascular zone area with optical coherence tomography angiography. Graefes Arch Clin Exp Ophthalmol. 2018;256(12):2293–2299. doi:10.1007/s00417-018-4139-x
29. Liu L, Gao J, Bao W, et al. Analysis of foveal microvascular abnormalities in diabetic retinopathy using optical coherence tomography angiography with projection artifact removal. J Ophthalmol. 2018;18(2018):3926745.
30. De Carlo TE, Chin AT, Bonini Filho MA, et al. Detection of microvascular changes in eyes of patients with diabetes but not clinical diabetic retinopathy using optical coherence tomography angiography. Retina. 2015;35(11):2364–2370. doi:10.1097/IAE.0000000000000882
31. Takase N, Nozaki M, Kato A, Ozeki H, Yoshida M, Ogura Y. Enlargement of foveal avascular zone in diabetic eye evaluated by en face optical coherence tomography angiography. Retina. 2015;35(11):2377–2383. doi:10.1097/IAE.0000000000000849
32. La Mantia A, Kurt RA, Mejor S, et al. Comparing fundus fluorescein angiography and swept-source optical coherence tomography angiography in the evaluation of diabetic macular perfusion. Retina. 2019;39(5):926–937. doi:10.1097/IAE.0000000000002045
33. Dimitrova G, Chihara E, Takahashi H, Amano H, Okazaki K. Quantitative retinal optical coherence tomography angiography in patients with diabetes without diabetic retinopathy. Invest Ophthalmol Vis Sci. 2017;58(1):190–196. doi:10.1167/iovs.16-20531
34. Sim DA, Keane PA, Zarranz-Ventura J, et al. The effects of macular ischemia on visual acuity in diabetic retinopathy. Invest Ophthalmol Vis Sci. 2013;54(3):2353–2360. doi:10.1167/iovs.12-11103
35. Sambhav K, Abu-Amero KK, Chalam KV. Deep capillary macular perfusion indices obtained with OCT angiography correlate with degree of non proliferative diabetic retinopathy. Eur J Ophthalmol. 2017;27(6):716–729. doi:10.5301/ejo.5000948
36. Gomez-Ulla F, Wolf S, Reim M. Medición del fluido sanguineo retiniano en la diabetes por medio de un sistema de análisis de imágenes aplicado a la videoangiografía fluoresceínica. Measurement of retinal flow in diabetes by image analysis system applied to fluorescein videoangiography. Studium Ophthalmologicum. 1987;3:13–19.
37. Pearce E, Sivaprasad S, Chong NV. Factors affecting reading speed in patients with diabetic macular edema treated with laser photocoagulation. PLoS ONE. 2014;9(9):e105696. doi:10.1371/journal.pone.0105696
38. Karacorlu M, Ozdemir H, Senturk F, Karacorlu SA, Uysal O. Macular function after intravitreal triamcinolone acetonide injection for diabetic macular oedema. Acta Ophthalmol. 2010;88(5):558–563. doi:10.1111/j.1755-3768.2008.01497.x
39. Mathew R, Pearce E, Muniraju R, Abdel-Hay A, Sivaprasad S. Monthly OCT monitoring of Ozurdex for macular oedema related to retinal vascular diseases: re-treatment strategy (OCTOME Report 1). Eye (Lond). 2014;28(3):318–326. doi:10.1038/eye.2013.287
40. Kothari AR, Raman RP, Sharma T, Gupta M, Laxmi G. Is there a correlation between structural alterations and retinal sensitivity in morphological patterns of diabetic macular edema? Indian J Ophthalmol. 2013;61(5):230–232. doi:10.4103/0301-4738.97081
41. De Benedetto U, Querques G, Lattanzio R, et al. Macular dysfunction is common in both type 1 and type 2 diabetic patients without macular edema. Retina. 2014;34(11):2171–2177. doi:10.1097/IAE.0000000000000205
42. Verma A, Rani PK, Raman R, et al. Is neuronal dysfunction an early sign of diabetic retinopathy? Microperimetry and spectral domain optical coherence tomography (SD-OCT) study in individuals with diabetes, but no diabeticretinopathy. Eye (Lond). 2009;23(9):1824–1830. doi:10.1038/eye.2009.184
43. Nittala MG, Gella L, Raman R, Sharma T. Measuring retinal sensitivity with the microperimeter in patients with diabetes. Retina. 2012;32(7):1302–1309. doi:10.1097/IAE.0b013e3182365a24
44. Al Shafaee M, Shenoy R, Bialasiewicz AA, Ganguly SS, Bhargava K. Macular function in prediabetic and diabetic Omani adults: a microperimetric evaluation. Eur J Ophthalmol. 2011;21(6):771–776. doi:10.5301/EJO.2011.6328
45. Yang XL, Zou HD, Xu X. Correlation of retinal sensitivity, visual acuity and central macular thickness in different types of diabetic macular edema. Zhonghua Yan Ke Za Zhi. 2013;49(12):1081–1088.
46. Okada K, Yamamoto S, Mizunoya S, Hoshino A, Arai M, Takatsuna Y. Correlation of retinal sensitivity measured with fundus-related microperimetry to visual acuity and retinal thickness in eyes with diabetic macular edema. Eye (Lond). 2006;20(7):805–809. doi:10.1038/sj.eye.6702014
47. Shen Y, Liu K, Xu X. Correlation between visual function and photoreceptor integrity in diabetic macular edema: spectral-domain optical coherence tomography. Curr Eye Res. 2016;41(3):391–399. doi:10.3109/02713683.2015.1019003
48. Shen Y, Xu X, Liu K. Fundus autofluorescence characteristics in patients with diabetic macular edema. Chin Med J (Engl). 2014;127(8):1423–1428.
49. Scarinci F, Jampol LM, Linsenmeier RA, Fawzi AA. Association of diabetic macular nonperfusion with outer retinal disruption on optical coherence tomography. JAMA Ophthalmol. 2015;133(9):1036–1044. doi:10.1001/jamaophthalmol.2015.2183
50. Raman R, Santhanam K, Gella L, Pal BP, Sharma T. Morphological and functional outcomes following modified early treatment diabetic retinopathy study laser in diabetic macular edema. Oman J Ophthalmol. 2015;8(2):92–96. doi:10.4103/0974-620X.159252
51. Lorusso M, Milano V, Nikolopoulou E, et al. Panretinal photocoagulation does not change macular perfusion in eyes with proliferative diabetic retinopathy. Ophthalmic Surg Lasers Imaging Retina. 2019;50(3):174–178. doi:10.3928/23258160-20190301-07
 © 2019 The Author(s). This work is published and licensed by Dove Medical Press Limited. The
full terms of this license are available at https://www.dovepress.com/terms
and incorporate the Creative Commons Attribution
- Non Commercial (unported, 3.0) License.
By accessing the work you hereby accept the Terms. Non-commercial uses of the work are permitted
without any further permission from Dove Medical Press Limited, provided the work is properly
attributed. For permission for commercial use of this work, please see paragraphs 4.2 and 5 of our Terms.
© 2019 The Author(s). This work is published and licensed by Dove Medical Press Limited. The
full terms of this license are available at https://www.dovepress.com/terms
and incorporate the Creative Commons Attribution
- Non Commercial (unported, 3.0) License.
By accessing the work you hereby accept the Terms. Non-commercial uses of the work are permitted
without any further permission from Dove Medical Press Limited, provided the work is properly
attributed. For permission for commercial use of this work, please see paragraphs 4.2 and 5 of our Terms.