Back to Journals » Clinical Epidemiology » Volume 10
Strongly enhanced colorectal cancer risk stratification by combining family history and genetic risk score
Authors Weigl K, Chang-Claude J, Knebel P, Hsu L, Hoffmeister M, Brenner H
Received 7 July 2017
Accepted for publication 20 October 2017
Published 19 January 2018 Volume 2018:10 Pages 143—152
DOI https://doi.org/10.2147/CLEP.S145636
Checked for plagiarism Yes
Review by Single anonymous peer review
Peer reviewer comments 3
Editor who approved publication: Professor Henrik Toft Sørensen
Korbinian Weigl,1,2 Jenny Chang-Claude,3,4 Phillip Knebel,5 Li Hsu,6 Michael Hoffmeister,1 Hermann Brenner1,2,7
1Division of Clinical Epidemiology and Aging Research, German Cancer Research Center (DKFZ), Heidelberg, 2German Cancer Consortium (DKTK), German Cancer Research Center (DKFZ), Heidelberg, 3Unit of Genetic Epidemiology, German Cancer Research Center (DKFZ), Heidelberg, 4University Cancer Center Hamburg, University Medical Center Hamburg-Eppendorf, Hamburg, 5Department for General, Visceral and Transplantation Surgery, University Heidelberg, Heidelberg, Germany; 6Public Health Sciences Division, Fred Hutchinson Cancer Research Center, Seattle, WA, USA; 7Division of Preventive Oncology, German Cancer Research Center (DKFZ) and National Center for Tumor Diseases (NCT), Heidelberg, Germany
Background and aim: Family history (FH) and genetic risk scores (GRSs) are increasingly used for risk stratification for colorectal cancer (CRC) screening. However, they were mostly considered alternatively rather than jointly. The aim of this study was to assess the potential of individual and joint risk stratification for CRC by FH and GRS.
Patients and methods: A GRS was built based on the number of risk alleles in 53 previously identified single-nucleotide polymorphisms among 2,363 patients with a first diagnosis of CRC and 2,198 controls in DACHS [colorectal cancer: chances for prevention through screening], a population-based case-control study in Germany. Associations between GRS and FH with CRC risk were quantified by multiple logistic regression.
Results: A total of 316 cases (13.4%) and 214 controls (9.7%) had a first-degree relative (FDR) with CRC (adjusted odds ratio [aOR] 1.86, 95% CI 1.52–2.29). A GRS in the highest decile was associated with a 3.0-fold increased risk of CRC (aOR 3.00, 95% CI 2.24–4.02) compared with the lowest decile. This association was tentatively more pronounced in older age groups. FH and GRS were essentially unrelated, and their joint consideration provided more accurate risk stratification than risk stratification based on each of the variables individually. For example, risk was 6.1-fold increased in the presence of both FH in a FDR and a GRS in the highest decile (aOR 6.14, 95% CI 3.47–10.84) compared to persons without FH and a GRS in the lowest decile.
Conclusion: Both FH and the so far identified genetic variants carry essentially independent risk information and in combination provide great potential for CRC risk stratification.
Keywords: colorectal neoplasms, familial risk, common genetic variants, single-nucleotide polymorphisms
Background
First-degree relatives (FDRs) of patients with colorectal cancer (CRC) have an approximately twofold increased risk of CRC, and the risk is higher when CRC was diagnosed at relatively young age.1 Family history (FH) is therefore commonly recommended for risk stratification for CRC screening.2 The increased risk associated with FH may reflect shared genetic or environmental factors, many of which are still to be discovered.
Genome-wide association studies (GWASs) have identified an increasing number of single-nucleotide polymorphisms (SNPs) that are related to the risk of CRC.3–15 Although the risks associated with SNPs are mostly very small, the combination of multiple SNPs in genetic risk scores (GRSs) may allow for risk stratification that may be clinically relevant for more targeted CRC prevention and early detection. Previously reported GRS showed promising results,16 and discriminatory power of GRS will increase as more common variants are identified through GWASs.17
So far, FH and GRS have often been used separately, rather than jointly for CRC risk stratification. While this partly reflects the lack of availability of both types of information, it may also partly reflect the common belief that both variables provide redundant information. This belief is reflected, for example, as an implicit assumption in commonly employed calculations of the proportion of the risk increase associated with FH that can be explained by the identified SNPs.18,19 However, the low-penetrance risk variants identified by GWASs are expected to be commonly present without manifestation of CRC in FDRs, and the presence of such risk variants is therefore expected to provide relevant risk information beyond the information conveyed by FH. Conversely, familial aggregation of risk may reflect shared environmental factors in addition to shared genetic predisposition.
The aim of this study was to assess the potential of individual and joint risk stratification for CRC by FH and common genetic variants in a large, thoroughly phenotyped and genotyped case-control study in Germany.
Patients and methods
Study design and study population
Data for the analyses were drawn from the DACHS [colorectal cancer: chances for prevention through screening] study which has been described in detail elsewhere.20,21 In brief, DACHS is an ongoing population-based case-control study in the Rhine-Neckar region in southwest Germany, an area with approximately two million inhabitants. German-speaking patients aged ≥30 years with a first diagnosis of CRC who are capable of taking part in a personal interview of approximately 1 hour are eligible for participation. All 22 hospitals in this area offering first-line treatment to patients with CRC are involved in recruitment. Physicians inform patients with a first diagnosis of CRC about the study, mainly during their hospital stay succeeding the surgery. Approximately 50% of all eligible patients in the study area are recruited. Using frequency matching with respect to sex, age and county of residence, controls are randomly selected from population registries. Besides excluding persons with a history of CRC among controls, inclusion and exclusion criteria are identical for both cases and controls. This analysis was based on 2378 cases and 2205 controls who were recruited from 2003 to 2010 and for whom data from GWAS was available. The ethics committees of the Medical Faculty at the University of Heidelberg and the Medical Chambers of Baden-Württemberg and Rhineland-Palatinate approved the study. Written informed consent was obtained from all participants.
Data collection
The study center was informed about cases after they had given written informed consent. Controls were contacted by mail and follow-up telephone calls. Standardized in-person interviews were conducted with both cases (typically during their hospital stay) and controls (at their homes) by trained interviewers. In these interviews, blood or buccal samples were collected, and a broad variety of risk factors and preventive factors for CRC were addressed in great detail. In particular, detailed information about the participants’ FH was collected (degree of kinship, number of affected relatives and age at diagnosis). All cases with primary CRC were histologically confirmed, and pathology records and discharge letters were requested for all patients.
Genotyping
Genotyping, which was performed within the Genetics and Epidemiology of Colorectal Cancer Consortium (GECCO), has been previously described in detail elsewhere.15 In short, DNA was extracted from blood samples (in 99.1% of participants) or from buccal cells (in 0.9% of participants) using conventional methods. For persons recruited until 2007, genotyping was performed using Illumina HumanCytoSNP (n = 3415); participants who were recruited thereafter were genotyped using Illumina HumanOmniExpress (n = 1168). Triallelic SNPs and those not assigned a reference SNP-number were excluded, as were genotyped SNPs when they had a low call rate (<98%), lack of Hardy-Weinberg equilibrium in controls (P < 1 × 10⁻⁴), or low minor allele frequency (<0.1%). For imputation of missing genotypes, the CEU population (Utah residents with Northern and Western European ancestry from the Centre d'Étude du Polymorphisme Humain [CEPH {Human Polymorphism Study Center}] collection) in HapMap II release 24 was used.
Identification and selection of SNPs for the GRS
A literature review was conducted to find SNPs that were reported to be associated with a higher risk for CRC for persons of European descent (Table S1). If SNPs were in high linkage disequilibrium (LD; D′ ≥ 0.95 and r2 > 0.5) with each other, we only included the most significant SNP in our sample in the GRS. Nine SNPs were hence excluded from further analyses, which left 44 SNPs in the GRS. For five SNPs, the risk allele in our sample was not the same as reported in the respective discovery study (rs10411210, rs11169552, rs16969681, rs3987, rs6687758). We conducted sensitivity analyses including all SNPs regardless of their LD and additionally with a more conservative cutoff for D′ (0.3 and r2 > 0.2), which resulted in excluding additional six SNPs from GRS.
Statistical analyses
First, the main characteristics of cases and controls were described (Table 1). GRSs for all eligible study participants were calculated as the sum of risk alleles as defined in the discovery studies of the respective SNPs (0, 1, or 2 copies of the risk allele for genotyped SNPs; imputed dosages for imputed SNPs). For sensitivity analyses, we additionally calculated a weighted GRS which consists of the sum of all risk alleles with weights equal to the log of the odds ratio (OR) of the respective SNP as found in the discovery study of each SNP. Categories of the GRS were generated based on the distribution of the (weighted) risk alleles among controls (with cutoffs at the 10th, 20th, 40th, 60th, 80th, and 90th percentiles, respectively, to enable dose-response analyses across the full range of GRS values including very low- and very high-risk groups). Participants were categorized into seven different risk groups (very low, low, low–medium, medium, medium–high, high, and very high) according to those percentiles. As weighted and unweighted GRS yielded very similar results, only results for the unweighted GRS are presented (the main analyses for weighted GRS are summarized in Table S5).
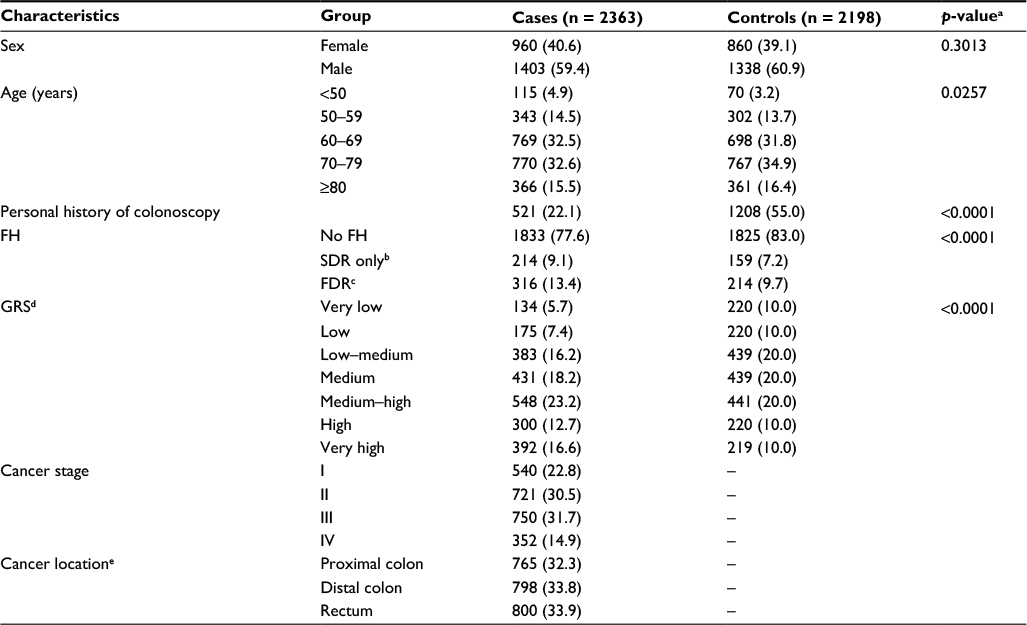 | Table 1 Selected characteristics of the study population, imputed data Notes: Values are expressed as n (%). ap-value for difference in distributions across categories. bFH in any SDR only. cFH in at least one FDR. dClassification of GRS: very low, ≤10th percentile; low, 10th–20th percentile; low–medium, 20th–40th percentile; medium, 40th–60th percentile; medium–high, 60th–80th percentile; high, 80th–90th percentile; very high, >90th percentile. eCancers in more than one location were allocated to the most proximal location (n = 34). ‘–’ indicates not applicable. Abbreviations: FDR, first-degree relative; FH, family history; GRS, genetic risk score; SDR, second-degree relative. |
For the description of the study population, missing data were imputed using the Markov Chain Monte Carlo method (N = 10 data sets, SAS procedure PROC MI). The imputation model was calculated with all potential confounders as listed in Table 2 plus several additional variables (having a partner or close friends, years of occupation) adding accuracy to the imputed data. Imputed values of categorical variables were rounded to the closest integer.
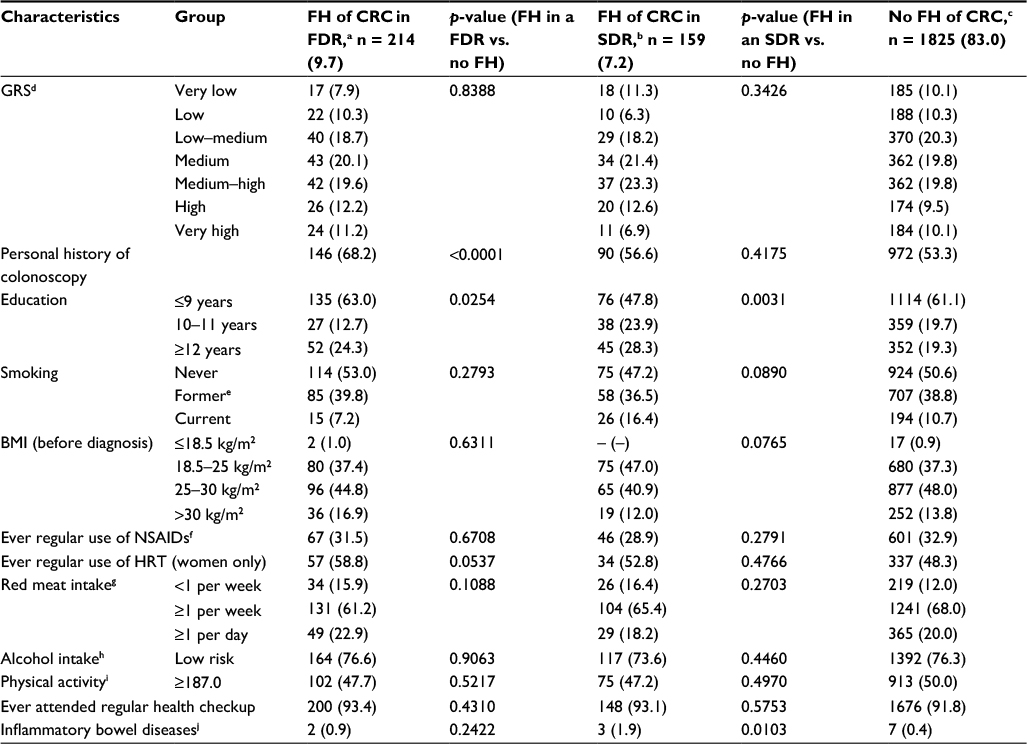 | Table 2 Distribution of potential confounders according to FH among controls, imputed data Notes: Values are expressed as n (%). aFH in at least one FDR. bFH in any SDR only. cIn any relative (both FDR or SDR). dClassification of GRS: very low, ≤10th percentile; low, 10th–20th percentile; low–medium, 20th–40th percentile; medium, 40th–60th percentile; medium–high, 60th–80th percentile; high, 80th–90th percentile; very high, >90th percentile. eFormer = stopped smoking more than 2 years ago. fAt least twice weekly for 1 year. gConsumption of red meat or processed red meat in the previous 12 months. hAverage lifetime daily alcohol consumption, measured in gram ethanol; low-risk alcohol intake defined as drinking less than 12 and 24 g ethanol daily for women and men, respectively. iMeasured in average lifetime MET in the previous 12 months, median in persons without FH = 187.0 MET-hours/week. jUlcerative colitis, Crohn’s disease. Abbreviations: BMI, body mass index; CRC, colorectal cancer; FDR, first-degree relative; FH, family history; GRS, genetic risk score; HRT, hormone replacement therapy; MET, metabolic equivalent of task; NSAIDs, nonsteroidal anti-inflammatory drugs; SDR, second-degree relative. |
Multiple logistic regression models were used to estimate the ORs and 95% CI for both the individual and joint associations of FH and GRS categories with CRC risk, adjusting for potential confounders. Adjustment included age, sex, smoking, and body mass index (BMI) before diagnosis, as well as covariates that were statistically unequally distributed in controls with and without FH of CRC in a FDR at a significance level of 0.1. Additional analyses were conducted stratifying the risk of CRC according to the age of the participants and patients’ cancer location. To exclude the possibility that Lynch syndrome carriers distorted the results due to their generally higher load of genetic alterations and hence higher risk for CRC independent of common genetic variants, sensitivity analyses were conducted using a subset of cases for whom data on microsatellite instability (MSI) and CpG island methylator phenotype (CIMP) were available (1688 out of 2378 cases; Table S6).22 For these analyses, we excluded all patients with MSI-high tumors, which most likely excluded all Lynch patients plus many sporadic tumors.23 Sensitivity analyses with a set of 27 SNPs previously used for generating a GRS16 are presented in Table S7.
Finally, we assessed the joint association of FH and the continuous GRS by a multiple logistic regression model with joint classification of cases and controls according to FH and GRS, controlling for the same covariates as described earlier. For this analysis, we included GRS as both a linear and quadratic term, as preceding cubic spline analyses indicated a curvilinear association.
All statistical analyses were conducted using SAS software, version 9.4 (SAS Institute Inc., Cary, NC, USA).
Results
Out of 3152 cases and 3317 controls who were recruited until December 2010, a total of 774 cases and 1112 controls have not been genotyped yet. In addition, 12 cases and seven controls were excluded from the analyses as they had missing information on FH of CRC. Another three cases were excluded as they fulfilled the Amsterdam criteria and might be carriers of the Lynch syndrome.
Table 1 presents the main characteristics of the remaining 2363 cases and 2198 controls. Approximately 60% of the participants were male; median age in cases and controls was 69 and 70 years, respectively. While more than half of the controls had undergone at least one previous colonoscopy, only 22.1% of cases had done so (p < 0.0001). FH of CRC in a FDR was reported by 316 cases (13.4%) and 214 controls (9.7%, p < 0.0001). The GRS ranged from 20 to 48, with the cutoffs for the seven categories in controls being 29, 31, 33, 35, 38, and 40. A substantially higher proportion of cases had GRSs in the higher categories (p < 0.0001). The distribution of the GRS was very similar and not statistically significant across different cancer stages, and the distribution within each stage was significantly different from the distribution in controls (Table S2).
Table 2 summarizes the distribution of the GRS and selected potential confounders according to FH among controls. The distribution of the GRS did not differ among controls with FH of CRC in a FDR compared to those without (p = 0.8338). More controls with FH of CRC in a FDR had a personal history of colonoscopy (68.2%) than controls without FH (53.3%, p < 0.0001). Other unequally distributed covariates (p < 0.1) included education and usage of hormone replacement therapy (HRT) among women, for which the regression analyses were adjusted. Apart from education, the distribution of potential confounders among persons with a FH in a second-degree relative (SDR) resembled the distribution of persons without FH.
Individual associations for GRS and FH with the risk of CRC are summarized in Table 3. Having a GRS in the top decile was associated with a 2.9-fold increased risk of CRC compared to the lowest decile in sex- and age-adjusted analyses (OR 2.94, 95% CI 2.24–3.86). Adjusting for all other covariates except FH did not materially change the results (OR 3.00, 95% CI 2.24–4.02). Lower GRS categories were associated with lower ORs (the risk monotonically increased with increasing levels of GRS; ptrend < 0.0001). Additional adjustment for FH did not materially alter the results in any GRS category. Excluding all patients with MSI-high tumors in the subset of participants for whom data on MSI and CIMP were available resulted in similar risk estimates (Table S6). Results with a set of 27 SNPs that were previously used for generating a GRS are summarized in Table S7. Comparison of the results summarized in Tables 3 and S7 indicates substantial further improvement in genetic risk stratification by the larger number of SNPs identified in the meantime (p-value for increase in c-statistic = 0.003).
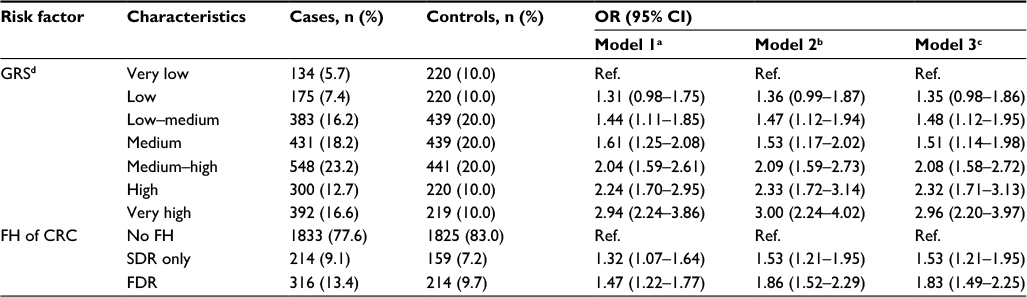 | Table 3 Risk of CRC according to GRS and FH of CRC Notes: Values are expressed as n (%). aAdjusted for sex and age. bAdjusted for sex, age (continuous), education (≤9, 10–11, ≥12 years), previous colonoscopy (yes/no), smoking (current/former/never), HRT among women (yes/no), BMI before diagnosis (weight in kilograms divided by squared height in meters); missing values, n = 75. cAdjustment like in model 2, plus additional adjustment for FH in analyses for GRS, and additional adjustment for GRS in analyses for FH, respectively; missing values, n = 75. dGRS with risk alleles as defined in discovery study (Table S1); classification: very low, ≤10th percentile; low, 10th–20th percentile; low–medium, 20th–40th percentile; medium, 40th–60th percentile; medium–high, 60th–80th percentile; high, 80th–90th percentile; very high, >90th percentile. Abbreviations: BMI, body mass index; CRC, colorectal cancer; FDR, first-degree relative; FH, family history; GRS, genetic risk score; HRT, hormone replacement therapy; OR, odds ratio; Ref., reference; SDR, second-degree relative. |
Having a FH of CRC in a FDR was associated with a 1.5-fold increased risk in age- and sex-adjusted analyses (OR 1.47, 95% CI 1.22–1.77; Table 3). Adjusting for additional covariates – especially previous colonoscopies – increased the risk to an OR of 1.86 (95% CI 1.52–2.29). The result was only minimally changed by additional adjustment for the GRS (OR 1.83, 95% CI 1.49–2.25). Risk estimates for FH in SDR followed the same pattern, although the magnitude of the associations was lower. The strong increase in CRC risk with increasing GRS is graphically shown in Figure 1 (ptrend < 0.0001).
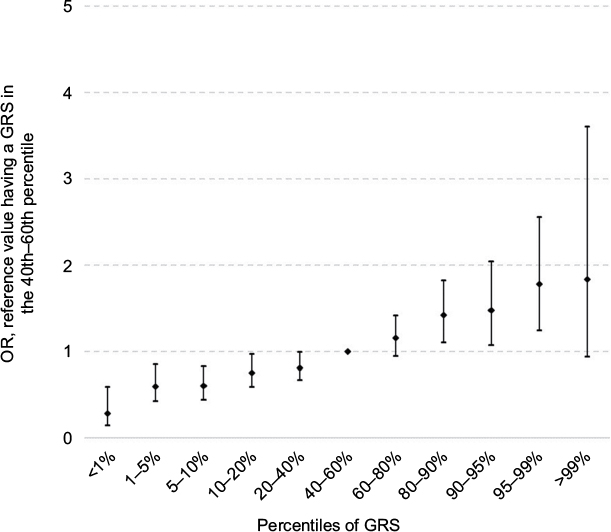 | Figure 1 Risk of CRC according to GRS percentiles. Abbreviations: CRC, colorectal cancer; GRS, genetic risk score; OR, odds ratio. |
In additional age-specific analyses, a higher GRS was associated with a higher risk for CRC in all age groups (Table S3). Having a very high GRS was even tentatively more pronounced in persons in the older age groups than in the younger age group. Similarly strong elevations of CRC risk for higher GRS categories were found for all major cancer sites (Table S4).
Figure 2 shows the dose-response association between the number of risk alleles and the risk of CRC derived from a logistic regression model including both FH (in a FDR or a SDR) a linear and a quadratic term of the GRS. The reference for the three curves for people with FH in a FDR, FH in a SDR and without FH is the risk of a participant without FH and 35 risk alleles (median value for risk alleles among persons without FH). We found a curvilinear relationship between GRS and CRC risk with a particularly strong increase in CRC risk at higher levels of the GRS. Due to the independent relationship of FH with CRC, people with FDR reach the same risk level as those without FH at a substantially lower GRS. For example, a person with FDR and 35 risk alleles has approximately the same risk of CRC as someone without FH and 44 risk alleles.
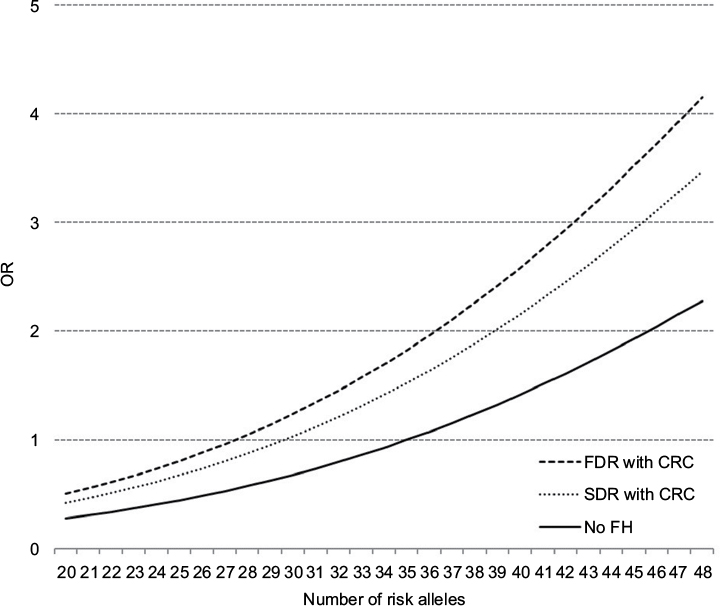 | Figure 2 Dose–response association between the number of risk alleles and risk of CRC, stratified by FH, plotted with a joint reference (no FH, 35 risk alleles). Abbreviations: CRC, colorectal cancer; FDR, first-degree relative; FH, family history; OR, odds ratio; SDR, second-degree relative. |
Results for joint stratification for FH and the GRS are summarized in Table 4. An increased risk was observed with increasing GRS for persons with FDR, with SDR and without FH. Participants without FH in the highest GRS category had a 2.8-fold increased risk of CRC compared to participants without FH in the lowest risk category (95% CI 2.02–3.88). Compared to the same reference group, persons with FH in a SDR had a higher risk for CRC in every GRS category (ORs for the lowest and highest GRS categories: 1.56, 95% CI 0.68–3.57 and 6.48, 95% CI 2.93–14.31, respectively). Likewise, participants with a FH in a FDR in the lowest GRS category had a 1.7-fold increased risk of CRC (95% CI 0.76–3.71) compared to persons with no FH in the lowest GRS category, whereas persons with FH in a FDR in the highest GRS category had a 6.1-fold increased risk (95% CI 3.47–10.84). Results for a different reference group (no FH and medium GRS) are summarized in Table S8.
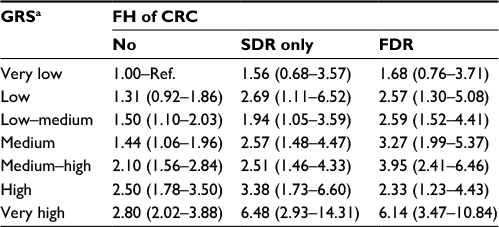 | Table 4 ORs with 95% CI for the risk of CRC according to GRS and having a FH of CRC Notes: Model adjusted for sex, age, education, previous colonoscopy, smoking, HRT among women, BMI before diagnosis; missing values, n = 75. aClassification of GRS: very low, ≤10th percentile; low, 10th–20th percentile; low–medium, 20th–40th percentile; medium, 40th–60th percentile; medium–high, 60th–80th percentile; high, 80th–90th percentile; very high, >90th percentile. Abbreviations: BMI, body mass index; CRC, colorectal cancer; FH, family history; FDR, first-degree relative; GRS, genetic risk score; HRT, hormone replacement therapy; OR, odds ratio; Ref., reference; SDR, second-degree relative. |
Discussion
In this large-scale case-control study, we found strong associations of both self-reported FH and a GRS based on previously published risk variants with CRC risk. Somewhat unexpectedly, however, both predictors were found to be essentially unrelated, which enabled even much better risk stratification by their joint consideration. Interestingly, we also found the association between GRS and CRC risk to be tentatively more pronounced at older compared to younger ages.
The observed strong associations of both self-reported FH and a GRS with CRC risk are in line with previous reports that had assessed either one of these risk predictors at a time. For example, Lowery et al1 summarized existing literature to date and found that the majority of studies estimated a ~2.2- and 1.7-fold increased risk of CRC associated with a FH of CRC in a FDR or SDR, respectively. A study quantifying the utility of SNPs to guide CRC screening and simulating a case-control study with 2,000,000 participants calculated a fivefold CRC risk for a person who was in the highest GRS decile compared to a person in the lowest decile.18 Another recent study estimated a 1.8-fold increased risk of CRC for persons being in the top 10% of the GRS compared to the population median.17 However, only few previous studies have considered both factors simultaneously. Those that did found higher absolute CRC risk for persons with FH and more risk alleles,24 noticed that discriminatory accuracy of models including only FH can be improved by incorporating GRS16 and concluded that the predictive strength of SNPs was increased if FH was taken into account.18 A potential reason for the paucity of studies that assessed both factors simultaneously might be the widespread belief that both sources deliver the same kind of information, are inevitably interrelated, and hence provide redundant information. However, carriers of common risk variants are not at all restricted to the group of persons with FH of CRC. These risk variants are expected to be commonly present in persons without FH. Common low-penetrance genetic variants therefore provide additional information beyond information conveyed by FH. Vice versa, FH may also reflect familial clustering of nongenetic risk factors (such as smoking) which are not related to GRS.
Nevertheless, the almost complete absence of an association between FH and GRS was unexpected. A potential explanation could be that SNPs identified by GWASs and included in GRS are essentially restricted to SNPs with relatively high minor allele frequency (>1–5%) but low penetrance, as the power of GWASs to detect SNPs with lower minor allele frequency was generally very limited.25 On the other hand, familial aggregation of CRC, in particular familial aggregation of CRC at young ages, might be more strongly linked to rare SNPs of higher penetrance, many of which are still to be detected.25 Whereas most previous studies found FH to be a stronger predictor of CRC risk at younger ages,1,26 no such pattern was observed for the GRS in our study, which suggests the assumption that previously identified SNPs and self-reported FH represent two different sources of risk.
On the positive side, the essential lack of an association between GRS and FH provides great opportunities to enhance risk stratification by combining both sources of information. For example, we saw that having a higher GRS consistently increased the CRC risk among persons both without and with FH (irrespective of the degree of the relative), and persons with FH were at higher risk for CRC compared to persons without FH at every GRS category. Previous work has examined the predictive value of risk scores based on a combination of FH with other self-reported risk factors, such as age, sex, smoking status, and BMI.27–31 Their overall performance in risk stratification, eg, when examining the area under the curve or when comparing high- with low-risk groups, was similar to the performance of the GRS in our study and superior to risk stratification by FH alone.16,18,28 Combining the GRS not only with FH but also with multiple other risk factors might therefore be a very promising approach to further enhance risk stratification in CRC screening. Due to the age- and sex-matched design of the DACHS study, a multivariable risk score including key variables could not be derived but should be evaluated in further research preferably based on longitudinal studies.
Our study has several strengths and limitations. The large sample size of this ongoing study and the detailed information provided by the study participants are major advantages. The DACHS study is one of the largest population-based case-control studies in the world, and its data set contains very detailed information about the participants, such as previous colonoscopies, FH of CRC among FDRs and SDRs, and medical records.
Due to the nature of a case-control study, information about potential risk and protective factors was gathered retrospectively, which might have induced recall bias. Cases might be more prone to remember the existence of risk factors, such as a FH, than controls, resulting in distorted risk estimates. Empirical evidence suggests, however, that recall bias regarding CRC in FDRs is likely to be small.32 For our analyses, we did not verify participants’ FH. However, previous studies generally suggested good accuracy of self-reported FH.33,34 We did not assess sex differences in the association between FH and CRC risk in the current analyses; however, previous analyses in the DACHS study investigated such differences in more detail.35 Furthermore, information on participants’ previous colonoscopies was based on self-reports, but analyses conducted in an earlier data set of the DACHS study showed high accuracy of self-reported endoscopic examination.36 The Amsterdam criteria which were used for excluding Lynch patients from our analyses might not be sensitive enough,37,38 which could have left several undetected Lynch patients in the analyses. However, sensitivity analyses excluding Lynch patients with high certainty resulted in similar risk estimates. We furthermore chose a relatively high cutoff for the linkage disequilibrium (D′ ≥ 0.95) between the SNPs, as our goal was not to discover new risk variants, but to combine the existing information into a score. We conducted sensitivity analyses both with no SNP selection due to a LD cutoff and with SNP selection based on a much lower LD cutoff (D′ ≥ 0.3), the latter of which led to less included SNPs in the GRS (38 instead of 44). Both analyses yielded consistent overall patterns with only slightly lower risk estimates in all analyses (data not shown). While the data used for these analyses were included as part of the GECCO in previous analyses,16 we updated and enlarged the number of SNPs included in the GRS, which resulted in substantially enhanced risk stratification for CRC risk. Although our analyses are conducted within the DACHS study, a study almost exclusively consisting of a Caucasian population, and GRS in other populations might include different common genetic variants, we believe that the examined results are not substantially different in other ethnic groups.
Conclusion
Despite its limitations, this large case-control study provides new detailed insights into the individual and joint associations of GRS and FH with CRC risk. Our results show that joint risk stratification on the basis of both variables possibly supplemented by additional easy-to-collect risk factor information could be feasible and clinically relevant, especially with the prospect of more risk variants being detected in the future.
Acknowledgments
The authors thank the study participants and the interviewers who collected the data, the hospitals and cooperating institutions that recruited patients for this study (Chirurgische Universitätsklinik Heidelberg, Klinik am Gesundbrunnen Heilbronn, Sankt Vincentiuskrankenhaus Speyer, Sankt Josefskrankenhaus Heidelberg, Chirurgische Universitätsklinik Mannheim, Diakonissenkrankenhaus Speyer, Krankenhaus Salem Heidelberg, Kreiskrankenhaus Schwetzingen, Sankt Marien und Sankt Annastiftkrankenhaus Ludwigshafen, Klinikum Ludwigshafen, Stadtklinik Frankenthal, Diakoniekrankenhaus Mannheim, Kreiskrankenhaus Sinsheim, Klinikum am Plattenwald Bad Friedrichshall, Kreiskrankenhaus Weinheim, Kreiskrankenhaus Eberbach, Kreiskrankenhaus Buchen, Kreiskrankenhaus Mosbach, Enddarmzentrum Mannheim, Kreiskrankenhaus Brackenheim and Cancer Registry of Rhineland-Palatinate, Mainz), and Ute Handte-Daub, Ansgar Brandhorst, and Dr. Utz Benscheid for excellent technical assistance. The authors also thank all those at the GECCO Coordinating Center for helping bring together the data and people who made this project possible. This work was supported by grants from the German Research Council (BR 1704/6-1; BR 1704/6-3; BR 1704/6-4; BR 1704/6-6; CH 117/1-1; HO 5117/2-1; HE 5998/2-1; KL 2354/3-1; RO 2270/8-1; BR 1704/17-1), the German Federal Ministry of Education and Research (01KH0404; 01ER0814; 01ER0815; 01ER1505A; and 01ER1505B), the Interdisciplinary Research Program of the National Center for Tumor Diseases (NCT), Germany, and the National Cancer Institute, National Institutes of Health, and US Department of Health and Human Services (NIH R01 CA195789; U01 CA137088; U01 CA185094 and R01 CA059045).
Disclosure
The authors report no conflicts of interest in this work.
References
Lowery JT, Ahnen DJ, Schroy PC 3rd, et al. Understanding the contribution of family history to colorectal cancer risk and its clinical implications: a state-of-the-science review. Cancer. 2016;122(17):2633–2645. | ||
Short MW, Layton MC, Teer BN, Domagalski JE. Colorectal cancer screening and surveillance. Am Fam Physician. 2015;91(2):93–100. | ||
Al-Tassan NA, Whiffin N, Hosking FJ, et al. A new GWAS and meta-analysis with 1000Genomes imputation identifies novel risk variants for colorectal cancer. Sci Rep. 2015;5:10442. | ||
Berndt SI, Potter JD, Hazra A, et al. Pooled analysis of genetic variation at chromosome 8q24 and colorectal neoplasia risk. Hum Mol Genet. 2008;17(17):2665–2672. | ||
Broderick P, Carvajal-Carmona L, Pittman AM, et al. A genome-wide association study shows that common alleles of SMAD7 influence colorectal cancer risk. Nat Genet. 2007;39(11):1315–1317. | ||
Houlston RS, Webb E, Broderick P, et al; COGENT Study. Meta-analysis of genome-wide association data identifies four new susceptibility loci for colorectal cancer. Nat Genet. 2008;40(12):1426–1435. | ||
Houlston RS, Cheadle J, Dobbins SE, et al. Meta-analysis of three genome-wide association studies identifies susceptibility loci for colorectal cancer at 1q41, 3q26.2, 12q13.13 and 20q13.33. Nat Genet. 2010;42(11):973–977. | ||
Jaeger E, Webb E, Howarth K, et al. Common genetic variants at the CRAC1 (HMPS) locus on chromosome 15q13.3 influence colorectal cancer risk. Nat Genet. 2008;40(1):26–28. | ||
Tenesa A, Farrington SM, Prendergast JGD, et al. Genome-wide association scan identifies a colorectal cancer susceptibility locus on 11q23 and replicates risk loci at 8q24 and 18q21. Nat Genet. 2008;40(5):631–637. | ||
Tomlinson I, Webb E, Carvajal-Carmona L, et al. A genome-wide association scan of tag SNPs identifies a susceptibility variant for colorectal cancer at 8q24.21. Nat Genet. 2007;39(8):984–988. | ||
Tomlinson IP, Carvajal-Carmona LG, Dobbins SE, et al. Multiple common susceptibility variants near BMP pathway loci GREM1, BMP4, and BMP2 explain part of the missing heritability of colorectal cancer. PLoS Genet. 2011;7(6):e1002105. | ||
Tomlinson IPM, Webb E, Carvajal-Carmona L, et al. A genome-wide association study identifies colorectal cancer susceptibility loci on chromosomes 10p14 and 8q23.3. Nat Genet. 2008;40(5):623–630. | ||
Whiffin N, Hosking FJ, Farrington SM, et al. Identification of susceptibility loci for colorectal cancer in a genome-wide meta-analysis. Hum Mol Genet. 2014;23(17):4729–4737. | ||
Zanke BW, Greenwood CM, Rangrej J, et al. Genome-wide association scan identifies a colorectal cancer susceptibility locus on chromosome 8q24. Nat Genet. 2007;39(8):989–994. | ||
Peters U, Jiao S, Schumacher FR, et al; Colon Cancer Family Registry and the Genetics and Epidemiology of Colorectal Cancer Consortium. Identification of genetic susceptibility loci for colorectal tumors in a genome-wide meta-analysis. Gastroenterology. 2013;144(4):799–807.e24. | ||
Hsu L, Jeon J, Brenner H, et al; Colorectal Transdisciplinary (CORECT) Study; Genetics and Epidemiology of Colorectal Cancer Consortium (GECCO). A model to determine colorectal cancer risk using common genetic susceptibility loci. Gastroenterology. 2015;148(7):1330–1339.e14. | ||
Frampton MJ, Law P, Litchfield K, et al. Implications of polygenic risk for personalised colorectal cancer screening. Ann Oncol. 2015;27(3):429–434. | ||
Jenkins MA, Makalic E, Dowty JG, et al. Quantifying the utility of single nucleotide polymorphisms to guide colorectal cancer screening. Future Oncol. 2016;12(4):503–513. | ||
Zhang B, Jia W-H, Matsuda K, et al. Large-scale genetic study in East Asians identifies six new loci associated with colorectal cancer risk. Nat Genet. 2014;46(6):533–542. | ||
Brenner H, Chang-Claude J, Seiler CM, Rickert A, Hoffmeister M. Protection from colorectal cancer after colonoscopy: a population-based, case-control study. Ann Intern Med. 2011;154(1):22–30. | ||
Brenner H, Chang–Claude J, Jansen L, Knebel P, Stock C, Hoffmeister M. Reduced risk of colorectal cancer up to 10 years after screening, surveillance, or diagnostic colonoscopy. Gastroenterology. 2014;146(3):709–717. | ||
Jia M, Jansen L, Walter V, et al. No association of CpG island methylator phenotype and colorectal cancer survival: population-based study. Br J Cancer. 2016;115(11):1359–1366. | ||
Brenner H, Kloor M, Pox CP. Colorectal cancer. Lancet. 2014;383(9927):1490–1502. | ||
Dunlop MG, Tenesa A, Farrington SM, et al. Cumulative impact of common genetic variants and other risk factors on colorectal cancer risk in 42,103 individuals. Gut. 2013;62(6):871–881. | ||
Peters U, Bien S, Zubair N. Genetic architecture of colorectal cancer. Gut. 2015;64(10):1623–1636. | ||
Butterworth AS, Higgins JPT, Pharoah P. Relative and absolute risk of colorectal cancer for individuals with a family history: a meta-analysis. Eur J Cancer. 2006;42(2):216–227. | ||
Tao S, Hoffmeister M, Brenner H. Development and validation of a scoring system to identify individuals at high risk for advanced colorectal neoplasms who should undergo colonoscopy screening. Clin Gastroenterol Hepatol. 2014;12(3):478–485. | ||
Cao Y, Rosner BA, Ma J, et al. Assessing individual risk for high-risk colorectal adenoma at first-time screening colonoscopy. Int J Cancer. 2015;137(7):1719–1728. | ||
Imperiale TF, Monahan PO, Stump TE, Glowinski EA, Ransohoff DF. Derivation and validation of a scoring system to stratify risk for advanced colorectal neoplasia in asymptomatic adults: a cross-sectional study. Ann Intern Med. 2015;163(5):339–346. | ||
Kaminski MF, Polkowski M, Kraszewska E, Rupinski M, Butruk E, Regula J. A score to estimate the likelihood of detecting advanced colorectal neoplasia at colonoscopy. Gut. 2014;63(7):1112–1119. | ||
Shaukat A, Church TR, Shanley R, et al. Development and validation of a clinical score for predicting risk of adenoma at screening colonoscopy. Cancer Epidemiol Biomarkers Prev. 2015;24(6):913–920. | ||
Mitchell RJ, Brewster D, Campbell H, et al. Accuracy of reporting of family history of colorectal cancer. Gut. 2004;53(2):291–295. | ||
Ziogas A, Anton-Culver H. Validation of family history data in cancer family registries. Am J Prev Med. 2003;24(2):190–198. | ||
Kerber RA, Slattery ML. Comparison of self-reported and database-linked family history of cancer data in a case-control study. Am J Epidemiol. 1997;146(3):244–248. | ||
Weigl K, Jansen L, Chang-Claude J, Knebel P, Hoffmeister M, Brenner H. Family history and the risk of colorectal cancer: the importance of patients’ history of colonoscopy. Int J Cancer. 2016;139(10):2213–2220. | ||
Hoffmeister M, Chang-Claude J, Brenner H. Validity of self-reported endoscopies of the large bowel and implications for estimates of colorectal cancer risk. Am J Epidemiol. 2007;166(2):130–136. | ||
Hampel H, Stephens JA, Pukkala E, et al. Cancer risk in hereditary nonpolyposis colorectal cancer syndrome: later age of onset. Gastroenterology. 2005;129(2):415–421. | ||
Sjursen W, Haukanes BI, Grindedal EM, et al. Current clinical criteria for Lynch syndrome are not sensitive enough to identify MSH6 mutation carriers. J Med Genet. 2010;47(9):579–585. |
 © 2018 The Author(s). This work is published and licensed by Dove Medical Press Limited. The
full terms of this license are available at https://www.dovepress.com/terms
and incorporate the Creative Commons Attribution
- Non Commercial (unported, 3.0) License.
By accessing the work you hereby accept the Terms. Non-commercial uses of the work are permitted
without any further permission from Dove Medical Press Limited, provided the work is properly
attributed. For permission for commercial use of this work, please see paragraphs 4.2 and 5 of our Terms.
© 2018 The Author(s). This work is published and licensed by Dove Medical Press Limited. The
full terms of this license are available at https://www.dovepress.com/terms
and incorporate the Creative Commons Attribution
- Non Commercial (unported, 3.0) License.
By accessing the work you hereby accept the Terms. Non-commercial uses of the work are permitted
without any further permission from Dove Medical Press Limited, provided the work is properly
attributed. For permission for commercial use of this work, please see paragraphs 4.2 and 5 of our Terms.