Back to Journals » Clinical Optometry » Volume 12
Stereopsis in Early Diabetic Retinopathy
Authors Faraji M, Kangari H ![]() , Majidi A, Tabatabaee SM
, Majidi A, Tabatabaee SM ![]()
Received 24 September 2019
Accepted for publication 16 December 2019
Published 10 January 2020 Volume 2020:12 Pages 1—7
DOI https://doi.org/10.2147/OPTO.S232312
Checked for plagiarism Yes
Review by Single anonymous peer review
Peer reviewer comments 2
Editor who approved publication: Mr Simon Berry
Mohadeceh Faraji, 1 Haleh Kangari, 2 Alireza Majidi, 3 Seyed Mehdi Tabatabaee 4
1Department of Optometry, School of Rehabilitation, (Student Research Office), Shahid Beheshti University of Medical Sciences, Tehran, Iran; 2Department of Optometry, School of Rehabilitation, Shahid Beheshti University of Medical Sciences, Tehran, Iran; 3Private Practice, Qhazvin, Iran; 4School of Rehabilitation, Shahid Beheshti University of Medical Sciences, Tehran, Iran
Correspondence: Haleh Kangari
School of Rehabilitation, Shahid Beheshti University of Medical Sciences, Emam Hossein Square, Damavand Avenue, Corner of Bakhshifard Street, Tehran 1616913111, Iran
Tel +982177561723
Fax +982177548865
Email [email protected]
Purpose: The present study was undertaken to compare the stereoacuities measured by TNO and Titmus tests, in diabetic patients with early retinopathies and those without diabetes (control group).
Methods: In this study, 139 participants (43 with diabetes mellitus, and 96 age-matched controls) were recruited from a retina subspecialist clinic in Qazvin, Iran, from September 2016 to March 2017. The stereo-acuities were measured following subjective refraction by Titmus and TNO tests at 40 cm. The patients with diabetes whose retinal exam revealed no background retinopathy or only microaneurysms (very mild diabetic retinopathy) in the worse eye were enrolled into this study.
Results: In the diabetic group, with TNO, the stereoacuity levels in 95.3% of the subjects were in 120, 240, and 480 levels, while in the non-diabetic group, 86.4% of the subjects were in 30, 60, and 120 levels. In the diabetic group, with Titmus, 86.1% of the subjects were in 40, 50, and 60 levels, while in the nondiabetic group 91.7% of the subjects were in 40 levels. The correlation between TNO and Titmus was statistically significant (r = 0.338, P< 0.001) for the non-diabetic group, while it was not statistically significant (r = − 0.034, P= 0.827) for the diabetic group.
Conclusion: In the early stages of diabetic retinopathy, the global pathway of stereopsis is damaged more than the local. The difference in severity of damage to local and global pathways in patients with diabetes indicates that there may be different underlying mechanisms for these two pathways.
Keywords: depth perception, diabetic retinopathies, diabetes complications
Introduction
The major visual complication of diabetes mellitus (DM) is diabetic retinopathy (DR) which is initially recognized by the microvascular changes in the retina.1 The literature in the past two decades reveals neurodegeneration of the retina occurs prior or concomitant with these microvascular changes.2–12 Prior to these vascular signs, visual dysfunctions have been reported in color vision perception, contrast sensitivity function, microperimetry and multifocal electroretinogram.12–15 Stereopsis or depth perception is another important visual function that has not been studied previously in diabetic patients at any stages of DR. Reduced depth perception can be a risk factor for falls. Occurrence of falls has been reported in diabetic patients.16
Stereopsis or depth perception is a visual function that requires the proper operations of the visual pathway from retina to V1 and extra striate cortical areas. The parvocellular and magnocellular pathways both in a parallel fashion provide input to V1, V2 and extra striate cortical areas for depth perception. The mechanisms underlying stereopsis have been classified into two categories of global vs local. Some investigators believe that, the global process involves two serial stages: 1) the processing of local disparity in early visual areas of (V1-V2) by disparity selective cells, binocular cells with localized receptive field; and 2) processing corrugations of disparity by cells with much larger receptive fields in higher visual brain areas that involve the integration of local stereoscopic information over large spatial distances.17 Evidence from brain damage and brain surgeries suggest an anatomical separation for local vs global processing,18 while other studies reveal that the two mechanisms cannot be entirely separate.19 The exact mechanism of local and global stereopsis is not fully understood.
The local or global stereopsis tests are generally used in clinics and screenings to evaluate binocular status in the pediatric population, with amblyopia, and are rarely used for diagnosis and monitoring of systemic diseases. Some limited research on neurodegenerative diseases such as Parkinson’s disease, schizophrenia, and multiple sclerosis have reported deterioration of stereopsis in these patients.20–23 Stereopsis in patients with DM has not been previously investigated at any stages of DR. Since strong evidence exists for neurodegeneration in early stages of diabetic retinopathy,12 we speculate that some functional changes in depth perception may also be present at this stage. Early detection of subclinical DR with an easy and low cost functional test such as stereopsis can provide earlier detection of visual changes and subsequent appropriate decision in diagnosis and management of DM. Further analysis of stereopsis with local and global tests can shed light into the mechanisms underlying these two types of processing. The purpose of this study was to compare global (TNO) vs local (Titmus) stereopsis in patients with DM (with no background retinopathy or very mild non-proliferative retinopathy) with healthy individuals (control).
Patients and Methods
Participants
In this prospective cross-sectional study, the subjects were recruited from a retina subspecialist clinic in Qazvin, Iran, from September 2016 to March 2017.
Inclusion criteria: 1) criteria for diagnosis of diabetes were (a) Fasting Plasma glucose≥126 mg/dL (fasting defined as no caloric intake for at least 8 hours), or (b) 2-hour plasma glucose≥200 mg/dL during the OGTT (the test should be performed as described by the World Health Organization, using glucose load containing the equivalent of 75 g anhydrous glucose dissolved in water. (In the absence of unequivocal hyperglycemia, the above criteria was confirmed by repeated testing.);16 2) Fundus exam which reveals no background diabetic retinopathy (level 10) or presence of only microaneurysms (level 20) in the worse eye based on Early Treatment Diabetic Retinopathy Study (ETDRS) classification;24 3) best corrected visual acuity of 20/20 in each eye at distance and near.
Exclusion criteria: subjects with amblyopia, distant or near strabismus, anisometropia greater than 1.00 D, refractive error more than ± 3.00 D sphere and – 2.00 D cylinder, near phorias greater than 4Δ eso and 9Δ exo,25 history of corneal opacity, lens opacity, glaucoma, history of ocular surgery, any retinal disease, based on EDTRS, the presence of diabetic retinopathy at level 35 and above (level 35 [mild diabetic retinopathy] has been defined as the presence of hard exudates, cotton wool spots, and/or mild retina hemorrhage; above level 35 includes different levels of retinal hemorrhage, intra-retinal microvascular abnormalities [IRMA], venous beading, new vessels elsewhere, neovascularization of the disc, peri-retinal hemorrhage, and vitreous hemorrhage),25 or presence of clinically significant macular edema (defined as 1) retinal thickening within 500 µm of the macular center; 2) Hard exudates within 500 µm of the macular center with adjacent retinal thickening; 3) one or more disc diameters of retinal thickening, part of which is within one disc diameter of the macular center).
The cases were compared with aged matched healthy subjects with no history of diabetes. The study was conducted in accordance with the Declaration of Helsinki and was approved by the research ethics committee of the School of Rehabilitation, Shahid Beheshti University of Medical Sciences; the approval certification number is 95/6/13. An oral informed consent was obtained from the participants, in the presence of a third party, and this was previously approved by the ethics committee.
Procedures
The following assessments were performed on each patient in this order: 1) distant visual acuity was measured by Tumbling E chart in LCD chart (Medizs Inc., Korea); 2) static retinoscopy was performed (Heine, Beta 200, Germany) followed by auto-refraction using an auto-refractometer (Topcon KR-8800, Japan); 3) subjective refraction was performed at 6 meters; 4) near visual acuity was determined at 40 cm, for those requiring addition, appropriate addition was used; 5) unilateral and alternating cover tests were performed at far (6 m) and near (40 cm) distances with appropriate correction; 6) stereoacuity was measured by Titmus stereo fly test and TNO. The order of performing the two stereo tests for each participant was randomly selected to balance out variables such as learning and fatigue; 7) following optometric exam, the anterior segment exams were performed by the ophthalmologist with a slit lamp (Haag–Streit, Bern, Swiss made) 8) then, the subjects were dilated with a drop of Tropicamide 1%, instilled twice, with a 5 minute interval, and at least 30 minutes wait interval, after the last drop; 9) the fundus exam was first performed by the retina specialist behind the slit lamp (Haag–Streit, Bern, Swiss made) with +90D hand held lenses (Volk optical, Inc.), at eight positions of cardinal gaze, the posterior pole being examined last; 10) binocular indirect ophthalmoscopy (Heine, Germany) was also performed in eight positions of cardinal gaze with a + 20 D lens; 11) The picture of the retina was acquired by the Spectralis Heidelberg Retina Angiograph and Optical Coherence Tomography (HRA +OCT) (Heidelberg Engineering, Heidelberg, Germany), in patients suspected for CSME.
Stereopsis Assessment
Titmus stereo fly test (Stereo Optical, Chicago, IL, USA) was used to measure local stereopsis. The participants were wearing Polaroid glasses; when needed, appropriate near glasses were worn underneath. The booklets were held at 40 cm, perpendicular to the visual axis. The examiner always checked that the participants avoided head movement.
Global stereopsis was measured with TNO stereotest, (Lameris, Ootech Netherlands). The participants were wearing red-green anaglyph filters, when needed, appropriate near glasses were worn underneath the filters. The testing conditions were the same as the above conditions. The first three plates (IIII) were used to quickly establish whether stereoscopic vision was present. Plate IV was used for suppression check. The quantitative plates (V–VII) were used for exact determination of the stereoscopic sensitivity.
Lighting for the tests included additional light above the participant’s shoulder for uniform illumination of the stereo booklet (90 cd/m2).
Data Analysis
Data analysis was performed by IBM SPSS Statistics software (Version 20).
In this software, Shapiro–Wilk analysis showed that the data was not normally distributed. For non-parametric data, Mann–Whitney U-test for independent samples, was used. In addition, the correlations for non-parametric data between TNO and Titmus in both groups were determined by Spearman test. A P-value of less than 0.05 was considered as statistically significant. The agreement between TNO and Titmus in two groups were analyzed by Bland-Altman plots, in MedCalc software.
Results
In this study, 139 participants were enrolled. The demographic information of the participants is presented in Table 1. In terms of age, there was no statistically significant difference between the two groups (P=0.68).
 |
Table 1 Demographic Characteristics of the Diabetic and Non-Diabetic Groups |
The distribution of subjects in the diabetic and non-diabetic groups at different stereoacuity levels with TNO are presented in Table 2. The mode for the diabetic group is 240 arcsec while for the non-diabetic group is 60 arcsec. In the diabetic group 95.3% of the subjects were in 120, 240, and 480 levels, while in the nondiabetic group 86.4% of the subjects were in 30, 60, and 120 levels.
 |
Table 2 The Distribution of the Subjects in Different TNO Levels in the Diabetic and Non-Diabetic Groups |
The distribution of subjects in the diabetic and non-diabetic groups at different stereoacuity levels with Titmus are presented in Table 3. The mode for the diabetic group is 50 arcsec, while for the non-diabetic group is 40 arcsec. In the diabetic group 86.1% of the subjects were in 40, 50, and 60 levels, while in the nondiabetic group 91.7% of the subjects were in 40 level. In the diabetic group only 27.9% are in level 40.
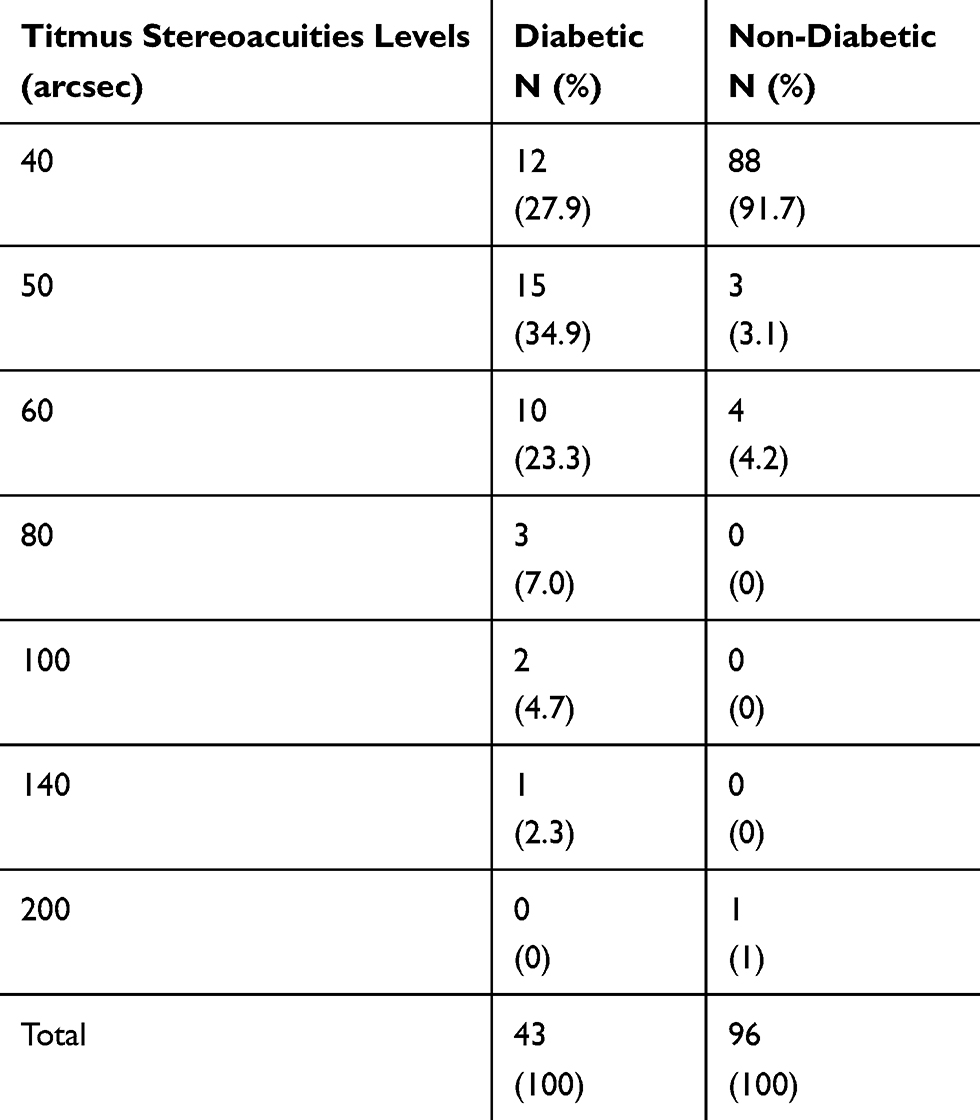 |
Table 3 The Distribution of the Subjects in Different Titmus Levels in the Diabetic and Non-Diabetic Groups |
The correlation between TNO and Titmus findings in the diabetic group was not statistically significant (r=−0.034, p=0.827). The scatter plot is presented in Figure 1. The correlation between TNO and Titmus findings in the non-diabetic group was statistically significant (r=−0.338, p=0.001). The scatter plot is presented in Figure 2.
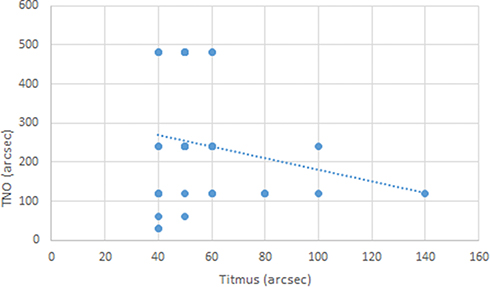 |
Figure 1 The scatter plot for the stereoacuity measurements taken by TNO and Titmus in the diabetic group. |
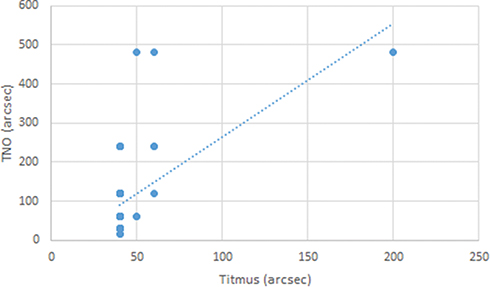 |
Figure 2 The scatter plot for the stereoacuity measurements taken by TNO and Titmus in the non- diabetic group. |
The mean differences between stereoacuity measurements performed by TNO and Titmus tests are presented in Bland-Altman plots in Figure 3 for patients with DM and in Figure 4 for subjects without diabetes. The mean differences between stereoacuity measurements taken by the TNO-Titmus in Figures 3 and 4 show that in the diabetic group, the difference is not close to zero, while in the non-diabetic group the difference is near zero.
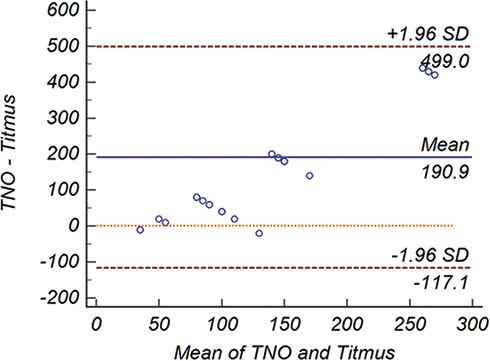 |
Figure 3 Bland-Altman plot of the stereoacuities measurements taken by TNO-Titmus in the diabetic group; the solid line represents the average difference between TNO and Titmus measures (mean difference), dashed lines indicate the lower and upper 95% limits of agreements. |
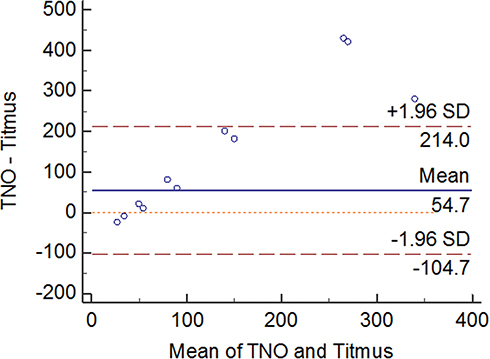 |
Figure 4 Bland-Altman plot of the stereoacuities measurements taken by TNO-Titmus in the non-diabetic group; the solid line represents the average difference between TNO and Titmus measures (mean difference), dashed lines indicate the lower and upper 95% limits of agreements. |
Discussion
In this study, in the diabetic group the stereoacuity levels achieved by TNO and Titmus were worse than the non-diabetic group. The stereoacuity levels achieved by TNO were worse than Titmus in the diabetic and non-diabetic groups. These findings indicate that at the early stages of diabetic retinopathy the global and local pathways of stereopsis are damaged but the severity of damage is different between the two pathways.
In this study, the stereoacuities measured by the TNO showed worse values compared with Titmus in both groups. The difference between TNO and Titmus has also been observed previously in healthy subjects.26 Some might speculate that monocular cues inherent in the Titmus have influenced these findings. However, previous investigators have reported that in Titmus, only the first 3 to 4 circles have strong monocular cues of lateral displacement, and these monocular cues should not affect subjects with thresholds of 100 arcsec or better.27 Since the measured stereoacuities with the Titmus in our study were better than 100 arcsec, the difference observed between TNO and Titmus is unlikely due to monocular cues.
Furthermore, the use of red-green glasses in the TNO vs polaroid glasses in the Titmus has been suggested as another factor influencing the stereoacuities measured by each test in healthy subjects. In anaglyphic tests, luminous transmittance and contrast difference between the red and green may affect suppression tendencies and overall reduction in stereopsis in some subjects.27 In this study, this reduction was also observed in stereoacuities measured with TNO, in both diabetic and non-diabetic groups. But worse stereoacuities were observed in the diabetic group. One may speculate that the damage to the color processing pathways in the diabetic group has led to worse findings with TNO. However, most studies on color vision in diabetic patients agree that the blue-yellow color axis is predominately affected in patients with diabetic retinopathy and uncertainty exists over whether color vision defect exists in diabetics without retinopathy.28 Therefore, any damage to the color vision pathway, prior to retinopathy, especially along the red-green axis, is highly unlikely to affect the stereo findings with the TNO.
Furthermore, the differences in the size and forms of the targets presented in TNO and Titmus tests could have influenced our findings. In Titmus, the targets are small well defined circles which might have stimulated more of the midget cells in the retina or the parvocellular pathway from retina to visual area V1, V2 (interstripe regions and thin strip region) and further cortical areas. In Titmus test, further, the process of form recognition happens prior to the fusion of the targets and eventually perception of depth. While in TNO a greater area of dots with no apparent shape are presented to the subjects which might stimulated more of larger ganglion cells with extended dendrites (Parasol cells) leading to magnocellular pathway to V1 and V2 (thick stripe regions). In test, the fusion of two areas happen first prior to recognition of form and perception of depth.
However, in the diabetic group, with TNO, a greater reduction in the stereoacuities was observed. This might indicate that in the diabetic group, the larger retinal ganglion cells, with higher sensitivity to low spatial frequencies have been damaged more than smaller ganglion cells, with higher sensitivity to high spatial frequencies. Therefore, the magnocellular pathway is affected more than the parvocellular pathway. Two following studies provide some evidence that some retinal ganglion cells are affected in early diabetic retinopathy. Recent OCT findings revealed that pockets of ganglion cell volume loss have been observed in patients with very mild NPDR compared with the non-diabetic group.29 However the type of the cell in these pockets were not clear. There is also evidence that retrograde axonal transport is impaired for large and medium retinal ganglion cell types in diabetic rats.30 Our finding in this study may indicate that in early diabetic retinopathy the magnocellular pathway is more vulnerable than the parvocellular pathway.
The strength of this study is that it investigated stereopsis in diabetic patients for the first time. The presence of the control group further provided the chance to compare the findings of the diabetic patients with the normal age-matched subjects. This design ruled out the possible role of age as the confounding variable. The limitation of this study was the lack of knowledge about the level of blood sugar just prior to the stereopsis testing. In this study only one test for each of the local and global pathways was selected. Further testing with different stereo tests are recommended for future studies.
The findings of this study showed that patients with early diabetic retinopathy performed worse in TNO (global) vs Titmus (local) tests of stereopsis. This difference supports the parallel and the serial types of processing. Considering that larger ganglion cells in the retina might have been further damaged than the small ganglion cell, the presence of two parallel magnocellular and parvocellular pathways of processing for depth perception is supported. The extensive evidence regarding the thickness reduction in the ganglion cell layer and the retinal nerve fiber layer in the early stages of DR2–6,8–10,29,31–33 further supports the parallel pathways of depth perception. Our findings also do not rule out the serial model of processing. The global process is believed to involve two serial stages: 1) the processing of local disparity in early visual areas of V1V2 by disparity selective cells, binocular cells with localized receptive field; and 2) processing corrugations of disparity by cells with much larger receptive fields in higher visual brain areas that involve the integration of local stereoscopic information over large spatial distances. Our findings might indicate that the damage to the global pathway has happened in higher cortical areas. Further investigations with advanced imaging techniques such as fMRI, and PET scanning are required to provide support for this model. Our findings in early diabetic patients revealed that there might be different underlying mechanisms for local and global stereopsis.
Disclosure
The authors report no conflicts of interest in this work.
References
1. Scanlon P, Aldington S, Wilkinson C, Matthews D. A Practical Manual of Diabetic Retinopathy Management. Wiley Online Library; 2009.
2. Park HY-L, Kim IT, Park CK. Early diabetic changes in the nerve fibre layer at the macula detected by spectral domain optical coherence tomography. Br J Ophthalmol. 2011;95:1223–1228. doi:10.1136/bjo.2010.191841
3. Peng P-H, Lin H-S, Lin S. Nerve fibre layer thinning in patients with preclinical retinopathy. Can J Ophthalmol. 2009;44(4):417–422. doi:10.3129/i09-112
4. Skarf B. Retinal Nerve Fibre Layer Loss in Diabetes Mellitus Without Retinopathy. BMJ Publishing Group Ltd; 2002.
5. Verma A, Raman R, Vaitheeswaran K, et al. Does neuronal damage precede vascular damage in subjects with type 2 diabetes mellitus and having no clinical diabetic retinopathy? Ophthalmic Res. 2012;47(4):202–207. doi:10.1159/000333220
6. Vujosevic S, Midena E. Retinal layers changes in human preclinical and early clinical diabetic retinopathy support early retinal neuronal and müller cells alterations. J Diabetes Res. 2013;2013:1–8. doi:10.1155/2013/905058
7. Van Dijk HW, Verbraak FD, Kok PH, et al. Early neurodegeneration in the retina of type 2 diabetic patients. Invest Ophthalmol Vis Sci. 2012;53(6):2715–2719. doi:10.1167/iovs.11-8997
8. DeBuc DC, Somfai GM. Early detection of retinal thickness changes in diabetes using optical coherence tomography. Med Sci Monit. 2010;16(3):MT15–MT21.
9. Bressler NM, Edwards AR, Antoszyk AN, et al. Retinal thickness on stratus optical coherence tomography in people with diabetes and minimal or no diabetic retinopathy. Am J Ophthalmol. 2008;145(5):894–901. e1. doi:10.1016/j.ajo.2007.12.025
10. Oshitari T, Hanawa K, Adachi-Usami E. Changes of macular and RNFL thicknesses measured by Stratus OCT in patients with early stage diabetes. Eye. 2009;23(4):884–889. doi:10.1038/eye.2008.119
11. Lieth E, Gardner TW, Barber AJ, Antonetti DA. Retinal neurodegeneration: early pathology in diabetes. Clin Experiment Ophthalmol. 2000;28(1):3–8. doi:10.1046/j.1442-9071.2000.00222.x
12. Safi H, Safi S, Hafezi-Moghadam A, Ahmadieh H. Early detection of diabetic retinopathy. Surv Ophthalmol. 2018;63:601–608. doi:10.1016/j.survophthal.2018.04.003
13. Ismail G, Whitaker D. Early detection of changes in visual function in diabetes mellitus. Ophthalmic Physiological Optics. 1997;17(2):176. doi:10.1016/S0275-5408(97)80758-2
14. Wolff B, Bearse M
15. Gella L, Raman R, Kulothungan V, Pal SS, Ganesan S, Sharma T. Impairment of colour vision in diabetes with no retinopathy: Sankara Nethralaya Diabetic Retinopathy Epidemiology and Molecular Genetics Study (SNDREAMS-II, report 3). PLoS One. 2015;10(6):e0129391. doi:10.1371/journal.pone.0129391
16. American Diabetes Association. Diagnosis and classification of diabetes mellitus. Diabetes Care. 2013;36(Supplement 1):S67–S74. doi:10.2337/dc13-S067.
17. Witz N, Hess RF. Mechanisms underlying global stereopsis in fovea and periphery. Vision Res. 2013;87:10–21. doi:10.1016/j.visres.2013.05.003
18. Ptito A, Zatorre RJ, Larson WL, Tosoni C. Stereopsis after unilateral anterior temporal lobectomy: dissociation between local and global measures. Brain. 1991;114(3):1323–1333. doi:10.1093/brain/114.3.1323
19. Rose D, Price E. Functional separation of global and local stereopsis investigated by cross-adaptation. Neuropsychologia. 1995;33(3):269–274. doi:10.1016/0028-3932(94)00122-6
20. Armstrong R. Oculo-visual dysfunction in Parkinson’s disease. J Parkinson’s Dis. 2015;5(4):715–726. doi:10.3233/JPD-150686
21. Lee C-N, Ko D, Suh Y-W, Park K-W. Cognitive functions and stereopsis in patients with Parkinson’s disease and Alzheimer’s disease using 3-dimensional television: a case controlled trial. PLoS One. 2015;10(3):e0123229. doi:10.1371/journal.pone.0123229
22. Schechter I, Butler PD, Jalbrzikowski M, Pasternak R, Saperstein AM, Javitt DC. A new dimension of sensory dysfunction: stereopsis deficits in schizophrenia. Biol Psychiatry. 2006;60(11):1282–1284. doi:10.1016/j.biopsych.2006.03.064
23. Sobaci G, Demirkaya S, Gundogan FC, Mutlu FM. Stereoacuity testing discloses abnormalities in multiple sclerosis without optic neuritis. J Neuro-Ophthalmol. 2009;29(3):197–202. doi:10.1097/WNO.0b013e3181b56764
24. Davis MD, Fisher MR, Gangnon RE, et al. Risk factors for high-risk proliferative diabetic retinopathy and severe visual loss: early treatment diabetic retinopathy study report# 18. Invest Ophthalmol Vis Sci. 1998;39(2):233–252.
25. Saladin JJ. “Starkfest” vision and clinic science special issue: effects of heterophoria on stereopsis. Optometry Vision Sci. 1995;72(7):487–492. doi:10.1097/00006324-199507000-00008
26. Marsh WR, Rawlings SC, Mumma JV. Evaluation of clinical stereoacuity tests. Ophthalmolo. 1980;87(12):1265–1272. doi:10.1016/S0161-6420(80)35096-3
27. Antona B, Barrio A, Sanchez I, Gonzalez E, Gonzalez G. Intraexaminer repeatability and agreement in stereoacuity measurements made in young adults. Int J Ophthalmol. 2015;8(2):374.
28. Ismail GM, Whitaker D. Early detection of changes in visual function in diabetes mellitus. Ophthalmic Physiological Optics. 1998;18(1):3–12. doi:10.1016/S0275-5408(97)00043-4
29. Srinivasan S, Dehghani C, Pritchard N, et al. Corneal and retinal neuronal degeneration in early stages of diabetic retinopathy. Invest Ophthalmol Vis Sci. 2017;58(14):6365–6373. doi:10.1167/iovs.17-22736
30. Zhang L, Ino-ue M, Dong K, Yamamoto M. Retrograde axonal transport impairment of large-and medium-sized retinal ganglion cells in diabetic rat. Curr Eye Res. 2000;20(2):131–136. doi:10.1076/0271-3683(200002)2021-DFT131
31. Chihara E, Matsuoka T, Ogura Y, Matsumura M. Retinal nerve fiber layer defect as an early manifestation of diabetic retinopathy. Ophthalmolo. 1993;100(8):1147–1151. doi:10.1016/S0161-6420(93)31513-7
32. Rodrigues EB, Urias MG, Penha FM, et al. Diabetes induces changes in neuroretina before retinal vessels: a spectral-domain optical coherence tomography study. Int J Retina Vitreous. 2015;1(1):4. doi:10.1186/s40942-015-0001-z
33. Salvi L, Plateroti P, Balducci S, et al. Abnormalities of retinal ganglion cell complex at optical coherence tomography in patients with type 2 diabetes: a sign of diabetic polyneuropathy, not retinopathy. J Diabetes Complications. 2016;30(3):469–476. doi:10.1016/j.jdiacomp.2015.12.025
 © 2020 The Author(s). This work is published and licensed by Dove Medical Press Limited. The
full terms of this license are available at https://www.dovepress.com/terms
and incorporate the Creative Commons Attribution
- Non Commercial (unported, 3.0) License.
By accessing the work you hereby accept the Terms. Non-commercial uses of the work are permitted
without any further permission from Dove Medical Press Limited, provided the work is properly
attributed. For permission for commercial use of this work, please see paragraphs 4.2 and 5 of our Terms.
© 2020 The Author(s). This work is published and licensed by Dove Medical Press Limited. The
full terms of this license are available at https://www.dovepress.com/terms
and incorporate the Creative Commons Attribution
- Non Commercial (unported, 3.0) License.
By accessing the work you hereby accept the Terms. Non-commercial uses of the work are permitted
without any further permission from Dove Medical Press Limited, provided the work is properly
attributed. For permission for commercial use of this work, please see paragraphs 4.2 and 5 of our Terms.