Back to Journals » International Journal of Nanomedicine » Volume 11
Stealth, biocompatible monoolein-based lyotropic liquid crystalline nanoparticles for enhanced aloe-emodin delivery to breast cancer cells: in vitro and in vivo studies
Authors Freag M, Elnaggar Y ![]() , Abdelmonsif D
, Abdelmonsif D ![]() , Y. Abdallah O
, Y. Abdallah O
Received 30 April 2016
Accepted for publication 10 June 2016
Published 20 September 2016 Volume 2016:11 Pages 4799—4818
DOI https://doi.org/10.2147/IJN.S111736
Checked for plagiarism Yes
Review by Single anonymous peer review
Peer reviewer comments 4
Editor who approved publication: Dr Thomas Webster
May S Freag,1 Yosra SR Elnaggar,1,2 Doaa A Abdelmonsif,3 Ossama Y Abdallah1
1Department of Pharmaceutics, Faculty of Pharmacy, Alexandria University, 2Department of Pharmaceutics, Faculty of Pharmacy and Drug Manufacturing, Pharos University in Alexandria, 3Department of Medical Biochemistry, Faculty of Medicine, Alexandria University, Alexandria, Egypt
Abstract: Recently, research has progressively highlighted on clues from conventional use of herbal medicines to introduce new anticancer drugs. Aloe-emodin (AE) is a herbal drug with promising anticancer activity. Nevertheless, its clinical utility is handicapped by its low solubility. For the first time, this study aims to the fabrication of surface-functionalized polyethylene glycol liquid crystalline nanoparticles (PEG-LCNPs) of AE to enhance its water solubility and enable its anticancer use. Developed AE-PEG-LCNPs were optimized via particle size and zeta potential measurements. Phase behavior, solid state characteristics, hemocompatibility, and serum stability of LCNPs were assessed. Sterile formulations were developed using various sterilization technologies. Furthermore, the potential of the formulations was investigated using cell culture, pharmacokinetics, biodistribution, and toxicity studies. AE-PEG-LCNPs showed particle size of 190 nm and zeta potential of -49.9, and PEGylation approach reduced the monoolein hemolytic tendency to 3% and increased the serum stability of the nanoparticles. Sterilization of liquid and lyophilized AE-PEG-LCNPs via autoclaving and γ-radiations, respectively, insignificantly affected the physicochemical properties of the nanoparticles. Half maximal inhibitory concentration of AE-PEG-LCNPs was 3.6-fold lower than free AE after 48 hours and their cellular uptake was threefold higher than free AE after 24-hour incubation. AE-PEG-LCNPs presented 5.4-fold increase in t1/2 compared with free AE. Biodistribution and toxicity studies showed reduced AE-PEG-LCNP uptake by reticuloendothelial system organs and good safety profile. PEGylated LCNPs could serve as a promising nanocarrier for efficient delivery of AE to cancerous cells.
Keywords: aloe-emodin, anticancer, breast cancer cell line, liquid crystalline nanoparticles, monoolein, pharmacokinetics
Introduction
Recently, herbal drugs have been emerged as one of the promising approaches for cancer therapy with reduced toxicity. Moreover, evidences have proven that numerous herbal drugs are beneficial in sensitizing conventional chemotherapy, alleviating its side effects, and augmenting the quality of life in patients with cancer. Aloe-emodin (AE) is isolated from either Aloe barbadensis Miller or Rheum palmatum L.1 AE belongs to anthraquinones with a structural formula as illustrated in Figure 1. Various pharmacological activities have been demonstrated by AE, including hepatoprotective, antioxidative, antimicrobial, and immunosuppressive activities.2–5 Recently, AE has attracted great attention by virtue of its promising anticancer activity. AE exhibited a remarkable cytotoxic effect against breast, colon, liver, and lung cancer cell lines mediated by different mechanisms of action including cell cycle disruption, apoptotic, anti-angiogenic, anti-metastatic, and immunostimulant action.6
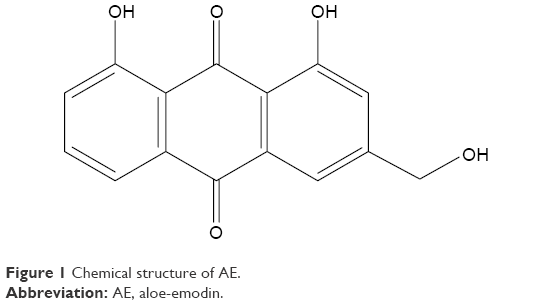 | Figure 1 Chemical structure of AE. |
However, AE has low oral bioavailability that could be attributed to its poor aqueous solubility, erratic intestinal absorption, as well as its pre-systemic metabolism via glucuronidation and P-glycoprotein efflux process.7 This scanty bioavailability compromises the oral efficacy of AE. On the other hand, parenteral administration of AE for chemotherapy is disabled by its hydrophobicity and inherent crystallization tendency in aqueous solution. Therefore, a novel drug delivery system is required to overcome the poor bioavailability of AE and enable its parenteral use. Various attempts have been made to enhance the delivery of AE, including β-cyclodextrin inclusion complexes,8 solid dispersions,7 liposomes,9 and solid lipid nanoparticles.1 However, cyclodextrins are associated with toxicity and liposomal instability, which are the possible drawbacks. Furthermore, solid lipid nanoparticles have low drug encapsulation and sophisticated techniques are required for their preparation.10 Hence, other drug delivery systems are required to ameliorate these obstacles and to improve the anticancer efficacy of AE.
In recent years, liquid crystalline nanoparticles (LCNPs) have attracted many researchers as a promising nanocarrier for different drugs and routes of administration.11–13 LCNPs combine the merits of both particulate and fluidic delivery systems, including enhanced colloidal stability, sustained release profile, flexible structure, and self-assembling properties.14 Besides, LCNPs have been reported to efficiently encapsulate hydrophilic, hydrophobic, and amphiphilic drugs and to facilitate the absorption of these drugs via various mechanisms such as membrane-fusing properties, receptor-mediated endocytosis, and absorption transporters.15 Moreover, the presence of functional groups within their forming materials offers the possibility of surface modifications with various targeting ligands.16 Generally, lyotropic liquid crystalline (LC) phases are formed upon mixing polar lipids with polar solvent in the presence of stabilizer, demonstrating the existence of many non-lamellar structures consisting of hydrophilic and lipophilic domains. These self-assembled structures include bicontinuous cubic (Q2) and reversed hexagonal (H2) phases and in some particular cases discrete micellar cubic phase (I2).17 However, the high viscosity of LC phases (gel form) extremely limits their applications in drug delivery. LC phase can be dispersed in aqueous media by means of mechanical or ultrasonic energy to form submicron particles called LCNPs. LCNP dispersions have various advantages over LC phases, including enhanced surface area, lower viscosity, and nano-size range enabling parenteral administration. Various types of liquid crystal-forming lipids have been used for the preparation of LCNPs, including glyceryl monooleate (monoolein, MO), phytantriol, glycolipids, glycerates, and others. Special emphasis was directed to MO as a promising amphiphilic lipid vehicle for drug delivery by virtue of its unique properties including safety, biodegradability, and biocompatibility.17 However, the reported tendency of MO to induce hemolysis compromises its parenteral usage, especially for intravenous (IV) administration.18 Therefore, PEGylation (polyethylene glycol, PEG) is used to improve the hemocompatibility of MO-based systems.14,19–21
In passive targeting, hydrophilic polymers, such as PEG, are commonly utilized to decorate the surface of the nanoparticles with the aim of reducing their immunogenicity, prolonging their circulation half-life, and promoting their accumulation in tumors due to the enhanced permeability and retention effect.22 PEGylation is well known to prolong the circulatory time via two mechanisms: 1) it increases the hydrodynamic size of the particles decreasing their renal clearance (CL) and 2) it provides a dense hydrophilic shell covering the nanoparticle surface, thus preventing their recognition by serum proteins (eg, opsonins) resulting in reduced uptake by the reticuloendothelial system (RES).23
Taking the abovementioned advantages into account, this study was the first to prepare novel injectable AE-loaded PEGylated LCNPs to improve its water solubility and enhance its anticancer effect. Complete physicochemical appraisal was carried out. Hemocompatibility studies were conducted on whole blood from female Wistar rats. Cytotoxicity and uptake studies were performed on human breast adenocarcinoma cell line (MCF-7). In vivo pharmacokinetics, biodistribution, and toxicity studies were performed to investigate the in vivo performance of AE-loaded PEGylated LCNPs.
Materials and methods
Materials
AE (purity 98%) was purchased from Jianshi Yuantong Bioengineering Co., Ltd (People’s Republic of China). Glyceryl monooleate (MO; Peceol®) was kindly provided by Gattefosse (France). N-(carbonyl-methoxypolyethylenglycol-2000)-1,2-distearoyl-sn-glycero-3 phosphoethanolamine (mPEG2kDSPE) was kindly provided by Lipoid (Germany) and Poloxamer-407 (P407) was obtained from Fluka (Germany). Dulbecco’s Modified Eagle’s Medium (DMEM), fetal bovine serum (FBS), 3-(4,5-dimethylthiazol-2-yl)-2, 5-diphenyltetrazolium bromide (MTT), and bovine serum albumin were purchased from Sigma-Aldrich Co. (St Louis, MO, USA). Bradford reagents were purchased from Bio-Rad Laboratories Inc. (Hercules, CA, USA). Alanine aminotransferase (ALT) and aspartate aminotransferase (AST) activity and Creatinine Assay Kits were purchased from Spectrum (Hannover, Germany). Moreover, Urea Assay Kit was purchased from Diamond Diagnostics (Hannover, Germany). All other reagents and chemicals were of analytical grade.
Preparation of AE-loaded LCNP dispersions
LCNP dispersions were prepared using two different methods.
Emulsification method
In this technique, LCNPs were fabricated as described by Esposito et al.24 Appropriate weights of MO (4% w/v), AE (0.04% w/v), and P407 (0.5% w/v) were melted in a water bath (Type 3047; Kottermann, Hanigsen, Germany) at 70°C. The molten mixture was then added dropwise into water preheated to 70°C under magnetic stirring for 15 minutes. Dispersions were then homogenized at maximum power of 13,500 rpm (IKA ULTRA-TURRAX T-25; Staufen, Germany) for 1 minute until a uniform opaque yellow mixture without aggregates was formed.
PEGylated LCNPs were prepared in the same method mentioned earlier, while mPEG2kDSPE was incorporated within the molten mixture of MO, AE, and P407 prior to emulsification into water.
Film hydration method
In this method, AE-LCNP dispersions were prepared according to the method of Esposito et al.25 Briefly, MO (1 g), AE (10 mg), and P407 (125 mg) were dissolved in 15 mL chloroform. Chloroform was then evaporated under vacuum at 60 rpm, 60°C±2°C for 15 minutes, using a rotary evaporator (WK 300 Lauda; Buchi Laboratoriums-Technik AG, Flawil, Switzerland) until a thin film was formed. Coarse dispersion, formed by addition of 25 mL water onto the dry lipid film under sonication, was then maintained at a temperature of 80°C for 15 minutes in a water bath (Type 3047). The dispersion was then homogenized at 13,500 rpm for 1 minute (IKA ULTRA-TURRAX T-25). AE-LCNPs were formed as the dispersion gradually cooled down to room temperature.
Optimization of LCNPs was carried out by screening different formulation variables including stabilizer concentration, initial drug loading, and concentration of mPEG2kDSPE. Formulations were evaluated for their physicochemical characteristics manifested as particle size (PS), polydispersity index (PDI), zeta potential (ζ-potential, ZP), and encapsulation efficiency. During optimization, other experimental parameters including the amount of MO added (4% w/v with respect to dispersion), stirring time (15 minutes), homogenization (time and speed), and final volume of dispersion (25 mL) were kept constant. Optimized formulations were subjected to lyophilization using 5% w/v mannitol as a cryoprotectant (details about the lyophilization procedure are reported in the Supplementary materials).
Characterization of AE-LCNPs
PS and ZP
AE-LCNPs were evaluated for their mean PS, PDI, and ZP via dynamic light scattering (DLS) technique using Zetasizer (Nano ZS; Malvern Instruments, Malvern, UK). All samples were diluted with distilled water (1:50) to obtain final experimental values in triplicates. Results are shown as mean ± SD.
Entrapment efficiency
Entrapment efficiency (%EE) was determined by ultrafiltration technique.26 AE-LCNP dispersions (3 mL) were transferred to Vivaspin ultracentrifuge tube (Vivaspin® 6, molecular weight cutoff [MWCO] 100,000; Vivaproducts, Inc., Littleton, MA, USA) followed by centrifugation (Model 3K-3o; Sigma Laboratory Refrigerated Centrifuge, Germany) at 4,000 rpm for 30 minutes. The actual amount of AE entrapped in the LCNPs was calculated as the difference between the initial amount of AE used in the preparation of LCNPs and the amount of unentrapped AE separated in the filtrate, as determined spectrophotometrically at λmax =431 nm.
|
|

Phase behavior study
Phase behavior of blank LC mesophase after the incorporation of AE and/or mPEG2kDSPE was characterized using crossed polarized light microscopy. Polarized light microscopy was performed on macro-dispersion prepared by the emulsification method as mentioned earlier but without the size reduction (homogenization) step to get representative micron-sized particles. Approximately 200 μL of the macro-dispersion was placed on a glass slide and then covered with a coverslip. The textures of LC phases were characterized using a Zeiss Axiovert 40 MAT Microscope (Carl Zeiss Meditec AG, Jena, Germany) fitted with a camera at a magnification of 100×.
Transmission electron microscopy
The morphological analysis of liquid state blank LCNPs, AE-LCNPs, and AE-PEGylated LCNPs was observed by transmission electron microscopy (TEM; JEM-1400; Jeol Ltd., Tokyo, Japan). Samples were diluted (1:20) with distilled water and stirred for 3 minutes. A drop of the resultant dispersion was placed onto a carbon-coated copper grid, leaving a thin film. The films were then negatively stained by a drop of 1% w/v aqueous solution of phosphotungstic acid, removing the excess staining solution using a filter paper, and left for air-drying. The stained films were then viewed on a TEM and photographed.
Solid state characterization
Differential scanning calorimetry
Differential scanning calorimetry (DSC) analysis was performed to investigate the thermal behavior of AE entrapped in the formulated LCNPs. Briefly, 2–3 mg of the lyophilized sample was loaded in aluminum pan and heated at the speed of 10°C/min from 30°C to 300°C in nitrogen atmosphere (60 mL/min). Thermograms of free AE, blank LCNPs, AE-LCNPs, and AE-PEGylated LCNPs were recorded using DSC 6 differential scanning calorimeter (PerkinElmer Inc., Waltham, MA, USA).
Fourier transform infrared spectroscopy
Fourier transform infrared spectroscopy (FTIR) analysis was performed using an FTIR spectrometer (PerkinElmer Inc.). Samples were finely ground with dry crystalline KBr in a ratio of 1:100, and pellets were prepared. A spectrum was obtained for each sample within the wave number region of 4,000–500 cm−1. Samples investigated were free AE, blank LCNPs, AE-LCNPs, and AE-PEGylated LCNPs.
X-ray powder diffraction
To assess the crystallinity of the AE loaded in LCNPs, X-ray powder diffraction (XRD) analysis was carried out using XRD-7000 X-ray diffractometer (Shimadzu, Kyoto, Japan). Cu Kα1 radiation was selected by a Ni monochromator. The diffraction pattern was carried out in a step scan model with a voltage of 30 kV and a current of 30 mA in the range of 10°<2θ<40°, with a step size of 0.02°. Samples assessed were free AE and lyophilized powdered samples of blank LCNPs, AE-LCNPs, and AE-PEGylated LCNPs.
In vitro release
For the selection of suitable dissolution medium for AE, a solubility study of AE in phosphate buffer (pH 7.4) with different surfactant concentrations (Tween 80; 0.1%–1% v/v) was performed. In vitro drug release from the LCNPs was performed using dialysis bag method. Free AE, selected AE-LCNPs, and AE-PEGylated LCNPs (equivalent to 2.5 mg AE) were added into a sealed dialysis bag (MWCO: 12–14 kDa). The dialysis bags were placed in 500 mL phosphate buffer, pH 7.4, containing 1% v/v Tween 80 to maintain sink conditions and incubated at 37°C with a shaking speed of 75 rpm in shaking water bath. A 3 mL sample was withdrawn at 1 hour, 2 hours, 4 hours, 6 hours, 24 hours, and 48 hours followed by compensation with the same volume of fresh release medium. The samples were filtered using 0.45 μm Millipore filter (Millipore®; Thermo Fisher Scientific, Waltham, MA, USA) and then measured spectrophotometrically at λmax =431 nm using the corresponding fresh release medium as a blank.
Hemocompatibility studies
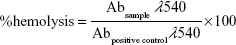
Hemolytic toxicity study was performed according to the method of Jain et al,14 with some modifications. Briefly, heparinized vials containing fresh whole rabbit blood were centrifuged at 2,000 rpm for 15 minutes (Model 3K-3o). Sediment red blood cells (RBCs) were washed with normal saline (0.9% w/v) and then diluted with normal saline to obtain 2% v/v RBC suspension. Blank LCNPs, AE-LCNPs, and selected AE-PEGylated LCNPs were incubated with equal volume of RBC suspension at 37°C for 0.5 hours and 2 hours with gentle shaking. After incubation, samples were centrifuged for 5 minutes at 3,000 rpm and supernatants were taken to quantify the hemoglobin (Hb) content spectrophotometrically at λmax =540 nm, against negative control (1 mL RBCs diluted with 1 mL normal saline). 1% Triton-X-treated RBCs were used as positive control (Abpositive control) inducing 100% hemolysis. The percent hemolysis was calculated using the following equation:
|
|
Serum stability study
To assess the physical stability of LCNPs in biologically relevant media, the stability of LCNPs in 10% FBS solution was determined. Equal volumes (1.25 mL) of both PEGylated and non-PEGylated LCNPs were added to 5 mL of 10% FBS. The resulting mixtures were incubated at 37°C under continuous stirring (200 rpm) to simulate blood circulation conditions.27 Samples were withdrawn at different time points and diluted in distilled water (1:50 v/v) and assessed for PDI and PS, using a Zetasizer (Nano ZS).
Sterilization of AE-PEG-LCNPs
Sterile filtration
In this technique, the AE-PEG-LCNP dispersion was filtered through polytetrafluoroethylene using 0.22 μm Millipore filter under sterile conditions.
Autoclaving
The AE-PEG-LCNP dispersions were placed in glass vials sealed with rubber stoppers and aluminum caps. The dispersions were autoclaved at 121°C, 2 bar, for 20 minutes (Priorclave®, UK) according to the European Pharmacopeia recommendations for sterilization of pharmaceutical products.28
Gamma sterilization
Lyophilized AE-PEG-LCNPs were sterilized by γ-irradiation using a 60Co irradiator (Gamma 220) available at the Atomic Energy Agency Facility in Egypt. To ensure effective sterilization, lyophilized AE-PEG-LCNP powder was placed in glass vials with rubber stoppers and aluminum caps and irradiated with a dose of 25 kGy according to the European Pharmacopeia recommendations.28
The effect of the sterilization processes on the physicochemical properties of the PEGylated LCNPs on the encapsulated AE was then studied. Previously validated high-performance liquid chromatography (HPLC) method was used to ensure the stability of AE after sterilization process.7 Unsterilized samples were used as controls for further comparisons.
In vitro anticancer study
Cell lines and cell culture
Human breast adenocarcinoma cell line (MCF-7) was purchased from the American Type Culture Collection (ATCC, Manassas, VA, USA). Cells were maintained and grown at 37°C under 5% CO2 in DMEM enriched with 10% (v/v) FBS and antibiotics (100 U/mL penicillin, 100 μg/mL streptomycin, and amphotericin B).
In vitro cytotoxicity
The well-known quantitative MTT assay was used to determine the cell viability by seeding 1×10⁴ MCF-7 cells per well in 96-well culture plate containing 200 μL culture medium. Cells were left for 24 hours to allow cell attachment. Then, the medium was removed and the attached cells were incubated with different concentrations of free AE, AE-LCNPs, AE-PEGylated LCNPs, and blank LCNPs for 24 hours and 48 hours. After incubation, the medium was replaced with 1 mg/mL MTT in DMEM and incubated for 4 hours at 37°C in the dark. Afterward, the medium was removed by centrifugation at 2,000 rpm for 10 minutes. Approximately 200 μL dimethyl sulfoxide was used to dissolve the formazan crystals converting from the MTT. The absorbance of the resulting solution was determined by a microplate reader (BioTek Instruments, Inc., Winooski, VT, USA) at 570 nm. Percentage cell viability was calculated by comparing the optical density of cells treated with each formulation with the optical density of control cells treated with culture medium only.
Cellular uptake of AE-LCNPs
The cellular uptake of AE-LCNPs was determined following a reported fluorescence technique.1 In a six-well plate, 1×10⁶ MCF-7 cells per well were seeded and left overnight to allow time for cell adherence. Cells were then incubated with fresh medium containing free AE, AE-LCNPs, and AE-PEGylated LCNPs medium at fixed drug concentration of 5 μM. After fixed time intervals, 2 hours, 4 hours, and 24 hours, the medium was discarded and cells were washed twice with normal saline to remove the extracellular drug residues. Cells were then scraped and lysed by further incubation in 1% Triton for 10 minutes at 4°C followed by centrifugation for 20 minutes at 12,000 rpm. After cell lysis, the intracellular fluorescence intensities of AE in the resulting supernatants were quantified by fluorescence spectrophotometer at λex =410 nm and λem =510 nm. At the same time, supernatants were analyzed for their protein concentrations by Bradford colorimetric assay to quantify the amount of AE uptaken with respect to the cellular protein content. Results are expressed as microgram AE/milligram of protein.
In vivo studies
Animals
Adult female Wistar rats (180–220 g, 8 weeks old) were enrolled in the in vivo studies. The animals were kept in standard metal cages at 21°C±1°C and 65% relative humidity with a 10-hour light/14-hour dark cycle upon their arrival. They were administered standard chow and water ad libitum during the study and allowed to adapt to their environment for about 2 weeks before the experiment. The animals were kept at the animal house of Faculty of Medicine, Alexandria University, Egypt. Animals were treated according to the ethical guidelines of Alexandria University after obtaining Alexandria Univeristy Institutional Ethical Committee approval. In addition, animals’ suffering was reduced according to the internationally accepted principles for laboratory use and care of the European Community (EEC Directive of 1986; 86/609/EEC).
Pharmacokinetic study
A total of 18 female Wistar rats (180–200 g, 8 weeks old) were enrolled in this study. The animals were divided into three groups (six animals per group) for free AE, AE-LCNPs, and AE-PEG-LCNPs. The animals were given their formulations by intraperitoneal (IP) injection at fixed AE concentration of 7.5 mg/kg. Under mild anesthesia, whole blood (0.5 mL) was collected from the retro-orbital plexus of animals into heparinized tubes (BD Vacutainer® Lithium Heparin 37 USP unit; BD, Franklin Lakes, NJ, USA) at 0 minute, 5 minutes, 30 minutes, 1 hour, 2 hours, 4 hours, 6 hours, and 8 hours after dosing. Afterward, whole blood was centrifuged at 3,500 rpm for 5 minutes and the plasma was kept at −20°C till HPLC analysis.
Tissue distribution study
On the test day, the three groups of rats (free AE, AE-LCNPs, and AE-PEG-LCNPs; six animals per group) were administered the formulations by IP injection at fixed AE concentration of 7.5 mg/kg 1 hour before being sacrificed. Major organs such as liver, kidneys, heart, spleen, and lungs were excised and washed with cold saline, then blotted with filter paper, and weighed. The organs were then stored at −80°C till analysis.
Biosample preparation and HPLC analysis
First, tissue homogenates were prepared by homogenization of 250 mg tissue in 1 mL normal saline (0.9%) using a Tissue Tearor (BioSpec Products, Bartlesville, OK, USA). Upon 200 μL plasma or tissue homogenates, 200 μL of acetonitrile was added and vortexed for 1 minute. After standing for 5 minutes, the mixture was centrifuged at 3,500 rpm for 5 minutes. A 50 μL of supernatant filtered earlier through 0.45 μm filters was automatically injected concurrently with the standard solutions into an Agilent HPLC system. The HPLC instrument (1260 Infinity LC systems; Agilent Technologies, Santa Clara, CA, USA) was equipped with a reversed-phase C18 column (25 cm ×4.6 mm; PS =5 μm) and 1260 Infinity Diode Array Detector. The system was also equipped with Agilent ChemStation® Software. A previously validated HPLC method was utilized for the determination of AE, with slight modification.7 The samples were eluted isocratically using acetonitrile–water–phosphoric acid (64:36:0.1, v/v/v) at a flow rate of 1 mL/min at column temperature of 30°C and wavelength of 254 nm. The calibration curve of peak area against AE concentration was y =188.45x +39.105, R2=0.9961, under concentration range of 0.15–50 μg/mL. Retention time was 5.8±0.1 minutes.
Pharmacokinetic analysis
Non-compartmental model was used to calculate the pharmacokinetic parameters from plasma concentration–time data using the software WinNonlin® (Pharsight Corporation, St Louis, MO, USA). Pharmacokinetic parameters such as total area under the curve (AUC0→∞), peak plasma concentration (Cmax), time to reach the maximum plasma concentration (Tmax), elimination half-life (t1/2), body CL, mean residence time, and elimination rate constant (Kel) were calculated.
In vivo toxicity study
Adult female Wistar rats (180–220 g, 8 weeks old, total of 24 animals) were included in the current study. The rats were randomly assigned into four groups (six animals per group). The groups encompassed were as follows: negative controls, free AE (freshly prepared AE solution in 0.5% v/v dimethyl sulfoxide and 99.5% normal saline [7.5 mg/kg per day]), AE-loaded LCNPs (AE-LCNPs), and AE-loaded PEGylated LCNPs (AE-PEG-LCNPs), which were equivalent to fixed AE concentration of 7.5 mg/kg per day and total lipids of 555 mg/kg per day. Each group of animals (from groups 2 to 4) was given a single IP daily dose of its formulation (0.1 mL) till the seventh day of the experiment. The animals were observed for at least 30 minutes after administration of the formulations to detect any abnormal responses (ie, hematological, neuronal, cardiac, or others) to the given formulations. Using an electronic balance (Precisa Instrument, Dietikon, Switzerland), body weight of each rat was recorded from the beginning of the study and continued for a week after. The amounts of food (g/day) and water (mL/day) consumed by animals were also calculated by measuring the amounts of food and water consumed during 24 hours twice weekly and considering the mean of them to be used for that week. Moreover, animals were observed for any clinical signs of toxicity such as skin, fur or mucous membrane changes, diarrhea, salivation, and mortalities during the first 24 hours of treatment and then daily till the end of the study. The animals were sacrificed by decapitation on day 8 of the experiment. After that, major organs (liver, spleen, kidneys, brain, etc) of control and treated animals were examined for any significant changes in shape and texture.
Hematological study
Blood was collected from each animal into tubes with heparin, and all hematological parameters were measured using an Advia 120 Hematology Analyzer (Siemens, Germany). The parameters determined were the percentages of neutrophils, monocytes, and lymphocytes. Moreover, WBC count, RBC count, hematocrit (Ht), Hb, mean corpuscular volume (MCV), mean corpuscular hemoglobin concentration (MCHC), mean corpuscular hemoglobin (MCH), red cell distribution width (RDW), and platelets count were calculated.
Biochemical tests
Another blood sample was collected from each animal, allowed to clot, and subjected to centrifugation at 3,000 rpm for 15 minutes. The obtained serum samples were stored at −20°C for determination of liver functions (ALT and AST) and kidney functions (urea and creatinine).
Serum ALT activity29
Serum ALT activity was measured spectrophotometrically using Spectrum Assay Kit (Spectrum). ALT catalyzes the transfer of an amino group from L-alanine to 2-oxoglutarate resulting in the formation of pyruvate and L-glutamate. The pyruvate concentration in the form of hydrazine formed with 2,4-dinitrophenylhydrazine in an alkaline medium is measured spectrophotometrically at 546 nm. Enzyme activity was calculated using pyruvate standard calibration curve.
Serum AST activity29
Spectrophotometric method was adopted to determine serum AST activity using Spectrum Assay Kit. Oxaloacetate and L-glutamate are formed when AST catalyzes the transfer of an amino group from L-aspartate to 2-oxoglutarate. The oxaloacetate concentration in the form of hydrazone which formed with 2,4-dinitrophenylhydrazine in an alkaline medium is measured spectrophotometrically at 546 nm.
Serum urea30
Serum urea level was determined by enzymatic colorimetric method using Diamond Diagnostics Assay Kit (Diamond Diagnostics). First, the urea in sample is enzymatically hydrolyzed into ammonia and carbon dioxide. In the presence of nitroprusside, the formed ammonia ion reacts with salicylate and hypochlorite to give a green indophenol. The color intensity of the green product is measured spectrophotometrically at 578 nm.
Serum creatinine31
Serum creatinine level was detected by buffered kinetic Jaffe reaction using Spectrum Assay Kit. Under alkaline conditions, creatinine reacts with picric acid to give a yellow–red complex. The color intensity of the product is measured spectrophotometrically at 492 nm.
Statistical analysis
Statistical analysis of the in vitro, pharmacokinetics and biodistribution results was carried out using Student’s t-test (P<0.05; GraphPad Prism Version 3.02; GraphPad Software, Inc., La Jolla, CA, USA), while the data of the toxicity study were analyzed using IBM SPSS software package Version 20 (IBM Corporation, Armonk, NY, USA). Comparison between the studied groups was carried out using F-test (ANOVA) and post hoc test (Scheffe), significance of the results was judged at the 5% level.
Results and discussion
Preparation of AE-loaded LCNP dispersions
MO-based LCNPs and PEGylated system were prepared by emulsification method. In this method, the dispersion of MO/P407 mixtures in water resulted in the formation of supramolecular systems consisted of LC lipidic particles and vesicles in a submicron PS range. Then, the hot dispersion was subjected to brief homogenization for 1 minute to obtain opaque uniform nano-dispersion free from aggregates. A second well-known thin film hydration method was also utilized for the formulation of LCNPs. However, upon using this method, lipid aggregates and AE crystals were observed indicating the failure of this method to efficiently incorporate AE in the lipid matrix. This was confirmed by polarizing microscope photographs (Figure 2A) showing the phase behavior of AE-LCNPs under the polarizing microscope as detailed in the following sections. Consequently, continuing with film hydration was discouraged and emulsification method was adopted for the preparation of AE-LCNPs. It is worth noting that the emulsification method has many advantages, including simplicity and saving of time, in contrast to other drastic and time-consuming conventional methods of preparation.32
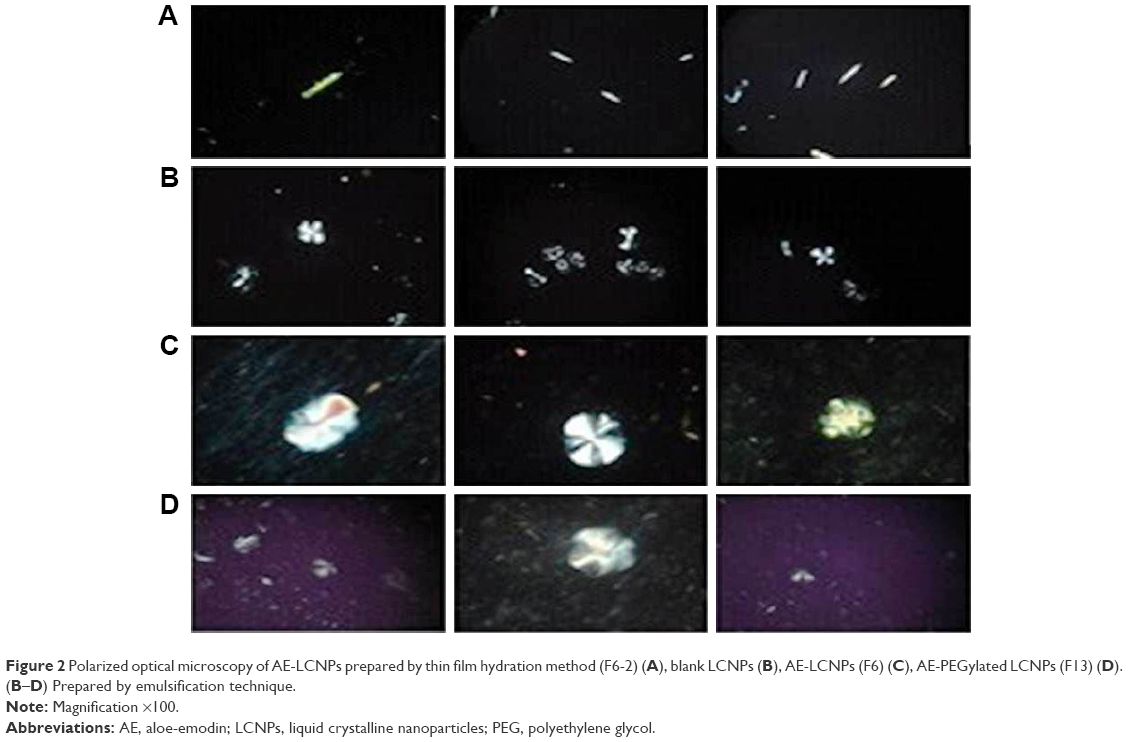 | Figure 2 Polarized optical microscopy of AE-LCNPs prepared by thin film hydration method (F6-2) (A), blank LCNPs (B), AE-LCNPs (F6) (C), AE-PEGylated LCNPs (F13) (D). (B–D) Prepared by emulsification technique. |
The composition of the prepared AE-LCNP formulations (F1–F14) is given in Table 1. The optimum formulations were selected on the basis of physicochemical characteristics including PS, PDI, ZP, and encapsulation efficiency (Table 2).
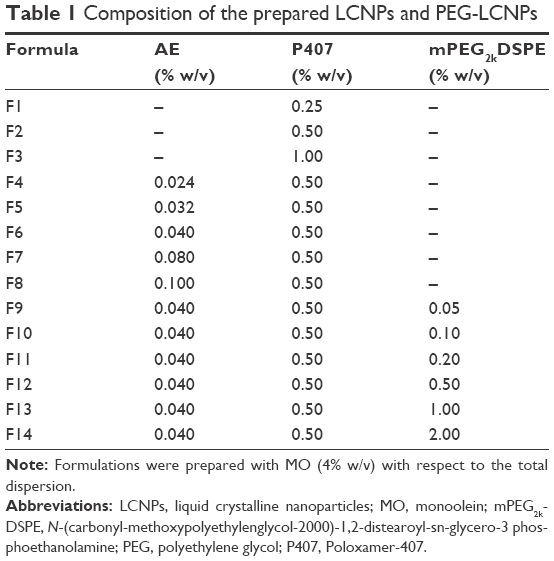 | Table 1 Composition of the prepared LCNPs and PEG-LCNPs |
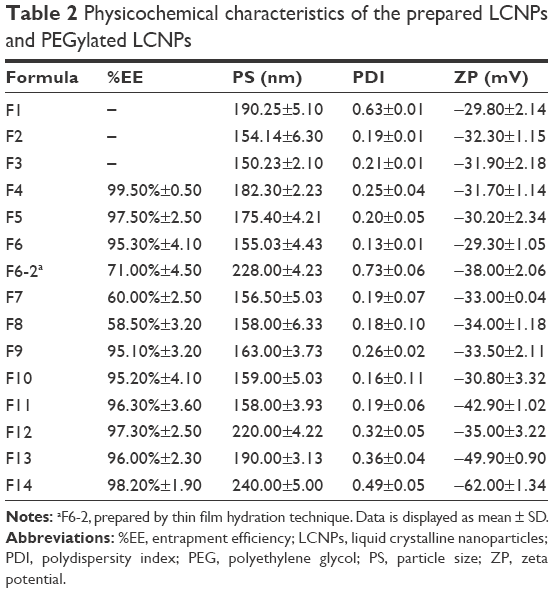 | Table 2 Physicochemical characteristics of the prepared LCNPs and PEGylated LCNPs |
Characteristics of AE-LCNP dispersions
Particle size
Effect of stabilizer concentration
Different stabilizer (P407) concentrations (0.25%, 0.5%, and 1% w/v) were screened to investigate the ability of polymer to stabilize the LCNP dispersions (Table 1; F1–F3). It was revealed that lower stabilizer concentration (F1; 0.25% w/v) was not well distributed within the LCNP dispersions as manifested by increased values of both PDI and PS. As stabilizer concentration increased from 0.25% w/v (F1) to 0.5% w/v (F2), both PS and PDI were significantly (P<0.05) decreased from 190±5 nm (PDI: 0.63) to 154±6 nm (PDI: 0.19), respectively. The dispersion of molten MO into small uniform LCNPs with increased stabilizer concentration could be explained by its ability to decrease the interfacial tension between the molten lipid and water. This could be attributed to adsorption of P407 on the surface of LCNPs resulting in reduction of their aggregation. Moreover, P407 was reported to efficiently stabilize the inner LC structure of the particles.33 Further increase in stabilizer concentration up to 1% w/v (F3) also maintained the good dispersibility of the LCNP formulations and uniform PDI (150±2 nm and PDI: 0.21±0.01), but the difference in PS was insignificant. Therefore, stabilizer concentration of 0.5% w/v (F2) was selected as the optimum one for further investigations.
Effect of drug loading
As shown in Table 1, different concentrations of AE were screened in the range of 0.024%–0.1% (w/v) with respect to dispersion (F4–F8). It was noted that increasing the concentration of AE from 0.024% w/v (F4) to 0.1% w/v (F8) significantly (P<0.05) decreased the %EE from 99.5±0.5 to 58.5±3.2 with insignificant increase in PS (Table 2). However, as AE concentration increased beyond 0.04% w/v (F6), excess drug crystals precipitated after ~2 hours. The formation of such crystals is expected due to the poor solubility of AE in water, so the excess free drug was unable to dissolve in water and settled as a precipitate. Therefore, the chosen optimum concentration of AE in dispersion was (F6) 0.04% w/v (10 mg in the formulation containing 1 g of MO), which was utilized during the optimization of mPEG2kDSPE concentration and all further evaluations.
Effect of mPEG2kDSPE concentration
PEGylation of prepared LCNPs was induced by incorporating mPEG2kDSPE with MO phase during preparation, in the range of 0.05%–2% w/v with respect to total dispersion (Table 1; F9–F14). An increase in both PS and PDI were observed with increasing concentration of mPEG2kDSPE. However, such effect on PS and PDI was significant (P<0.05) at concentrations of 0.5% w/v and 1% w/v of mPEG2kDSPE (Table 2; F12 and F13). The increase in PS could be attributed to the protruding PEG chains of mPEG2kDSPE around the LCNPs. Increasing the concentration of mPEG2kDSPE beyond 1% w/v led to a large increase in both PS 240±5 nm and PDI 0.48 (F14) indicating broad PS distribution. In addition, the intensity-weighted PS distribution determined during PS measurement using Zetasizer revealed the appearance of small particles in the range of 32±5 nm. The appearance of such small particles may be explained by the presence of mixed micelles and/or vesicles in the aqueous phase. Thus, 1% w/v of mPEG2kDSPE (F13) was selected as optimum concentration.
Zeta potential
ZP is an essential parameter that could influence the colloidal stability of nano-sized drug delivery systems. It is reported that high ZP values above ±25 mV are required for electrical repulsion between particles and reduce their aggregation. All blank LCNPs, AE-LCNPs, and PEGylated LCNPs demonstrated negative ZP (Table 2). Although MO is a neutral lipid, a negative ZP was observed during the optimization of LCNPs. This could be ascribed to the adsorption of hydroxyl ions on the surface of the LCNPs and also the commercial MO containing free oleic acid that may contribute to the negatively charged ZP. The negatively charged MO-based LCNPs were reported elsewhere.34 Incorporation of mPEG2kDSPE in the LC matrix resulted in further increase in ZP (−49 mV). This could be ascribed to the negatively charged phosphate group of mPEG2kDSPE. Such higher ZP could be beneficial in maintaining the stability of LCNP dispersions and preventing their aggregation.
It is worth to mention that solidification of the optimized formulations via freeze-drying did not affect their quality attributes including PS, PDI, ZP, and %EE (Table S1).
Polarizing microscopy and phase behavior
Upon studying the phase behavior of LC matrix under polarized microscope, a number of characteristic fan-like structures were observed in isotropic dark background (Figure 2B). Incorporation of either AE or mPEG2kDSPE in PEGylation step did not affect the observed fan-like structure of the LC phase (Figure 2C and D). In addition, Figure 2A shows the free AE crystals confirming the failure of thin film hydration method to efficiently incorporate the AE in the LC structures (F6-2).
Transmission electron microscopy
Morphological examination of the prepared LCNP dispersions was examined using TEM. As shown in Figure 3, all the prepared blank LCNPs (Figure 3A and B), AE-LCNPs (Figure 3C), and AE-PEGylated LCNPs (Figure 3D and E) were in the range of 150–200 nm, thus confirming the results of the measurement of PS by DLS. Several nonuniform spherical nanostructures with internal water channels (magnified in Figure 3B) were clearly distinguished. Both large LCNPs (400–500 nm) and small vesicles, often present in LCNP dispersions, were clearly noticed during TEM micrographs by repeated observation. These findings were not obvious during the measurement of PS using DLS. This could be explained as DLS reflects the intensity-weighted size distribution, whereas these vesicles and large LCNPs constitute only small population so they do not affect the whole size distribution. Micrographs of AE-PEGylated LCNPs (Figure 3E; F13) showed spherical flower-like structures with internal water channel and denser outer layer which also confirm efficient PEGylation.19
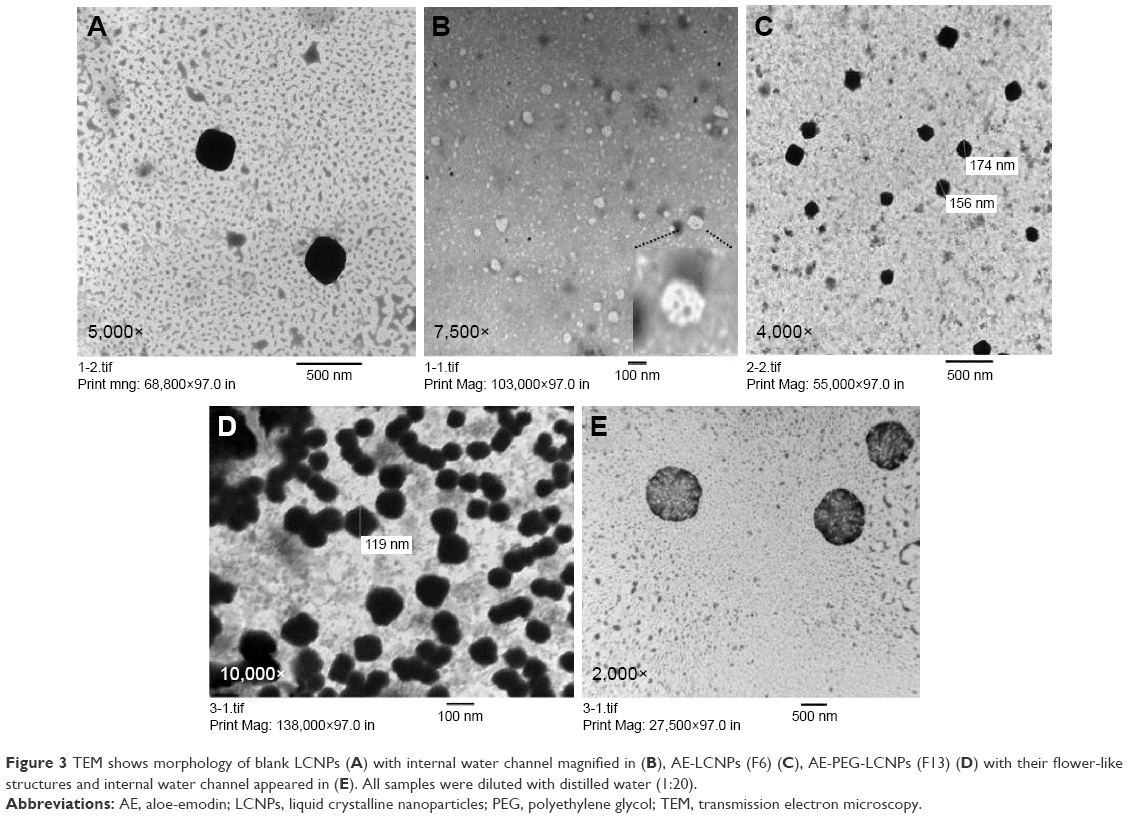 | Figure 3 TEM shows morphology of blank LCNPs (A) with internal water channel magnified in (B), AE-LCNPs (F6) (C), AE-PEG-LCNPs (F13) (D) with their flower-like structures and internal water channel appeared in (E). All samples were diluted with distilled water (1:20). |
Differential scanning calorimetry
DSC is a common and reliable method used to investigate any change that could be occurred in drug crystallinity during nanoparticle formulation (Figure 4A). The thermogram of AE showed one sharp endothermal peak at 223°C (Figure 4A[d]). DSC of AE-LCNPs (Figure 4A[b]) and AE-PEGylated LCNPs (Figure 4A[c]) showed that the characteristic endothermal peak of the drug disappeared indicating that the encapsulated AE in LCNPs was converted to its amorphous state or molecularly dispersed in MO. All three thermograms of blank LCNPs (Figure 4A[a]), AE-LCNPs (Figure 4A[b]), and AE-PEGylated LCNPs (Figure 4A[c]) exhibited the reported characteristic peak of mannitol used to facilitate lyophilization step of LCNPs at 163°C.35
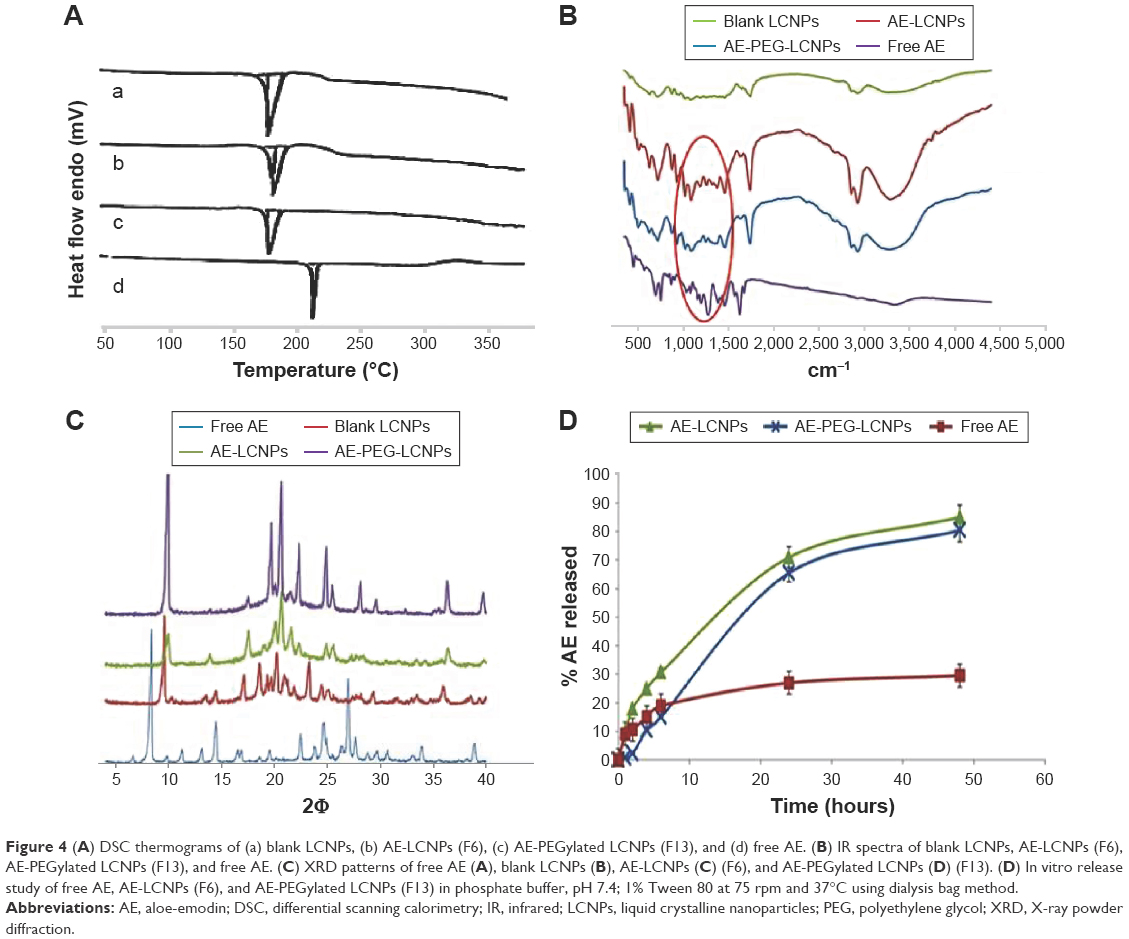 | Figure 4 (A) DSC thermograms of (a) blank LCNPs, (b) AE-LCNPs (F6), (c) AE-PEGylated LCNPs (F13), and (d) free AE. (B) IR spectra of blank LCNPs, AE-LCNPs (F6), AE-PEGylated LCNPs (F13), and free AE. (C) XRD patterns of free AE (A), blank LCNPs (B), AE-LCNPs (C) (F6), and AE-PEGylated LCNPs (D) (F13). (D) In vitro release study of free AE, AE-LCNPs (F6), and AE-PEGylated LCNPs (F13) in phosphate buffer, pH 7.4; 1% Tween 80 at 75 rpm and 37°C using dialysis bag method. |
FTIR study
The possible chemical interaction between AE and MO was investigated by simple FTIR study (Figure 4B). Spectrum of AE clearly showed its characteristic peaks including (=CO) stretching vibration at 1,680 cm−1, (–OH) stretching vibration around 3,445 cm−1, C=C vibration at 1,627 cm−1, and benzene skeleton vibration at 1,476 cm−1. It is also clearly shown in the figure that the characteristic AE peaks at 1,680 cm−1 and 1,627 cm−1 are detectable in all three spectrums of free AE and AE-loaded LCNPs, but it appeared at lower intensity in both AE-LCNPs and AE-PEGylated LCNPs. These results demonstrated that chemical interaction between AE encapsulated in LCNPs and MO was not proved.
X-ray diffraction
The X-ray diffractograms of free AE, lyophilized samples of blank LCNPs, AE-LCNPs, and AE-PEGylated LCNPs are depicted in Figure 4C. Diffractogram of AE showed intense peaks at 2Φ of 8.34°, 24.56°, and 26.96° confirming its crystalline nature as reflected in DSC. No intense AE peaks have been observed in AE-LCNPs and AE-PEGylated LCNP diffractograms. Both DSC and XRD results confirmed that AE present as solid solution in MO resulting in enhanced AE solubility.
In vitro release study
The in vitro release study was performed using a standard dialysis bag method according to the method of Driever et al36. Driever et al proved the suitability of this method to investigate the release rate from LCNPs provided that the dialysis membrane used with MWCO was markedly larger than the size of the released molecule. The dialysis membrane used in this study with MWCO of 12–14 kDa was around 50-fold larger than the molecular weight of AE.
In vitro drug release profiles of free AE, AE-LCNPs (F6), and AE-PEGylated LCNPs (F13) in phosphate buffer (pH 7.4) containing 1% Tween 80 are illustrated in Figure 4D. Drug release pattern from AE-LCNP formulations showed a biphasic release profile characterized by initial burst release during the first 4–6 hours followed by continuous sustained release up to 48 hours. As illustrated in Figure 4D, AE-PEGylated LCNPs and AE-LCNPs showed the controlled release of AE (80.5%±2.2% and 85.4%±3.6%, respectively, up to 48 hours). The initial burst release could be attributed to AE probably adsorbed on LCNPs surface and/or the high surface area-to-volume ratio of the nano-LCNPs.37 On the other hand, the delayed release of AE from both AE-LCNPs and AE-PEGylated LCNPs may be attributed to the diffusion of entrapped drug through the tortuous regular channels of the lipidic matrix.14 AE-PEGylated LCNPs demonstrated slower release profile at initial time points with only 2% drug released after a lag time of 2 hours when compared with AE-LCNPs. The observed lag time was due to the presence of hydrophilic PEG layer that acted as barrier against the diffusion of lipophilic AE into release medium.
Hemocompatibility studies
MO-induced hemolytic property was assessed when incorporated into LCNPs and PEGylated LCNPs via calculating the percentage of RBC lysis. As shown in Figure 5A, blank LCNPs induced relatively low hemolysis tendency (10.72%±3.14%) after 0.5 hours with no significant difference from AE-LCNPs (7.32%±2.14%). However, after incubation for 2 hours, both blank LCNPs and AE-LCNPs showed extensive hemolysis 50%±4.34% and 42%±5.13%, respectively. Hemolytic activity of AE-LCNPs and AE-PEGylated LCNPs with different mPEG2kDSPE concentrations is presented in Figure 5B. It is clearly shown that the addition of low concentration of mPEG2kDSPE could significantly decrease the %hemolysis. mPEG2kDSPE (F12; 0.5% w/v) showed 10.5%±2.14% hemolysis after 2 hours, while no tendency for hemolysis was detected for AE-PEGylated LCNPs at both 1% w/v and 2% w/v mPEG2kDSPE (F13 and F14). These results are in good agreement with that obtained by Jain et al,14 who found that the addition of 1.88% w/w mPEG2kDSPE greatly decreased the hemolytic activity of their prepared paclitaxel–LCNPs. It was reported that PEG layer adsorbed on the surface of MO–LCNPs prevents their interactions with RBCs and subsequent hemolysis.14 Formulated AE-PEGylated LCNPs (F13) were then proposed for systemic administration as it showed only 2%–3% hemolysis, which is less than the accepted nontoxic ratio (5%).
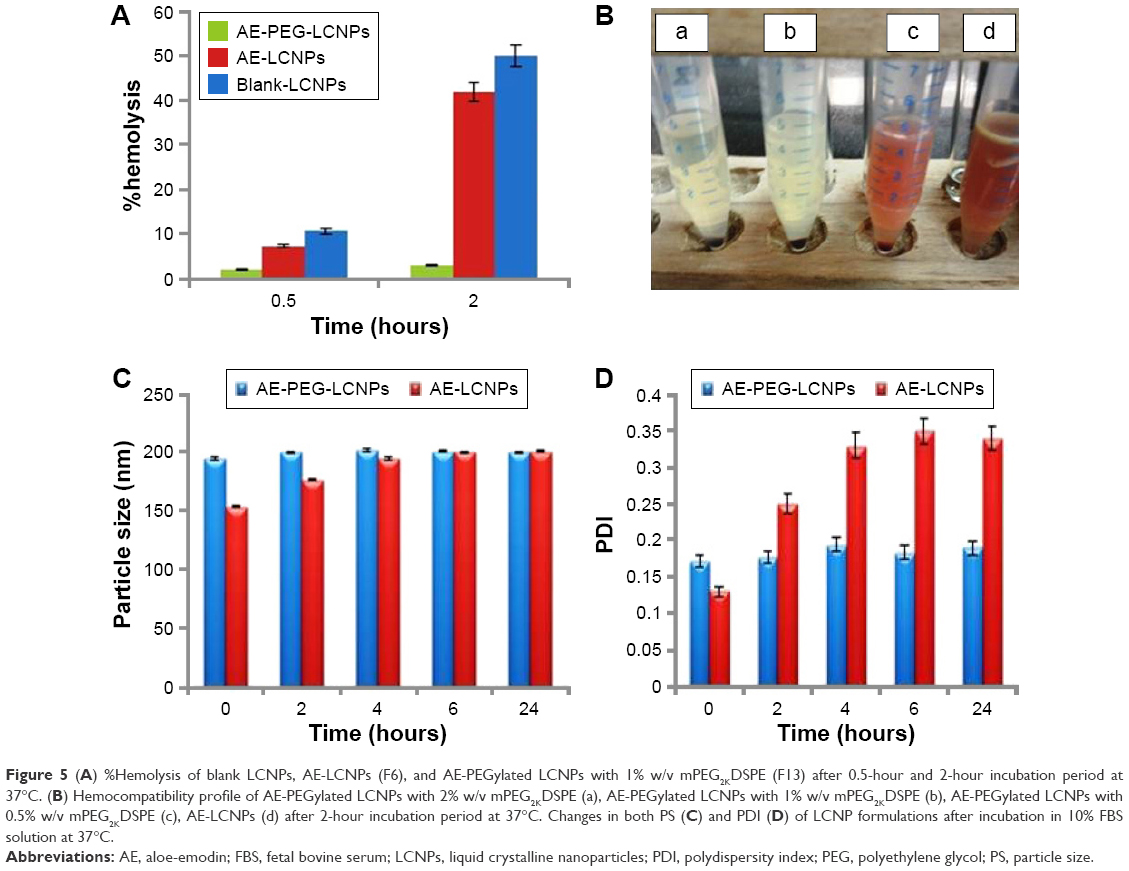 | Figure 5 (A) %Hemolysis of blank LCNPs, AE-LCNPs (F6), and AE-PEGylated LCNPs with 1% w/v mPEG2KDSPE (F13) after 0.5-hour and 2-hour incubation period at 37°C. (B) Hemocompatibility profile of AE-PEGylated LCNPs with 2% w/v mPEG2KDSPE (a), AE-PEGylated LCNPs with 1% w/v mPEG2KDSPE (b), AE-PEGylated LCNPs with 0.5% w/v mPEG2KDSPE (c), AE-LCNPs (d) after 2-hour incubation period at 37°C. Changes in both PS (C) and PDI (D) of LCNP formulations after incubation in 10% FBS solution at 37°C. |
Serum stability of AE-LCNPs
It is a well-known fact that stability of nanoparticles in serum is essential for their use for parenteral drug delivery especially IV one. When mixed with serum, unstable nanoparticles rapidly adsorb the serum proteins and form aggregates. This could result in large PS and broad size distribution. Changes in both PS (Figure 5C) and PDI (Figure 5D) of AE-LCNPs (F6) and AE-PEGylated LCNPs (F13) with time after incubation with 10% FBS were monitored by DLS. An increase in both PS (from154±3.11 to 200±2.41 nm) and PDI (from 0.13±0.01 to 0.35±0.01) of AE-LCNPs was observed after 6-hour incubation in 10% FBS solution. This increase in both PS and PDI suggested the adsorption of small amount of serum proteins on the surface of LCNPs. Further increase in incubation time did not lead to further increase in PS and PDI; this may be due to complete saturation of entire surface of LCNP with serum proteins. Meanwhile, no significant change in both PS and PDI of AE-PEGylated LCNPs was observed with time suggesting that the LCNPs were stable in serum for 24 hours. This observation indicates the role of PEGylation in prolonging nanoparticle circulation time and preventing their CL by the RES.
Sterilization of AE-PEGylated LCNPs
Sterility and apyrogenicity are essential requirements in any parenteral drug delivery systems for both in vitro and in vivo applications. Although various sterilization techniques are available, many concerns have been raised with respect to the negative effects of these techniques on the physicochemical characteristics of the delivery systems and also on the entrapped drug. In a consequence, careful selection of suitable sterilization technique for the parenteral drug delivery system is a must to ensure complete safety and efficacy of the sterilized delivery system. The aim of this study was to investigate the effects of commonly used sterilization techniques on the physicochemical characteristics of the prepared AE-PEG-LCNPs and also on the physical and chemical state of entrapped AE. The techniques investigated in this study were sterile filtration, autoclaving, and γ-irradiation. To ensure effective sterilization, the sterilization techniques were performed according to the European Pharmacopeia recommendations for sterilization of pharmaceutical product.
Sterile filtration is a commonly used method for the removal of microorganisms especially from thermosensitive dispersions by passing them through 0.22 μm sterile filter. Although the prepared AE-PEG-LCNPs have average PS (~200 nm) below the pore size of the filter used (0.22 μm), clogging of filter membrane was observed. This could be attributed to adsorption of larger particles on the filter membrane that leads to its clogging and further hindering the easy passage of nanoparticles through the filter, which leads to significant loss in LCNP dispersion volume during the filtration process. As a result, filtration sterilization was not selected as the suitable technique for AE-PEG-LCNPs, although it showed no significant effects on the physicochemical characteristics of PEGylated LCNPs and the amount of AE entrapped (Table 3).
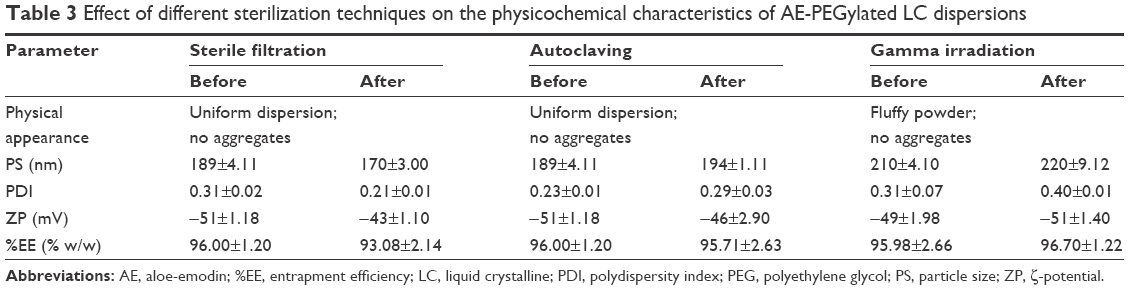 | Table 3 Effect of different sterilization techniques on the physicochemical characteristics of AE-PEGylated LC dispersions |
Autoclaving was another sterilization technique investigated in this study. Its principle is to kill microorganisms with high pressurized steam, at a minimum temperature of 121°C, within 15–20 minutes. Interestingly, no significant changes in PS, PDI, and ZP of the sterilized AE-PEG-LCNPs were observed. The amount of AE entrapped also remained unaffected. Although many studies reported about the aggregation of nanoparticles sterilized via autoclaving,38,39 many other studies considered it the most suitable sterilization method for their prepared nanoparticles.40,41 It seems that the negative effects of autoclaving on the nanoparticles are dependent on many factors. The latter could include the type of nanoparticles, their coating, as well as materials and methods used for their production.
In another avenue, sterilization by γ-radiations has many advantages, including suitability for thermolabile materials leaving no residue after sterilization. This method was employed on lyophilized powder since hydroxyl radicals (resulting from exposure of water to radiation) are a major source of the free radicals which cause damage.42 It was also observed that this sterilization technique had no adverse effects on both physicochemical properties and the amount of entrapped drug as revealed in Table 3. This was contended by other studies that reported the suitability of this method for sterilization of nanoparticles without affecting its physicochemical properties or its safety.43 Consequently, in this study, autoclaving and γ-radiations could be selected as suitable methods for sterilization of liquid and lyophilized AE-PEG-LCNPs, respectively.
In vitro cytotoxicity study
The cytotoxicity of free AE, AE-LCNPs (F6), AE-PEGylated LCNPs (F13), and blank LCNPs at AE concentration range of 5–90 μM was assessed on human breast cancer cells, MCF-7, using MTT assay. This assay is a quantitative dye-based assay that depends on the metabolic activity of viable cells. In MTT assay, only metabolically active viable cells are able to convert the yellow MTT dye to purple MTT formazan crystals, which are further dissolved in solvent and analyzed spectrophotometrically.44 Figure 6A and B shows the cytotoxicity results of blank LCNPs, free AE, AE-LCNPs (F6), and AE-PEGylated LCNPs (F13) after incubation with MCF-7 cells for 24 hours (Figure 6A) and 48 hours (Figure 6B). As shown in Figure 6, both free AE and AE-LCNP dispersions demonstrated considerable reduction in cell viability in a dose- and time-dependent manner. However, at the same concentration, AE-LCNPs showed significantly (P<0.05) higher proliferation inhibitory effects when compared with free AE solution. This could be manifested as lower half maximal inhibitory concentration (IC50) values (50% growth inhibition) compared with free AE solution. The IC50 values of AE-LCNPs were found to be 26 μM and 18 μM following 24-hour and 48-hour incubation, respectively, which was 3.18- and 4.34-fold lower compared with free AE (Table 4). Blank LCNPs did not show remarkable cytotoxicity and maintained cell viability ~90% after both 24 hours and 48 hours, suggesting its cytocompatibility and confirming that the cytotoxicity of AE-LCNPs was due to AE.
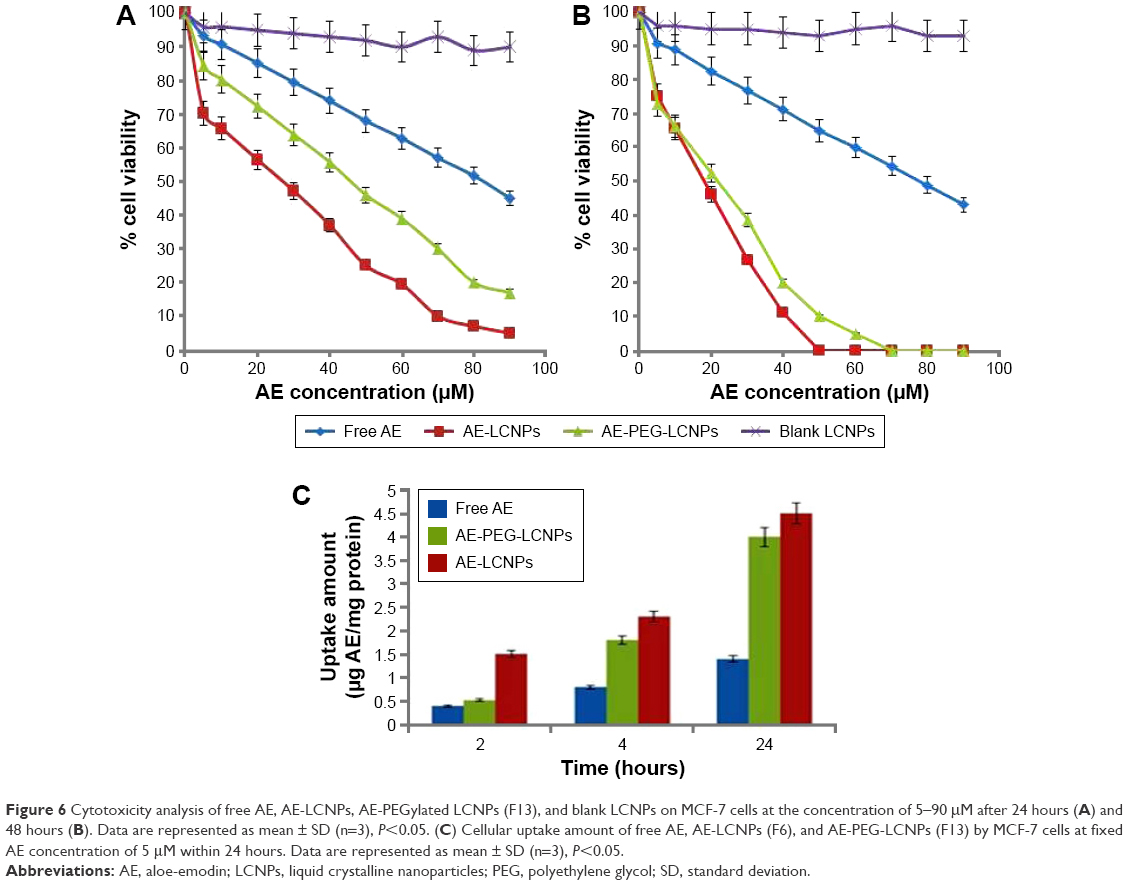 | Figure 6 Cytotoxicity analysis of free AE, AE-LCNPs, AE-PEGylated LCNPs (F13), and blank LCNPs on MCF-7 cells at the concentration of 5–90 μM after 24 hours (A) and 48 hours (B). Data are represented as mean ± SD (n=3), P<0.05. (C) Cellular uptake amount of free AE, AE-LCNPs (F6), and AE-PEG-LCNPs (F13) by MCF-7 cells at fixed AE concentration of 5 μM within 24 hours. Data are represented as mean ± SD (n=3), P<0.05. |
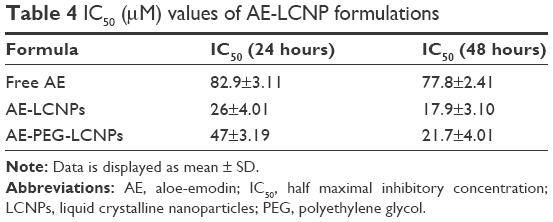 | Table 4 IC50 (μM) values of AE-LCNP formulations |
The superior cytotoxic activity of AE-LCNPs can be explained as AE-LCNPs possess significantly higher solubility compared with free AE which results in higher concentration around the cells and subsequent higher cytotoxicity.1,14 In addition, the cellular uptake of AE-LCNPs could be enhanced by nonspecific internalization into cells via endocytosis or phagocytosis which further lead to enhanced cytotoxicity.14 Also, the interactions between MO and cell membranes influence the physicochemical properties of lipid bilayers and further facilitate the internalization of LCNPs. It has been reported earlier that MO has lipid-mixing and membrane-fusion properties that further facilitate the internalization of LCNPs.45 Interestingly, the observed cytotoxic potential of AE-LCNPs (IC50: 26 μM) was higher than AE-PEGylated LCNPs (IC50: 47 μM) after 24-hour incubation period. The lower cytotoxicity demonstrated by AE-PEGylated LCNPs over 24 hours may be explained by the slow release of AE from PEGylated LCNPs and the presence of PEG coat that may hinder MO interactions with MCF-7 cells. Further increase in the incubation time of AE-PEGylated LCNPs to 48 hours resulted in cytotoxicity profile (IC50: 21.7 μM) comparable with that of AE-LCNPs (IC50: 17.9 μM) due to the gradual release of entrapped AE from PEGylated LCNPs.
Cellular uptake of AE-LCNPs
The cellular uptake study of AE-LCNPs was performed with the aim of confirming their remarkable cytotoxic potential on MCF-7 cells.1 The intracellular concentration of AE-LCNPs increased with incubation time with an obvious significant difference (P<0.05) from the solution of free AE, as shown in Figure 6C. After 24-hour incubation with MCF-7 cells, AE-LCNPs (4.5 μg AE/milligram protein) demonstrated 3.21-fold higher cellular uptake compared with free AE (1.4 μg AE/milligram protein). The higher cellular uptake of AE-LCNPs was attributed to the bioadhesive and membrane-fusing properties of MO,14 which results in its enhanced interaction with the cancer cell. In addition, in the case of free AE solution, the drug entered the cell via simple diffusion, which may result in the saturation of intracellular compartment with drug molecules, thus preventing further drug entry.1,14 On the contrary, the LCNP dispersion was uptaken by endocytosis; this enabled gradual release of the drug inside the cells avoiding intracellular saturation. In agreement with the observations of MTT assay, AE-PEGylated LCNPs remained less interactive and showed lower cellular uptake during the initial time points compared with AE-LCNPs. But this difference decreased with time due to the gradual release of AE from PEGylated LCNPs.
Pharmacokinetic and biodistribution studies
Pharmacokinetic and tissue biodistribution studies were carried out to investigate the effect of naked LCNPs and PEGylated one on the in vivo behavior of AE in rats. AE formulations were administered intraperitoneally at a dose of 7.5 mg/kg. Non-compartmental model was selected for pharmacokinetic analysis due to its simplicity. All pharmacokinetic parameters are calculated and listed in Table 5. As shown in Figure 7A, after IP administration of free AE, plasma concentration increased rapidly to reach maximum concentration (Cmax) of 1.24±0.54 μg/mL, then declined rapidly within 30 minutes with mean residence time of 40 minutes. It was clearly observed that both LCNP dispersion and its PEGylated form significantly enhanced the bioavailability of AE in plasma evidenced by 2.1- and 5.4-fold higher AUC0→∞ compared with free AE. Notably, AE was still detectable in plasma until 8 hours in contrast to free AE and non-PEGylated AE-LCNPs that were quickly removed from the blood circulation after administration and cannot be detected after 1 hour. Clearly, the AE-PEG-LCNPs showed marked delay in blood CL with (t1/2) 6.7-fold increase compared with non-PEGylated LCNPs. The mean CL value of free AE was 2.2- and 5.5-fold greater than AE-LCNPs and AE-PEG-LCNPs, respectively. The increased AUC and half-life of AE-PEG-LCNPs confirmed the stealth properties imparted by PEG chains that prevent RES capture of the nanoparticles and delay their CL.
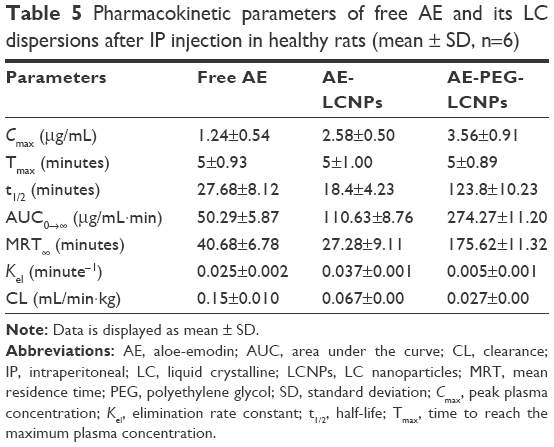 | Table 5 Pharmacokinetic parameters of free AE and its LC dispersions after IP injection in healthy rats (mean ± SD, n=6) |
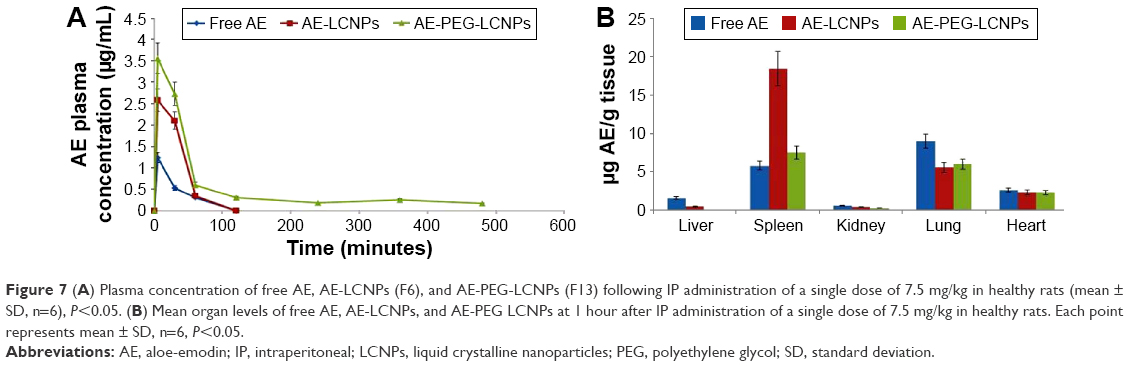 | Figure 7 (A) Plasma concentration of free AE, AE-LCNPs (F6), and AE-PEG-LCNPs (F13) following IP administration of a single dose of 7.5 mg/kg in healthy rats (mean ± SD, n=6), P<0.05. (B) Mean organ levels of free AE, AE-LCNPs, and AE-PEG LCNPs at 1 hour after IP administration of a single dose of 7.5 mg/kg in healthy rats. Each point represents mean ± SD, n=6, P<0.05. |
According to the tissue distribution study depicted in Figure 7B, free drug showed significant accumulation in spleen when compared with other organs. The results were in agreement with Feng et al,46 who reported the existence of AE in tissues with a rich blood supply such as spleen. The LCNPs of AE mainly accumulated in RES-rich organs such as spleen and liver; this could be attributed to the hydrophobic surface of LCNPs that facilitate their opsonization and CL by RES-rich organs. Accumulation of lipid-based drug delivery systems in spleen due to their lymphatic targeting properties was also reported elsewhere.47 Interestingly, PEGylation significantly reduced the accumulation of AE in spleen and liver, which again confirmed the prolonged blood circulation of AE-PEG-LCNPs.
In vivo toxicity study
As a result of their small size and large surface area, nanoscale materials demonstrate novel properties and functions that significantly differ from those observed in their counterpart bulk materials. Unluckily, the same characteristics that make nanoparticles so unique could be behind their potential toxic effects.48
In the field of nanomedicine, a wide gap exists between in vitro and in vivo scenarios. In vitro studies could not determine the ability of the administered nanoparticles to reach target tissues. Moreover, nanoparticles could cause biochemical changes in vivo which may have gone unobserved in isolated cell-based studies.
Shortly after the administration of nanoparticles, abnormal hematological, cardiac, or neuronal responses could occur. In the current study, no abnormal organ response to the administered doses was observed. Weight measurement is an easy and reliable parameter that reflects overall animal health and indicates probable toxicity. Results revealed a progressive increase in body weights of the control and nanoparticle-treated rats (Table 6). Weight gain may indicate the improved nutritional state of the corresponding animals, while insignificant minimal weight gain was recorded with the free drug-receiving group. Such improved nutritional state could be attributed to increased food and water intake, reflecting good health and denying incidence of toxicity (Table 6). Moreover, clinical evaluation of body systems demonstrated no potential toxicity of the given formulations. After sacrificing the animals, gross examination of the organs further denied the potential toxicity of the administered formulations. In addition, the toxicity potential of systemic nanoparticles was assessed. In this regard, biochemical assays of parameters related to liver and kidney functions were assessed. In addition, whole blood was used for analyzing the complete blood count that could indicate bone marrow function and nonspecific immunological interactions. Results revealed insignificant biochemical and hematological changes in the treatment groups that further confirm the safety of the formulations (Tables 7 and 8).
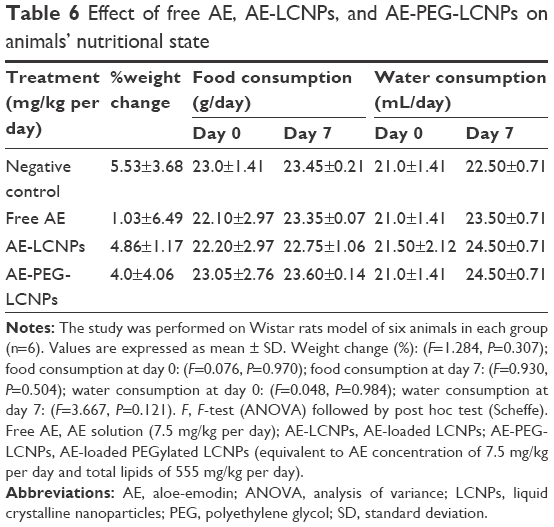 | Table 6 Effect of free AE, AE-LCNPs, and AE-PEG-LCNPs on animals’ nutritional state |
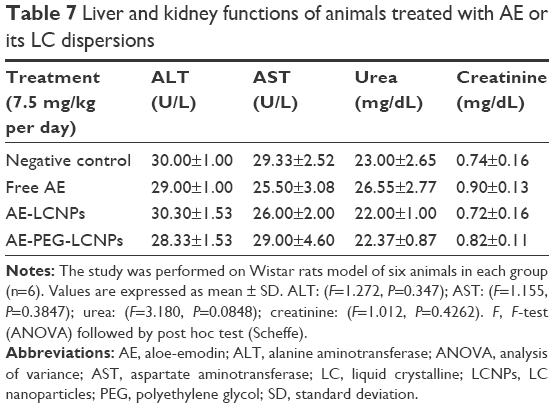 | Table 7 Liver and kidney functions of animals treated with AE or its LC dispersions |
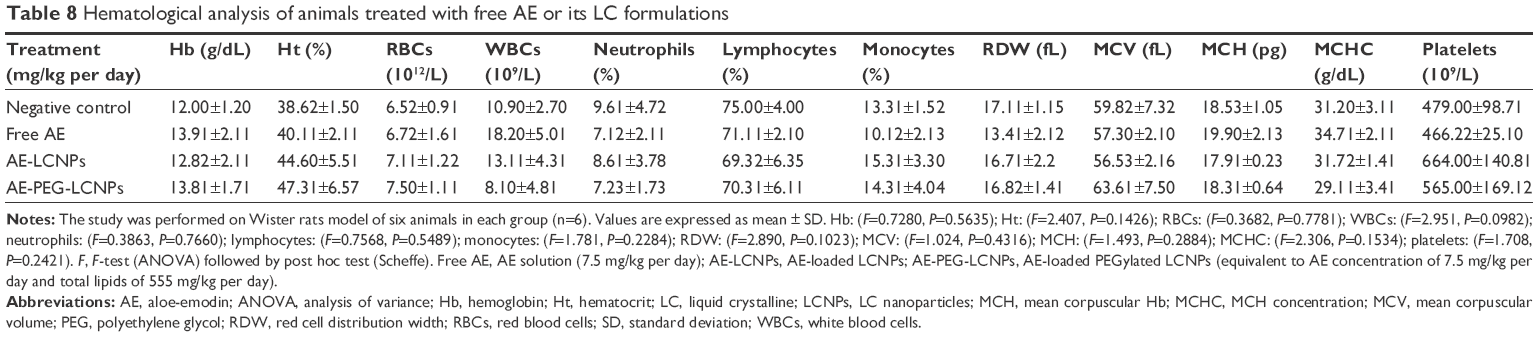 | Table 8 Hematological analysis of animals treated with free AE or its LC formulations |
Conclusion
The current study adopted the development of new PEGylated LCNPs of AE. The AE-PEGylated LCNPs could be tailored with ~96% drug encapsulation efficiency and nanometric range. The solubility enhancement property of MO-based system was assessed. Furthermore, the prepared formulation showed good serum stability and hemocompatibility with higher cytotoxic effects and cellular uptake in MCF-7 cells compared with free drug. In vivo assessment of PEGylated AE-LCNPs demonstrated a significant increase in the bioavailability of AE compared with free AE. In addition, the stealth property of AE-PEG-LCNPs was confirmed by enhanced plasma circulation and reduced biodistribution in RES organs compared with naked AE-LCNPs. One of the most interesting findings of the study is that the proposed nanoparticles showed excellent biocompatibility with negligible biochemical and hematological changes in rats. Finally, it may be concluded that PEGylation enhances the safety of MO-based delivery systems, thus enables their use as injectable delivery system for poorly soluble AE. However, further in vivo studies are necessary to evaluate the antitumor activity of the formulations in animal cancer models.
Disclosure
The authors report no conflicts of interest in this work.
References
Chen R, Wang S, Zhang J, Chen M, Wang Y. Aloe-emodin loaded solid lipid nanoparticles: formulation design and in vitro anti-cancer study. Drug Deliv. 2015;22(5):666–674. | ||
Nayak V, Gincy TB, Prakash M, et al. Hepatoprotective activity of Aloe vera gel against paracetamol induced hepatotoxicity in albino rats. Asian J Phar Biol Res. 2011;1(2):94–98. | ||
Liu YX, Shen NY, Liu C, Lv Y. Immunosuppressive effects of emodin: an in vivo and in vitro study. Transplant Proc. 2009;41(5):1837–1839. | ||
Barnard DL, Huffman JH, Morris JLB, Wood SG, Hughes BG, Sidwell RW. Evaluation of the antiviral activity of anthraquinones, anthrones and anthraquinone derivatives against human cytomegalovirus. Antiviral Res. 1992;17(1):63–77. | ||
Yen G-C, Duh P-D, Chuang D-Y. Antioxidant activity of anthraquinones and anthrone. Food Chem. 2000;70(4):437–441. | ||
Chen R, Zhang J, Hu Y, Wang S, Chen M, Wang Y. Potential antineoplastic effects of aloe-emodin: a comprehensive review. Am J Chin Med. 2014;42(02):275–288. | ||
Duan H-G, Wei Y-H, Li B-X, Qin H-Y, Wu X-A. Improving the dissolution and oral bioavailability of the poorly water-soluble drug aloe-emodin by solid dispersion with polyethylene glycol 6000. Drug Dev Res. 2009;70(5):363–369. | ||
Tian K, Zhang H, Chen X, Hu Z. Determination of five anthraquinones in medicinal plants by capillary zone electrophoresis with β-cyclodextrin addition. J Chromatogr A. 2006;1123(1):134–137. | ||
Chou T-H, Liang C-H. The molecular effects of aloe-emodin (AE)/liposome-AE on human nonmelanoma skin cancer cells and skin permeation. Chem Res Toxicol. 2009;22(12):2017–2028. | ||
Kathe N, Henriksen B, Chauhan H. Physicochemical characterization techniques for solid lipid nanoparticles: principles and limitations. Drug Dev Ind Pharm. 2014;40(12):1565–1575. | ||
El-Refaie WM, Elnaggar YS, El-Massik MA, Abdallah OY. Novel curcumin-loaded gel-core hyaluosomes with promising burn-wound healing potential: development, in-vitro appraisal and in-vivo studies. Int J Pharm. 2015;486(1):88–98. | ||
El-Refaie WM, Elnaggar YS, El-Massik MA, Abdallah OY. Novel self-assembled, gel-core hyaluosomes for non-invasive management of osteoarthritis: in-vitro optimization, ex-vivo and in-vivo permeation. Pharm Res. 2015;32(9):2901–2911. | ||
Elnaggar YS, Etman SM, Abdelmonsif DA, Abdallah OY. Novel piperine-loaded Tween-integrated monoolein cubosomes as brain-targeted oral nanomedicine in Alzheimer’s disease: pharmaceutical, biological, and toxicological studies. Int J Nanomedicine. 2015;10:5459. | ||
Jain V, Swarnakar NK, Mishra PR, et al. Paclitaxel loaded PEGylated gleceryl monooleate based nanoparticulate carriers in chemotherapy. Biomaterials. 2012;33(29):7206–7220. | ||
Yang D, Armitage B, Marder SR. Cubic liquid-crystalline nanoparticles. Angew Chem Int Ed. 2004;43(34):4402–4409. | ||
Spillmann CM, Naciri J, Algar WR, Medintz IL, Delehanty JB. Multifunctional liquid crystal nanoparticles for intracellular fluorescent imaging and drug delivery. ACS Nano. 2014;8(7):6986–6997. | ||
Chen Y, Ma P, Gui S. Cubic and hexagonal liquid crystals as drug delivery systems. Biomed Res Int. 2014;2014:12. | ||
Bode J, Kuntsche J, Funari S, Bunjes H. Interaction of dispersed cubic phases with blood components. Int J Pharm. 2013;448(1):87–95. | ||
Zeng N, Hu Q, Liu Z, et al. Preparation and characterization of paclitaxel-loaded DSPE-PEG-liquid crystalline nanoparticles (LCNPs) for improved bioavailability. Int J Pharm. 2012;424(1):58–66. | ||
Angelov B, Angelova A, Papahadjopoulos-Sternberg B, Hoffmann SV, Nicolas V, Lesieur S. Protein-containing PEGylated cubosomic particles: freeze-fracture electron microscopy and synchrotron radiation circular dichroism study. J Phys Chem B. 2012;116(26):7676–7686. | ||
Angelova A, Angelov B, Drechsler M, Garamus VM, Lesieur S. Protein entrapment in PEGylated lipid nanoparticles. Int J Pharm. 2013;454(2):625–632. | ||
Otsuka H, Nagasaki Y, Kataoka K. PEGylated nanoparticles for biological and pharmaceutical applications. Adv Drug Deliv Rev. 2003;55(3):403–419. | ||
Li S-D, Huang L. Stealth nanoparticles: high density but sheddable PEG is a key for tumor targeting. J Control Release. 2010;145(3):178. | ||
Esposito E, Eblovi N, Rasi S, et al. Lipid-based supramolecular systems for topical application: a preformulatory study. AAPS PharmSci. 2003;5(4):62–76. | ||
Esposito E, Cortesi R, Drechsler M, et al. Cubosome dispersions as delivery systems for percutaneous administration of indomethacin. Pharm Res. 2005;22(12):2163–2173. | ||
Yang Z, Chen M, Yang M, Chen J, Fang W, Xu P. Evaluating the potential of cubosomal nanoparticles for oral delivery of amphotericin B in treating fungal infection. Int J Nanomedicine. 2014;9:327. | ||
Wolfram J, Suri K, Huang Y, et al. Evaluation of anticancer activity of celastrol liposomes in prostate cancer cells. J Microencapsul. 2014;31(5):501–507. | ||
European Pharmacopoeia 6th Edition, 2007. EDQM (European Directorate for the Quality of Medicines & Health Care), Council of Europe, Strasbourg Cedex, France. | ||
Reitman S, Frankel S. A colorimetric method for the determination of serum glutamic oxalacetic and glutamic pyruvic transaminases. Am J Clin Pathol. 1957;28(1):56. | ||
Tabacco A, Meiattini F, Moda E, Tarli P. Simplified enzymic/colorimetric serum urea nitrogen determination. Clin Chem. 1979;25(2):336–337. | ||
Bowers LD, Wong ET. Kinetic serum creatinine assays. II. A critical evaluation and review. Clin Chem. 1980;26(5):555–561. | ||
Jin X, Zhang Z-H, Li S-L, et al. A nanostructured liquid crystalline formulation of 20 (S)-protopanaxadiol with improved oral absorption. Fitoterapia. 2013;84:64–71. | ||
Sherif S, Bendas ER, Badawy S. The clinical efficacy of cosmeceutical application of liquid crystalline nanostructured dispersions of alpha lipoic acid as anti-wrinkle. Eur J Pharm Biopharm. 2014;86(2):251–259. | ||
Deshpande S, Venugopal E, Ramagiri S, Bellare JR, Kumaraswamy G, Singh N. Enhancing cubosome functionality by coating with a single layer of poly-ε-lysine. ACS Appl Mater Interfaces. 2014;6(19):17126–17133. | ||
Elgindy N, Elkhodairy K, Molokhia A, Elzoghby A. Lyophilized flutamide dispersions with polyols and amino acids: preparation and in vitro evaluation. Drug Dev Ind Pharm. 2011;37(4):446–455. | ||
Driever CD, Mulet X, Waddington LJ, et al. Layer-by-layer polymer coating on discrete particles of cubic lyotropic liquid crystalline dispersions (cubosomes). Langmuir. 2013;29(42):12891–12900. | ||
Boyd BJ. Characterisation of drug release from cubosomes using the pressure ultrafiltration method. Int J Pharm. 2003;260(2):239–247. | ||
Özcan I, Bouchemal K, Segura-Sánchez F, Abacı Ö, Özer Ö, Güneri T. Effects of sterilization techniques on the PEGylated poly (γ-benzyl-L-glutamate) (PBLG) nanoparticles. Acta Pharm Sci. 2009;51:211–218. | ||
Masson V, Maurin F, Fessi H, Devissaguet J. Influence of sterilization processes on poly (ε-caprolactone) nanospheres. Biomaterials. 1997;18(4):327–335. | ||
Cavalli R, Caputo O, Carlotti ME, Trotta M, Scarnecchia C, Gasco MR. Sterilization and freeze-drying of drug-free and drug-loaded solid lipid nanoparticles. Int J Pharm. 1997;148(1):47–54. | ||
França Á, Pelaz B, Moros M, et al. Sterilization matters: consequences of different sterilization techniques on gold nanoparticles. Small. 2010;6(1):89–95. | ||
Puthli S, Vavia P. Gamma irradiated micro system for long-term parenteral contraception: an alternative to synthetic polymers. Eur J Pharm Sci. 2008;35(4):307–317. | ||
Gainza G, Pastor M, Aguirre JJ, et al. A novel strategy for the treatment of chronic wounds based on the topical administration of rhEGF-loaded lipid nanoparticles: in vitro bioactivity and in vivo effectiveness in healing-impaired db/db mice. J Control Release. 2014;185:51–61. | ||
Vijayakumar S, Ganesan S. In vitro cytotoxicity assay on gold nanoparticles with different stabilizing agents. J Nanomater. 2012;2012:9. | ||
Barauskas J, Cervin C, Jankunec M, et al. Interactions of lipid-based liquid crystalline nanoparticles with model and cell membranes. Int J Pharm. 2010;391(1):284–291. | ||
Feng S-X, Xu H-P, Li J-S, Qu L-B, Ran Y, LI J-J. Determination of aloe-emodin in rat plasma by SPE-HPLC and the pharmacokinetic study. Chin J New Drugs. 2012;8:022. | ||
Paliwal R, Rai S, Vaidya B, et al. Effect of lipid core material on characteristics of solid lipid nanoparticles designed for oral lymphatic delivery. Nanomedicine. 2009;5(2):184–191. | ||
Arora S, Rajwade JM, Paknikar KM. Nanotoxicology and in vitro studies: the need of the hour. Toxicol Appl Pharmacol. 2012;258(2):151–165. |
Supplementary material
Lyophilization of liquid crystalline nanoparticle formulations
The optimized dispersions of aloe-emodin (AE)-liquid crystalline nanoparticles (LCNPs) and AE-PEGylated LCNPs were lyophilized in a Cryodos-50 lyophilizer (Telstar Cryodos, Terrassa, Spain) with a condenser temperature of −70°C. Briefly, 25 mL of AE-LCNP dispersions contained 5% w/v mannitol as a cryoprotectant was filled in 50 mL glass vials and subjected to freeze-drying. Lyophilization was performed at a pressure of 40 mbar and a temperature of −40°C for 1 day. The lyophilized AE-LCNPs (yield 90.4% w/w) were stored in a desiccator over P2O5 at 25°C until testing. Lyophilized formulations were evaluated for particle size, ζ-potential, polydispersity index, re-dispersibility, and encapsulation efficiency after reconstitution.
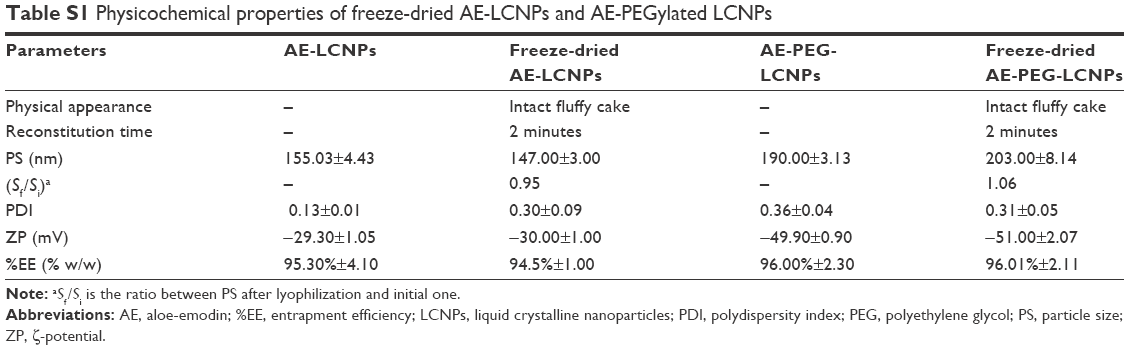 | Table S1 Physicochemical properties of freeze-dried AE-LCNPs and AE-PEGylated LCNPs |
 © 2016 The Author(s). This work is published and licensed by Dove Medical Press Limited. The
full terms of this license are available at https://www.dovepress.com/terms
and incorporate the Creative Commons Attribution
- Non Commercial (unported, 3.0) License.
By accessing the work you hereby accept the Terms. Non-commercial uses of the work are permitted
without any further permission from Dove Medical Press Limited, provided the work is properly
attributed. For permission for commercial use of this work, please see paragraphs 4.2 and 5 of our Terms.
© 2016 The Author(s). This work is published and licensed by Dove Medical Press Limited. The
full terms of this license are available at https://www.dovepress.com/terms
and incorporate the Creative Commons Attribution
- Non Commercial (unported, 3.0) License.
By accessing the work you hereby accept the Terms. Non-commercial uses of the work are permitted
without any further permission from Dove Medical Press Limited, provided the work is properly
attributed. For permission for commercial use of this work, please see paragraphs 4.2 and 5 of our Terms.