Back to Journals » Clinical Ophthalmology » Volume 15
Steady-State Pattern Electroretinography in Eyes with Glaucoma and High Myopia
Authors Lim XH, Nongpiur ME, Najjar RP ![]() , Hoang QV, Milea D, Wong CW, Husain R, Htoon HM, Aung T, Perera S, Wong TTL
, Hoang QV, Milea D, Wong CW, Husain R, Htoon HM, Aung T, Perera S, Wong TTL
Received 31 August 2021
Accepted for publication 2 November 2021
Published 17 November 2021 Volume 2021:15 Pages 4455—4465
DOI https://doi.org/10.2147/OPTH.S336903
Checked for plagiarism Yes
Review by Single anonymous peer review
Peer reviewer comments 2
Editor who approved publication: Dr Scott Fraser
Xian Hui Lim,1 Monisha Esther Nongpiur,1– 3 Raymond P Najjar,2,3 Quan V Hoang,1– 4 Dan Milea,1– 3 Chee Wai Wong,1– 3 Rahat Husain,1,3 Hla Myint Htoon,2,3 Tin Aung,1– 3,5 Shamira Perera,1– 3 Tina Tzee Ling Wong1– 3,5
1Singapore National Eye Centre, Singapore; 2Singapore Eye Research Institute, Singapore; 3Duke-NUS Medical School, Singapore; 4Department of Ophthalmology, Edward S. Harkness Eye Institute, Columbia College of Physicians and Surgeons, New York, NY, USA; 5Department of Ophthalmology, Yong Loo Lin School of Medicine, National University of Singapore, Singapore
Correspondence: Tina Tzee Ling Wong
Singapore National Eye Centre, 11 Third Hospital Avenue, 168751, Singapore
Email [email protected]
Purpose: To investigate features of the steady-state pattern electroretinogram (ssPERG) in subjects with glaucoma (G), high myopia (HM; spherical equivalent ≤-6D) and glaucoma with high myopia (GHM).
Patients and Methods: Our study included 48 participants divided into 3 groups (G, HM, and GHM) who each underwent monocular ssPERG testing with Diopsys NOVA PERG protocols. The ConStim protocol detects distinct topographic patterns of dysfunction 16° and 24° around the central macula. MagD is the amplitude of the average signal and MagD/Mag ratio indicates the consistency of the response. ssPERG indices were compared between groups and correlated with functional (ie, visual field mean deviation (VFMD)) and structural (ie, average retinal nerve fibre layer (RNFL) thickness; Cirrus optical coherence tomography) features.
Results: Participants had an average age of 59.4± 7.6 years. Mean Humphrey VFMD was − 14.22 ± 2.88dB, − 2.62 ± 1.18dB and − 12.80 ± 2.60dB for G, HM and GHM groups, respectively. Mean RNFL thickness was 63.0 ± 8.20μm, 69.5 ± 15.7μm and 60.6 ± 5.0μm for G, HM and GHM groups, respectively. For the 24° setting, no significant differences were noted for any of the parameters. For the 16° setting, MagD was lower in the GHM group compared to the HM group (0.29μV vs 0.52μV; p = 0.02). Significant differences were noted for the MagD/Mag ratio between HM and G groups (0.58 vs 0.40; p = 0.02) and between HM and GHM groups (0.58 vs 0.35; p = 0.002). There were positive correlations between both MagD 16° and MagD/Mag ratio 16° with VFMD (correlation coefficient [r]=0.37, p = 0.009; and r = 0.44, p = 0.002, respectively) and RNFL (r = 0.43, p = 0.002; and r = 0.48, p = 0.001, respectively).
Conclusion: MagD/Mag ratio at 16° was significantly lower in glaucomatous eyes (with or without high myopia) compared to those with high myopia without glaucoma, suggesting that glaucoma has a distinct impact on MagD/Mag ratio at 16° irrespective of the presence of myopia.
Keywords: pattern electroretinogram, visual field mean deviation, optical coherence tomography, retinal nerve fibre layer
Introduction
Glaucoma, the leading cause of irreversible blindness worldwide, is a progressive optic neuropathy characterized by retinal ganglion cell (RGC) loss.1 Early detection of glaucoma is essential as patients are often asymptomatic until advanced disease has occurred.2 Glaucoma is usually diagnosed with structural assessments of the optic disc, imaging of the retinal nerve fibre layer (RNFL) for thinning, and functional tests of the visual field, which show corresponding losses.2
High myopia, defined as a spherical equivalent of −5.00 dioptres (D) or worse, was estimated to affect 4.0% of the world’s population in 2010.3 Myopic ocular changes can cause an abnormal appearance of the optic nerve head, making diagnosis of glaucoma challenging, especially when the intraocular pressure (IOP) is normal. Furthermore, interpretation of optical coherence tomography (OCT) results may be difficult in patients with high myopia, due to artefacts and other structural alterations4 associated with the axial elongation of the globe and optic disc tilting arising from this condition.5 This may cause serious problems in the future as the global prevalence of myopia is projected to reach 50% by 2050, with 10% of the global population having high myopia.3 Furthermore, multiple studies have demonstrated a positive correlation between glaucoma and high myopia.6–8
Given the challenges in detecting glaucoma in highly myopic patients with traditional methods, alternative diagnostic tools should be explored. Recent studies have explored the role of optical coherence tomography angiography (OCTA) in assessing peripapillary and foveal avascular zone microvasculature to this effect9,10 but as OCTA is still a novel imaging tool, there has been very limited work in this area thus far. Furthermore, segmentation errors are inevitable in some eyes with myopia but this can affect the analysis of OCTA results and preclude use of some of the images obtained.10 Electroretinography is another diagnostic option as it allows for the functional evaluation of the integrity of different retinal layers. The pattern electroretinogram (PERG) is particularly relevant in glaucoma studies as it is a marker of RGC function. PERG typically assesses the central visual field and utilises an alternating, patterned visual stimulus with spatial and temporal variations that culminate in a constant, mean luminance.11 At reversal frequencies of 5Hz (10 reversals/second) or more, individual PERG waveforms merge and the retinal response to this steady-state PERG (ssPERG) is measured.12 The higher temporal frequency employed by ssPERG has been shown in studies to be more sensitive at differentiating between glaucomatous patients and normal patients.13,14
ssPERG has been recognized in many studies as a potential tool for diagnosing and monitoring glaucoma.15–25 In myopes, studies utilising transient PERG have consistently found decreased N95 and P50 amplitudes with increasing myopia and axial length, but differ in their results regarding N95 and P50 wave latencies.26–28 There is, however, a paucity of information of PERG features in patients with both glaucoma and high myopia, with only 1 other study investigating this in the literature.29 In our observational study, we aimed to investigate the characteristics of ssPERG in subjects with glaucoma and high myopia. The identification of specific ssPERG features may aid in distinguishing between both conditions.
Materials and Methods
The study was approved by the SingHealth Centralised Institutional Review Board, and written informed consent was obtained from all participants. It was conducted in accordance with the ethical principles stated by the Declaration of Helsinki.
Subjects
Subjects were recruited from the outpatient clinics of the Singapore National Eye Centre and divided into 3 groups: primary open-angle glaucoma (POAG) without high myopia (Group G), high myopia without glaucoma as defined by the absence of glaucomatous field defects (Group HM), and POAG with high myopia (Group GHM).
POAG was defined by the following criteria:30,31 the presence of glaucomatous optic neuropathy (as shown by loss of neuroretinal rim with a vertical cup:disc ratio of >0.7 or an inter-eye asymmetry of >0.2, and/or optic disc notching attributable to glaucoma) with compatible visual field loss, open angles on gonioscopy, and absence of secondary causes of glaucomatous optic neuropathy. Glaucoma participants had moderate to severe glaucoma based on Humphrey visual field (HVF) static automated perimetry mean deviation (MD) values of <-6.0 decibels (dB).32 High myopia was defined as a spherical equivalent of ≤-6D.
Exclusion criteria included primary angle closure glaucoma, secondary causes of glaucoma, best corrected visual acuity (BCVA) of >0.3 logMAR, previous intraocular surgery apart from uncomplicated cataract extraction with posterior chamber intraocular lens implantation, and other previous or current retinal or optic nerve conditions that could cause optic disc or visual field abnormalities.
Clinical features of ocular health including IOP, optic nerve appearance, gonioscopy, BCVA (LogMAR chart, Lighthouse Int., NY, USA) and results from Humphrey Field Analyser II model 750 (HVF) with 24-2 Swedish interactive threshold algorithm fast strategy (Carl Zeiss Meditec, Inc. Dublin, CA, USA) were obtained from each participant’s medical records up to 6 months before study participation commenced. Each participant also underwent: i) auto-refraction to determine spherical equivalent, ii) ssPERG with Diopsys NOVA PERG (Diopsys, Inc. Pine Brook, NJ, USA) system, iii) optic nerve head and RNFL analysis with spectral-domain OCT of the RNFL within a 6 x 6mm data cube defined by the optic disc cube 200 × 200 protocol on Cirrus HD-OCT (software version 6.0) (Carl Zeiss Meditec, Inc. Dublin, CA, USA). OCT results were validated only if the recording’s signal strength was 6 or better.
Pattern Electroretinogram
Participants were seated 24 inches away from a gamma-corrected Acer V176BM-17 17-inch LED monitor with a refresh rate of 75 frames/second. The area under the lash line of each eye was cleaned with 6 lateral sweeps of OCuSoft® Original Lid Scrub Pad and Diopsys® ERG Lid Electrodes placed over the cleaned area and centralised to the pupil. The center of the participants’ forehead just below the hairline was cleaned with NuPrep® gel and Ten20® Conductive Paste applied before attachment of the EEG electrode. One eye was occluded at a time while participants were instructed to fixate with the other eye on a red cross at the centre of the PERG stimulus field. Refractive errors were corrected appropriately to allow for clear fixation at this distance. Patients underwent testing with both the Concentric Stimulus Fields (ConStim) and Contrast Sensitivity (ConSen) protocols. The pattern stimulus for the ConStim protocol evaluated either the central 16° or 24° field of vision and comprised 64 bar size black and white horizontal gratings with 100% contrast (mean luminance 102.1cd/m2) and a reversal rate of 15 reversals/second for 25 seconds per test per eye. The pattern stimulus for the ConSen protocol evaluated the central 24° of the macula and comprised 64 bar size black and white horizontal gratings with 85% contrast (mean luminance 112.3cd/m2) for the high contrast (Hc) and 75% contrast (mean luminance 128.2cd/m2) for the low contrast (Lc) tests, at a reversal rate of 15 reversals/second for 25 seconds per test per eye.
Signals were filtered for frequencies of 0.5–100Hz, amplified with a gain of 20,000, and averaged by at least 150 frames. The voltage range of the analog to digital converter was −5V to +5V. Electrical signals originating from blinks or saccades and exceeding 50μV were rejected. Responses were recorded via synchronized single-channels, which produced a time series of 384 data points per 200ms analysis frame. A discrete Fourier transformation was applied to the PERG waveforms to isolate the component at 15 Hz.
Outcome measures generated for each test included 4 parameters:
- Magnitude (Mag), the average of the signal amplitude representing the RGC responses to the PERG stimuli.
- MagnitudeD (MagD), the amplitude of the average signal across the frame taking into account both the magnitude and the phase variability. RGC dysfunction results in lower MagD values.
- MagnitudeD to Magnitude ratio (MagD/Mag ratio) is an indicator of the consistency of the response. Decrease of this ratio suggests impaired RGC function.
- Signal-to-noise ratio (SNR) compares the strength of the 15Hz signal and the average ambient electrical noise. A low value is usually due to contamination of the signal by surrounding electrical activity but can also be due to retinal disorders in severe cases.
Statistical Analysis
One eye of each participant was included in the analysis. In cases in which both eyes were eligible, the worse eye in terms of visual field mean deviation (for glaucoma subjects) or degree of myopia (high myopia subjects) was selected. Statistical analysis was performed using the statistical package IBM SPSS Statistics for Windows (Version 22.0; IBM Corp., Armonk, NY, USA). Comparisons of ocular characteristics and PERG parameters between the three subgroups were performed using 1-way ANOVA for parametric data and independent samples Kruskal–Wallis test for non-parametric data. Intergroup differences in mean values of variables were analyzed using post-hoc Bonferroni tests. Correlation of continuous data variables was analyzed using the Pearson correlation test (2-sided).
As there were no published studies on the Diopsys PERG in both glaucoma and high myopia when this study was designed, our sample size calculation was based on previously published data on the transient PERG N95 amplitude in myopia26 and glaucoma.33 A sample size of 10 eyes in each group was necessary to achieve 84% power to detect a mean difference of 3.1µV in N95 amplitude between the null hypothesis that the mean of both groups is 8.7µV, and the alternative hypothesis that the mean of the high myopia (−6.25 to −10.00D) group is 5.6µV, with known group standard deviations of 3.2µV (glaucoma)33 and 1.0µV (high myopia)26 and a significance level (α) of 0.05 using a two-sided, two-sample t-test.
Results
A total of 48 participants were included in the study, with 16 participants in each of the three groups. The mean age (standard deviation, SD) of the subjects was 59.4 (7.6) years, there were 29 (60.4%) males and 44 (91.7%) were of Chinese ethnicity. The demographic and ocular characteristics of the three groups are shown in Table 1. There were no significant differences in the mean age and the proportions of gender and ethnicity between the groups. The participants in group G and GHM had significantly worse visual field defects compared to group HM (p < 0.001 for both). Similarly, the average OCT RNFL of group G (63.0µm) and group GHM (60.6µm) were significantly thinner compared to group HM (69.5µm) (p = 0.001 and p < 0.001 respectively).
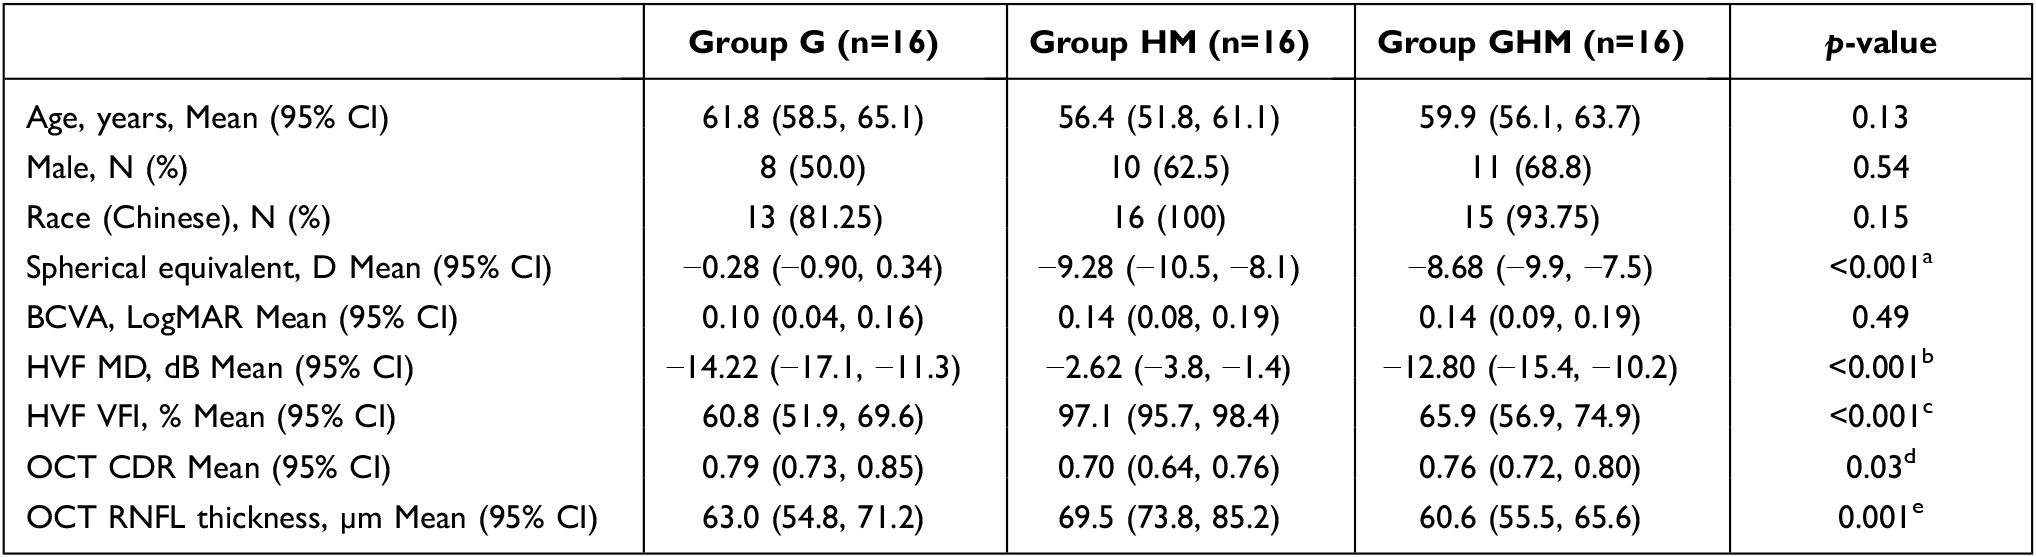 |
Table 1 Demographics and Clinical Characteristics of Study Participants |
For the ConStim 24° setting, no significant differences were noted for any of the parameters. For the ConStim 16° setting, MagD was significantly lower in group GHM compared to group HM (0.29 µV vs 0.52 µV; p = 0.02). Significant differences were also noted for the MagD/Mag ratio between groups HM and G (0.58 vs 0.40; p = 0.02) and between groups HM and GHM (0.58 vs 0.35; p = 0.002). The detailed results of the ConStim protocol are shown in Table 2. No significant differences were observed for any of the parameters between the three groups in both the ConSen Hc and Lc settings. The detailed results of the ConSen protocol are shown in Table 3. Figures 1–3 demonstrate examples of the ConStim and ConSen PERG traces obtained for a participant from each of groups G, HM and GHM.
 |
Table 2 Comparison of the Concentric Stimulus Fields Protocols Between the Three Groups |
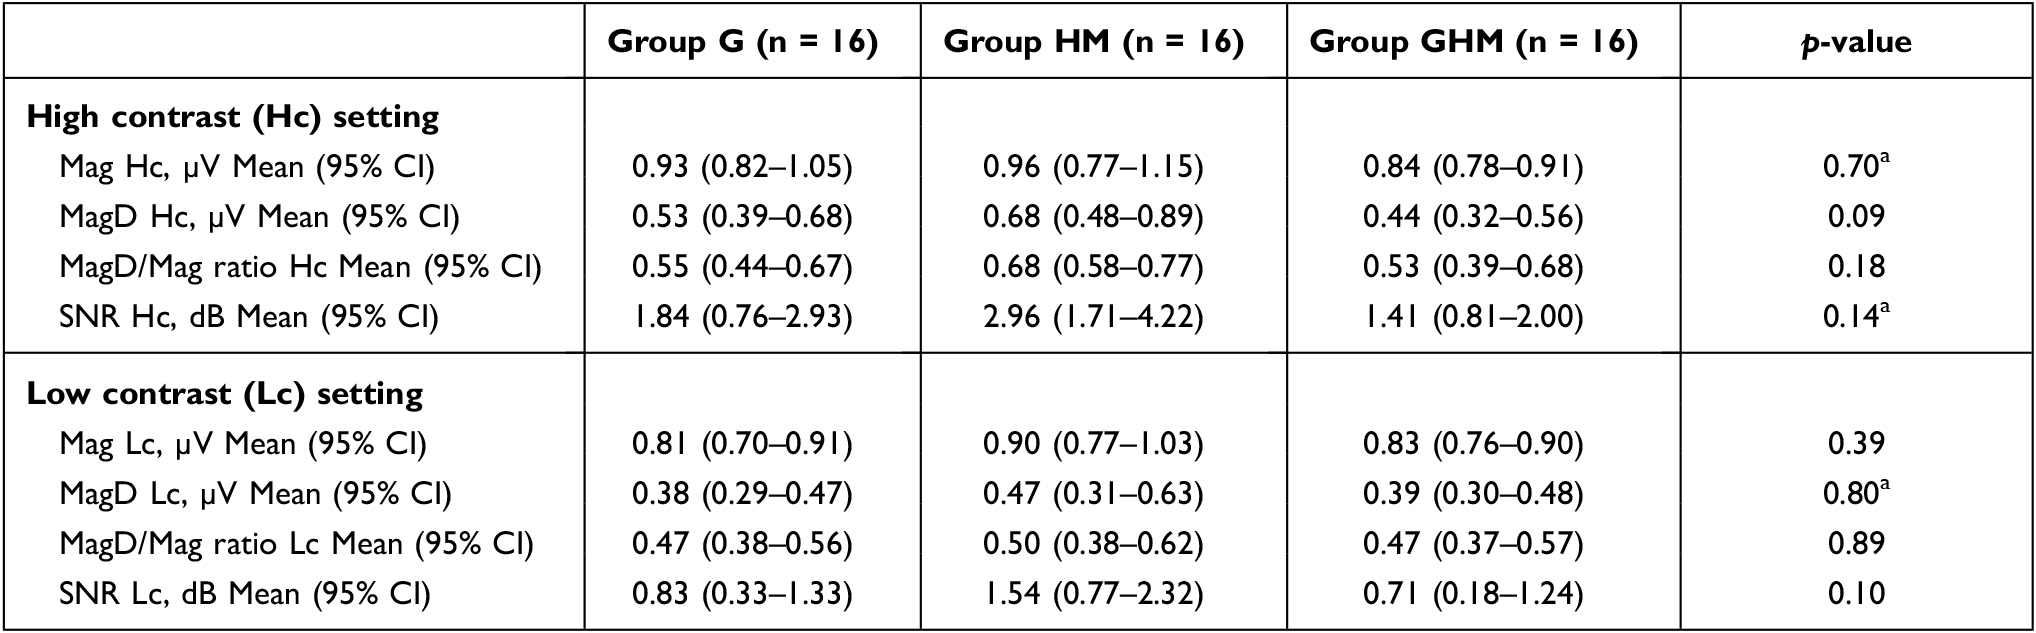 |
Table 3 Comparison of the Contrast Sensitivity Protocols Between the Three Groups |
 |
Figure 1 Diopsys PERG trace of a patient from group GHM. The right eye of this participant was included in the study and had spherical equivalent of −9.75D, visual field mean deviation −11.34dB and average retinal nerve fibre layer thickness of 61µm. Left: Concentric stimulus (ConStim) protocol with 24° (top) and 16° (bottom) settings. Signal quality was good (120dBµV). (A) demonstrates the waveform obtained. The vertical axis indicates the amplitude (µV) and the horizontal axis, the time between 0 and 200 milliseconds. (B) is the strip chart, reflecting the PERG recording with artifacts represented by pronounced vertical peaks. In this case, there were 0 artifacts recorded. (C) is the frequency distribution chart, indicating the PERG response at various frequencies. The Magnitude value is obtained at 15Hz. Right: Contrast Sensitivity (ConSen) protocol with high contrast (Hc) (top) and low contrast (Lc) (bottom) settings. Signal quality was similarly good (125dBµV). |
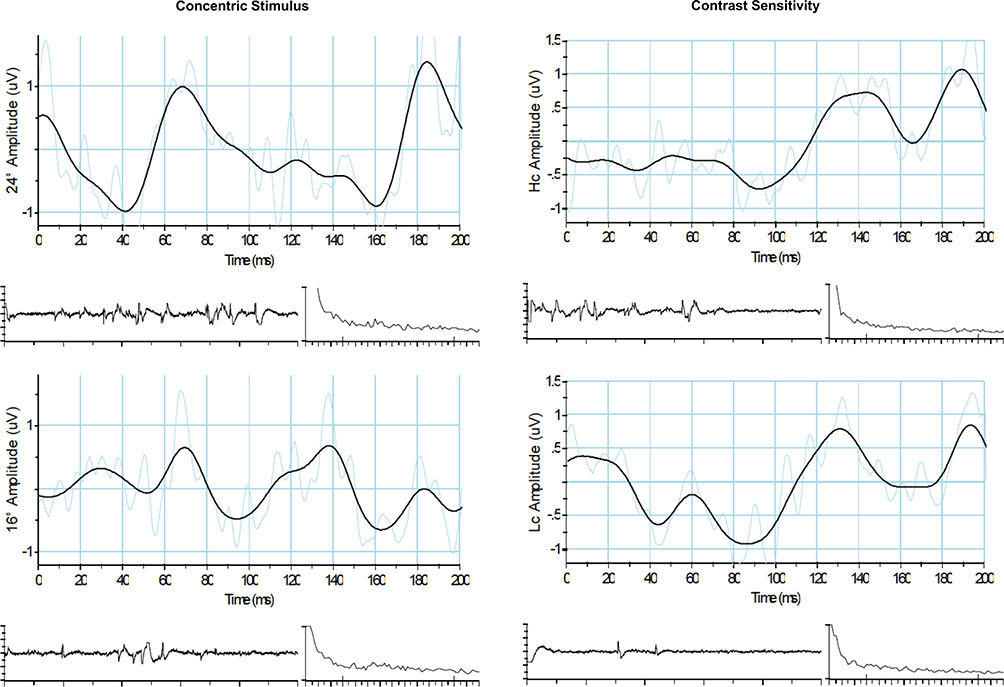 |
Figure 2 Diopsys PERG trace of a patient from group G. The right eye of this participant was included in the study and had spherical equivalent of +0.50D, visual field mean deviation −12.51dB and average retinal nerve fibre layer thickness of 60µm. Left: Concentric stimulus (ConStim) protocol with 24° (top) and 16° (bottom) settings. Signal quality was good (87dBµV). Right: Contrast Sensitivity (ConSen) protocol with high contrast (Hc) (top) and low contrast (Lc) (bottom) settings. Signal quality was similarly good (82dBµV). |
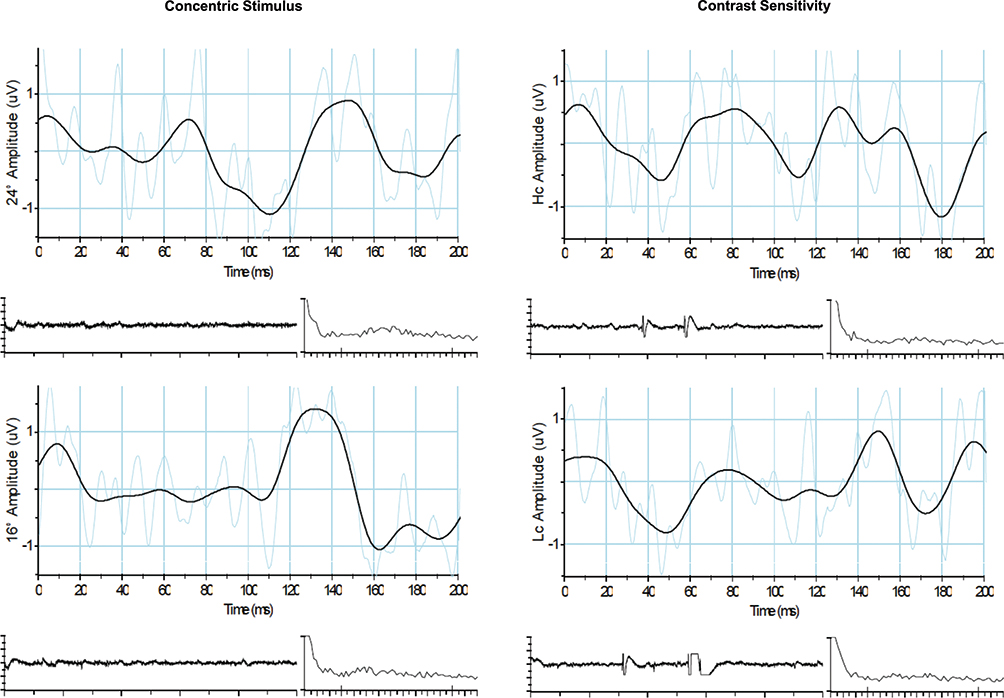 |
Figure 3 Diopsys PERG trace of a patient from group HM. The right eye of this participant was included in the study and had spherical equivalent of −10.87D, visual field mean deviation −17.69dB and average retinal nerve fibre layer thickness of 56µm. Left: Concentric stimulus (ConStim) protocol with 24° (top) and 16° (bottom) settings. Signal quality was good (96dBµV). Right: Contrast Sensitivity (ConSen) protocol with high contrast (Hc) (top) and low contrast (Lc) (bottom) settings. Signal quality was similarly good (86dBµV). |
Table 4 demonstrates the Pearson correlations of MagD and MagD/Mag ratio at 16° with the spherical equivalent, optic disc and visual field parameters. There was a significant positive correlation between both MagD 16° and MagD/Mag ratio 16° with visual field MD (correlation coefficient [r] = 0.37, p = 0.009; and r = 0.44, p = 0.002 respectively) and OCT RNFL mean thickness (r = 0.43, p = 0.002; and r = 0.48, p = 0.001 respectively). Figure 4 contains the correlation plots. MagD 16° and MagD/Mag ratio 16° were not correlated with spherical equivalent.
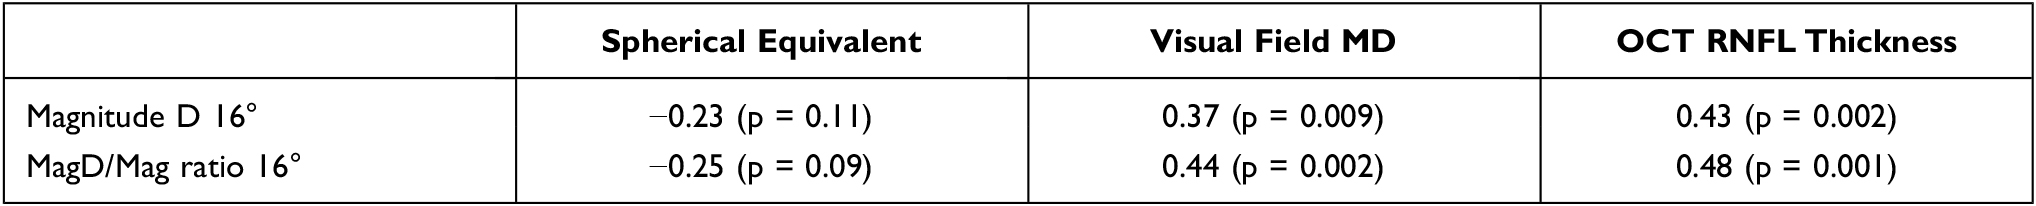 |
Table 4 Pearson Correlation Coefficients of MagD and MagD/Mag Ratio at 16° with the Optic Disc and Visual Field Parameter |
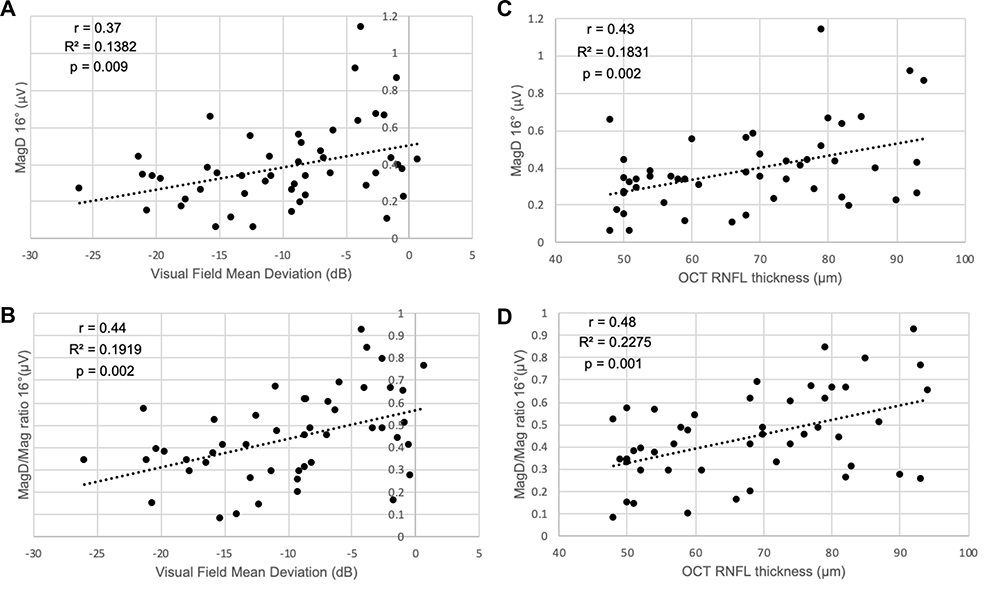 |
Figure 4 Correlation plots of (A) MagD 16° and visual field mean deviation, (B) MagD/Mag ratio 16° and visual field mean deviation, (C) MagD 16° and optical coherence tomography retinal nerve fibre layer mean thickness and (D) MagD/Mag ratio 16° and optical coherence tomography retinal nerve fibre layer mean thickness. Abbreviations: r, Pearson correlation coefficient; R2, coefficient of determination; p, p-value. |
Discussion
The aim of this study was to identify distinct ssPERG features associated with glaucoma in patients with high myopia. MagD/Mag ratio at 16° was significantly lower in glaucomatous eyes (with or without high myopia) compared to those with high myopia without glaucoma, suggesting that glaucoma has a distinct impact on MagD/Mag ratio at 16° irrespective of the presence of myopia.
The ConStim protocol was designed by the manufacturer to detect distinct topographic patterns of dysfunction at or around the central macula (16° and 24° respectively), such as that observed in age-related macular degeneration and diabetic macular oedema. Conversely, the ConSen protocol (Hc and Lc) is meant to detect diffuse patterns of dysfunction such as in glaucoma or diabetic retinopathy. The findings which we observed in our study were rather unexpected, and did not conform to the proposed glaucoma-related retinal responses on the Diopsys NOVA PERG protocols. While there were no significant differences between glaucoma and high myopia in any of the parameters from the ConSen protocol, we observed significant differences with the ConStim protocol only at the central macula region at 16° but not at 24°. The exact reasons for our findings are not known; however, they could be attributed to the following factors. Unlike diabetic retinopathy, glaucoma is known to affect the macular ganglion cell-inner plexiform layer in a more specific manner. Early loss of RGC usually leads to paracentral impairment,34 and several studies that assessed the OCT measurements of the macular ganglion cell-inner plexiform layer in the diagnosis of glaucoma have shown that the inferotemporal macula is usually first affected, with preservation of the nasal macula until late stages of glaucoma.34–36 Decreasing PERG stimulus area concentrically has indeed been shown to correspond with a non-linear decrease in PERG amplitude as the macular area contributes disproportionately to the PERG signal.37 In addition, PERG appears to detect “pan-retinal” RGC injury as evidenced by reductions that do not correspond with visual field losses sustained.38 Studies have been shown to reflect early macular RGC deterioration preceding even visual field defects beyond the area of PERG stimulus.18,39,40 It is possible that the decrease in stimulus diameter with 16° protocol thus increased sensitivity of the procedure to detect glaucoma-associated RGC damage. Furthermore, Diopsys ssPERG has not been previously studied in highly myopic eyes. Therefore, whilst the ConSen protocol may be recommended by the manufacturer for detecting glaucoma, it appears from our study that the ConStim protocol may be more sensitive in identifying features specific for glaucoma in patients with concomitant glaucoma and high myopia. However, further studies examining the different Diopsys NOVA PERG protocols in the myopic population with varying severity are warranted to better understand the effect of myopia on the responses.
To our knowledge, the only other published study that examined the role of ssPERG in distinguishing between myopia and glaucoma was by Mavilio et al29 ssPERG was performed with their own RE-PERG protocol which incorporated 5 consecutive blocks of stimulation and looked at the mean PERG amplitude and phase standard deviation (PSD), the repeatability of the phase of the 2nd harmonic, in 35 normal, 50 glaucomatous and 19 myopic eyes.29 The myopes had spherical refraction of −3.5 to −8.0D.29 The visual field MD was −2.5dB in the glaucoma group, 0.35dB in the normal, and −1.27dB in the myopia group.29 They found that the specificity of the mean PERG amplitude and PSD in glaucoma patients was 82.1% and 84.6% respectively but when glaucoma and myopia patients were assessed together, the specificity of the mean amplitude decreased to 70.69% while that for PSD increased to 93.1%.29 There was significant overlap of the PERG amplitude values, which were reduced, in both the glaucoma and the myopia groups when assessed separately.29 The authors concluded that intrinsic phase variability, represented by the PSD, reflected impaired synaptic function rather than a decrease in the absolute number of RGC, and could help differentiate between glaucoma and myopia in dubious cases.29 Likewise, our study detected differences in MagD and MagD/Mag ratio, which take into account phase variability and consistency, between the glaucomatous and non-glaucomatous groups. As SNR compares the signal strength at 15Hz used for analysis of the PERG against the average ambient electrical signal, the comparable SNR values across all 3 groups in our study (p = 0.17) further support the observation that the higher signal variability observed between the groups in MagD and MagD/Mag ratio is likely associated to RGC dysfunction from glaucoma rather than surrounding contaminating sources.
Although there is a paucity of published data comparing ssPERG features in glaucoma and high myopes,29 there are, however, many studies that have examined its characteristics in different types and stages of glaucoma and with a wide variety of ssPERG protocols and measured parameters.15–21,23–25 The International Society for Clinical Electrophysiology of Vision (ISCEV) published a revision of the standard for clinical PERG in 2012, which included a section on ssPERG.12 While it provided several recommendations,12 there is still limited standardisation of the way in which ssPERG is carried out and analysed in literature. This prevents the detailed comparison of results beyond a handful of studies.
Our study has several limitations. Firstly, we were limited by the lack of a control group of normal participants without glaucoma or high myopia. Secondly, it is unclear how the parameters evaluated in the Diopsys PERG machine correlate with the anatomy and physiology of the retina. Porciatti and Ventura found that using their PERGLA protocol, simulating diminished number of RGCs by decreasing the area of stimulus resulted in reduced PERG amplitudes without phase changes.37 Simulating diminished RGC activity by reducing mean luminance or contrast revealed decreased amplitudes but different phase responses – decreased phase in the former and increased phase in the latter.37 This led to the authors to conclude that PERG amplitude and phase are independent of each other and likely represent disparate neural sources.37 While decreased PERG amplitude in glaucoma were consistent with reduced RGC numbers or activity, the divergent phase responses observed in their study led them to surmise that the phase delays they observed in glaucoma were due to reduced input to RGCs at the synapses between 2nd and 3rd order neurons, such as with diminution of RGC dendritic connections or loss of synaptic junctions, as often occurs before RGC loss in glaucoma.37 In our study, mean magnitude, MagD and MagD/Mag ratio values in groups G and GHM were lower than in group HM across all protocols, consistent with decreased PERG amplitudes and phase delays typical of glaucoma in Porciatti and Ventura’s study, although the observed trend in our study did not meet statistical significance apart from with MagD 16° and MagD/Mag ratio 16°. In particular, the significant differences between glaucomatous and non-glaucomatous highly myopic eyes present with MagD/Mag ratio 16° but not mean magnitude 16° suggests that phase variability and repeatability at the macular region may play an important role and could possibly be attributed to dendritic synaptic dysfunction. It is worth noting, however, that while amplitude tends to be reduced consistently in glaucoma,15–17,22,25 phase responses appear to vary according to the PERG protocol being used.37 Some studies have found delays in phase18,21 while others have not;37 Mavilio et al noted increased variability of phase amongst glaucoma suspects and early glaucoma eyes.16 Preiser et al did not analyze phase altogether, utilising instead the PERG ratio (ratio of PERG amplitude to 0.8° to 16° checks), which was noticeably reduced in both preperimetric and manifest glaucoma.23
We would also like to highlight that for the HM group, we chose to include only participants without visual field defects and without myopia-related maculopathy. Therefore, follow-up studies in subjects with myopic ocular changes resulting in visual field defects are needed, in order to discern their impact on the different test protocols. Additionally, our participants in G and GHM groups had moderate-to-severe glaucoma, which were probably detected more easily with the 100% contrast levels of the ConStim protocol. However, we are unable to tell if the protocols would be as sensitive in picking up damage in milder cases of glaucoma. Lastly, given the relatively small sample size of participants included in the study, our findings need further validation in a larger cohort.
Conclusion
Of the different test protocols in the ssPERG Diopsys system, MagD 16° and MagD/Mag ratio 16° were found to be significantly lower in eyes with glaucoma compared to those with high myopia. Further validation studies with larger sample sizes and with varying severities of glaucoma and myopia are warranted in order to explore the possibility of differentiating glaucomatous from non-glaucomatous myopic changes using ssPERG.
Acknowledgments
The authors would like to thank Ms Chen Li Yu of the Singapore National Eye Centre for having performed the ssPERG for the participants, Ms Joanna Cher Huiyun from the Singapore Eye Research Institute for helping facilitate patient recruitment and data collection and Ms Sangeetha Nagarajan from the Singapore Eye Research Institute for assisting with data cleaning and de-identification.
Funding
This study was supported by a grant from the Singapore National Eye Centre (HREF grant number JRHRER146400).
Disclosure
The authors report no conflicts of interest in this work.
References
1. Weinreb RN, Aung T, Medeiros FA. The pathophysiology and treatment of glaucoma: a review. JAMA. 2014;311(18):1901–1911. doi:10.1001/jama.2014.3192
2. Quigley HA. Glaucoma. Lancet. 2011;377(9774):1367–1377. doi:10.1016/S0140-6736(10)61423-7
3. Holden BA, Fricke TR, Wilson DA, et al. Global prevalence of myopia and high myopia and temporal trends from 2000 through 2050. Ophthalmology. 2016;123(5):1036–1042. doi:10.1016/j.ophtha.2016.01.006
4. Leung CK, Yu M, Weinreb RN, et al. Retinal nerve fiber layer imaging with spectral-domain optical coherence tomography: interpreting the RNFL maps in healthy myopic eyes. Invest Ophthalmol Vis Sci. 2012;53(11):7194–7200. doi:10.1167/iovs.12-9726
5. Tan NYQ, Sng CCA, Ang M. Myopic optic disc changes and its role in glaucoma. Curr Opin Ophthalmol. 2019;30(2):89–96. doi:10.1097/ICU.0000000000000548
6. Xu L, Wang Y, Wang S, Wang Y, Jonas JB. High myopia and glaucoma susceptibility the Beijing Eye Study. Ophthalmology. 2007;114(2):216–220. doi:10.1016/j.ophtha.2006.06.050
7. Shen L, Melles RB, Metlapally R, et al. The association of refractive error with glaucoma in a multiethnic population. Ophthalmology. 2016;123(1):92–101. doi:10.1016/j.ophtha.2015.07.002
8. Mitchell P, Hourihan F, Sandbach J, Wang JJ. The relationship between glaucoma and myopia: the Blue Mountains Eye Study. Ophthalmology. 1999;106(10):2010–2015. doi:10.1016/S0161-6420(99)90416-5
9. Sung MS, Lee TH, Heo H, Park SW. Association between optic nerve head deformation and retinal microvasculature in high myopia. Am J Ophthalmol. 2018;188:81–90. doi:10.1016/j.ajo.2018.01.033
10. Suwan Y, Fard MA, Geyman LS, et al. Association of myopia with peripapillary perfused capillary density in patients with glaucoma: an optical coherence tomography angiography study. JAMA Ophthalmol. 2018;136(5):507–513. doi:10.1001/jamaophthalmol.2018.0776
11. Wilsey LJ, Fortune B. Electroretinography in glaucoma diagnosis. Curr Opin Ophthalmol. 2016;27(2):118–124. doi:10.1097/ICU.0000000000000241
12. Bach M, Brigell MG, Hawlina M, et al. ISCEV standard for clinical pattern electroretinography (PERG): 2012 update. Doc Ophthalmol. 2013;126(1):1–7. doi:10.1007/s10633-012-9353-y
13. Trick GL. Retinal potentials in patients with primary open-angle glaucoma: physiological evidence for temporal frequency tuning deficits. Invest Ophthalmol Vis Sci. 1985;26(12):1750–1758.
14. Bach M. Electrophysiological approaches for early detection of glaucoma. Eur J Ophthalmol. 2001;11(Suppl 2):S41–S49. doi:10.1177/112067210101102S05
15. Porciatti V, Bosse B, Parekh PK, Shif OA, Feuer WJ, Ventura LM. Adaptation of the steady-state PERG in early glaucoma. J Glaucoma. 2014;23(8):494–500. doi:10.1097/IJG.0b013e318285fd95
16. Mavilio A, Scrimieri F, Errico D. Can variability of pattern ERG signal help to detect retinal ganglion cells dysfunction in glaucomatous eyes? Biomed Res Int. 2015;2015:571314. doi:10.1155/2015/571314
17. Gordon PS, Kostic M, Monsalve PF, et al. Long-term PERG monitoring of untreated and treated glaucoma suspects. Doc Ophthalmol. 2020;141(2):149–156. doi:10.1007/s10633-020-09760-5
18. Ventura LM, Porciatti V, Ishida K, Feuer WJ, Parrish IIRK. Pattern electroretinogram abnormality and glaucoma. Ophthalmology. 2005;112(1):10–19. doi:10.1016/j.ophtha.2004.07.018
19. Salgarello T, Giudiceandrea A, Calandriello L, et al. Pattern electroretinogram detects localized glaucoma defects. Transl Vis Sci Technol. 2018;7(5):6. doi:10.1167/tvst.7.5.6
20. Bode SF, Jehle T, Bach M. Pattern electroretinogram in glaucoma suspects: new findings from a longitudinal study. Invest Ophthalmol Vis Sci. 2011;52(7):4300–4306. doi:10.1167/iovs.10-6381
21. Ventura LM, Golubev I, Feuer WJ, Porciatti V. Pattern electroretinogram progression in glaucoma suspects. J Glaucoma. 2013;22(3):219–225. doi:10.1097/IJG.0b013e318237c89f
22. Bach M, Unsoeld AS, Philippin H, et al. Pattern ERG as an early glaucoma indicator in ocular hypertension: a long-term, prospective study. Invest Ophthalmol Vis Sci. 2006;47(11):4881–4887. doi:10.1167/iovs.05-0875
23. Preiser D, Lagreze WA, Bach M, Poloschek CM. Photopic negative response versus pattern electroretinogram in early glaucoma. Invest Ophthalmol Vis Sci. 2013;54(2):1182–1191. doi:10.1167/iovs.12-11201
24. Banitt MR, Ventura LM, Feuer WJ, et al. Progressive loss of retinal ganglion cell function precedes structural loss by several years in glaucoma suspects. Invest Ophthalmol Vis Sci. 2013;54(3):2346–2352. doi:10.1167/iovs.12-11026
25. Mavilio A, Sisto D, Ferreri P, Cardascia N, Alessio G. RE-PERG, a new procedure for electrophysiologic diagnosis of glaucoma that may improve PERG specificity. Clin Ophthalmol. 2017;11:209–218. doi:10.2147/OPTH.S122706
26. Oner A, Gumus K, Arda H, Karakucuk S, Mirza E. Pattern electroretinographic recordings in eyes with myopia. Eye Contact Lens. 2009;35(5):238–241. doi:10.1097/ICL.0b013e3181b343d9
27. Grudzinska E, Modrzejewska M. Axial length in patients with myopia and interpretation of pattern electroretinogram recordings. Clin Ophthalmol. 2021;15:2815–2821. doi:10.2147/OPTH.S308604
28. Nasser N, Suleiman Y, Yousef H. Evaluation of the function of ganglion cells in myopic patients using pattern electroretinogram (PERG). Am J Biomed Life Sci. 2020;8(6):206–211. doi:10.11648/j.ajbls.20200806.13
29. Mavilio A, Sisto D, Ferreri P, Dammacco R, Alessio G. RE-PERG, a new paradigm for glaucoma diagnosis, in myopic eyes. Clin Ophthalmol. 2019;13:1315–1322. doi:10.2147/OPTH.S211337
30. Weinreb RN, Khaw PT. Primary open-angle glaucoma. Lancet. 2004;363(9422):1711–1720. doi:10.1016/S0140-6736(04)16257-0
31. Foster PJ, Buhrmann R, Quigley HA, Johnson GJ. The definition and classification of glaucoma in prevalence surveys. Br J Ophthalmol. 2002;86(2):238–242. doi:10.1136/bjo.86.2.238
32. Mills RP, Budenz DL, Lee PP, et al. Categorizing the stage of glaucoma from pre-diagnosis to end-stage disease. Am J Ophthalmol. 2006;141(1):24–30. doi:10.1016/j.ajo.2005.07.044
33. Jafarzadehpour E, Radinmehr F, Pakravan M, Mirzajani A, Yazdani S. Pattern electroretinography in glaucoma suspects and early primary open angle glaucoma. J Ophthalmic Vis Res. 2013;8(3):199–206.
34. Jeoung JW, Choi YJ, Park KH, Kim DM. Macular ganglion cell imaging study: glaucoma diagnostic accuracy of spectral-domain optical coherence tomography. Invest Ophthalmol Vis Sci. 2013;54(7):4422–4429. doi:10.1167/iovs.12-11273
35. Nakatani Y, Higashide T, Ohkubo S, Takeda H, Sugiyama K. Evaluation of macular thickness and peripapillary retinal nerve fiber layer thickness for detection of early glaucoma using spectral domain optical coherence tomography. J Glaucoma. 2011;20(4):252–259. doi:10.1097/IJG.0b013e3181e079ed
36. Kotera Y, Hangai M, Hirose F, Mori S, Yoshimura N. Three-dimensional imaging of macular inner structures in glaucoma by using spectral-domain optical coherence tomography. Invest Ophthalmol Vis Sci. 2011;52(3):1412–1421. doi:10.1167/iovs.10-5572
37. Porciatti V, Ventura LM. Physiological significance of steady-state PERG losses in glaucoma: clues from simulation of abnormalities in normal subjects. J Glaucoma. 2009;18(7):535–542. doi:10.1097/IJG.0b013e318193c2e1
38. Bach M, Hoffmann M. Update on the pattern electroretinogram in glaucoma. Optom Vis Sci. 2008;85(6):386–395. doi:10.1097/OPX.0b013e318177ebf3
39. Bach M, Sulimma F, Gerling J. Little correlation of the pattern electroretinogram (PERG) and visual field measures in early glaucoma. Doc Ophthalmol. 1997;94(3):253–263. doi:10.1007/BF02582983
40. Bach M, Birkner-Binder D, Pfeiffer N. In incipient glaucoma the pattern electroretinogram displays diffuse, retinal damage. Ophthalmologe. 1993;90(2):128–131.
 © 2021 The Author(s). This work is published and licensed by Dove Medical Press Limited. The
full terms of this license are available at https://www.dovepress.com/terms
and incorporate the Creative Commons Attribution
- Non Commercial (unported, 3.0) License.
By accessing the work you hereby accept the Terms. Non-commercial uses of the work are permitted
without any further permission from Dove Medical Press Limited, provided the work is properly
attributed. For permission for commercial use of this work, please see paragraphs 4.2 and 5 of our Terms.
© 2021 The Author(s). This work is published and licensed by Dove Medical Press Limited. The
full terms of this license are available at https://www.dovepress.com/terms
and incorporate the Creative Commons Attribution
- Non Commercial (unported, 3.0) License.
By accessing the work you hereby accept the Terms. Non-commercial uses of the work are permitted
without any further permission from Dove Medical Press Limited, provided the work is properly
attributed. For permission for commercial use of this work, please see paragraphs 4.2 and 5 of our Terms.