Back to Journals » Clinical Ophthalmology » Volume 10
Steady-state pattern electroretinogram and frequency doubling technology in anisometropic amblyopia
Authors Schiavi C ![]() , Tassi F, Finzi A, Strobbe E, Cellini M
, Tassi F, Finzi A, Strobbe E, Cellini M
Received 21 July 2016
Accepted for publication 20 September 2016
Published 19 October 2016 Volume 2016:10 Pages 2061—2068
DOI https://doi.org/10.2147/OPTH.S117803
Checked for plagiarism Yes
Review by Single anonymous peer review
Peer reviewer comments 2
Editor who approved publication: Dr Scott Fraser
Costantino Schiavi, Filippo Tassi, Alessandro Finzi, Ernesto Strobbe, Mauro Cellini
Department of Experimental, Diagnostic, and Specialty Medicine, Ophthalmology Service, University of Bologna, Bologna, Italy
Background: Steady-state pattern electroretinogram (PERG) and frequency doubling technology (FDT) perimetry can be used to selectively investigate the activity of the M-Y ganglion cells in adult anisometropic amblyopes.
Methods: Fifteen normal subjects (mean 27.8±4.1 years) and 15 adults with anisometropic amblyopia (mean 28.7±5.9 years) were analyzed using steady-state PERG and FDT.
Results: The amplitude of steady-state PERG was significantly different not only among the control group and both the amblyopic eye (P=0.0001) and the sound eye group (P=0.0001), but also between the latter two groups (P=0.006). The difference in FDT mean deviation was statistically significant not only between the control group and amblyopic eye group (P=0.0002), but also between the control group and the sound eye group (P=0.0009). The FDT pattern standard deviation was significantly higher in the control group rather than in the amblyopic eye (P=0.0001) or the sound eye group (P=0.0001). A correlation was found between the reduction in PERG amplitude and the increase in FDT-pattern standard deviation index not only in amblyopic (P=0.0025) and sound (P=0.0023) eyes, but also in the healthy control group (P=0.0001).
Conclusion: These data demonstrate that in anisometropic amblyopia, there is an abnormal functionality of a subgroup of the magnocellular ganglion cells (M-Y), and the involvement of these cells, together with the parvocellular pathway, may play a key role in the clinical expression of the disease.
Keywords: pattern electroretinogram, frequency doubling technology perimetry, retinogeniculate pathways, amblyopia
Introduction
The term “amblyopia” describes a condition characterized by a decrease in best-corrected visual acuity (BCVA) in one or both eyes caused by abnormal binocular interaction, pattern vision deprivation, or both, without any organic disease.1
Traditionally, there are three primary types of amblyopia: anisometropic, strabismic, and deprivation amblyopia. Anisometropic amblyopia occurs in the more ametropic eye in children having a difference in refractive error between the eyes, typically hyperopia or astigmatism. Strabismic amblyopia results from ocular misalignment, typically esotropia, in patients with monocular fixation, whereas deprivation amblyopia is produced by media opacities such as cataract, corneal opacities, and vitreous hemorrhage and is usually the most severe form.2 Unlike the other forms of amblyopia, deprivation amblyopia may be bilateral. Strabismic and anisometropic amblyopia may be combined, and it is not yet clearly established whether anisometropia is the cause of the nonalternating strabismic deviation, or whether a uniocular deviation is the cause of the anisometropic error, since failure to use one eye for fixation at an early age prevents completion of the emmetropization process. Amblyopia is a complex condition involving not only the visual performance of the amblyopic eye, but also binocular vision and the function of the so-called sound eye, which is not really sound, as it shows functional visual abnormalities, even if subclinical and above the threshold level of the most common diagnostic tests.3 To investigate the locus and/or loci of amblyopia in the visual system, several studies have been performed either in humans or animal models, and these have shown that amblyopic deficits may start as early as in the lateral geniculate nucleus (LGN),3,4 but appear to be predominantly at a cortical level.5–10 On the other hand, there remain questions as to whether amblyopia also has a retinal locus.3
The human LGN contains three distinct retinal pathways:4 the parvocellular (P) pathway originating from the midget retinal ganglion cells (RGCs),6,7,11 the koniocellular pathway receiving afferents from the RGCs driven by short wavelength photoreceptors,12–14 and the magnocellular (M) pathway derived from the parasol RGCs;6,11,15,16 this pathway contains two functional cell classes that are similar to cat X and Y geniculate cells. About 5% of LGN M cells respond to a nonlinear Y-type response,17 thus, the term M-Y cells.
The adoption of psychophysical investigation methods,18 especially frequency doubling technology (FDT)19 that allows the selective stimulation of M-Y ganglion cells,17,20 has provided clear information on the magnocellular pathway.
FDT has been proposed as a sensitive test for detecting early functional changes in M-Y ganglion cells, mainly in glaucoma and ocular hypertension,17,21,22 but it has rarely been used in amblyopia.23
Electrophysiological exams have been used in amblyopia to clarify whether the anatomic site in the visual system whose alteration leads to amblyopia has a retinal, geniculate, or cortical origin, but data obtained from pattern electroretinogram (PERG)24,25 to evaluate RGC activity26–28 or from visual evoked potentials to assess cortical activity10,26,29 has shown contrasting results.
The aim of our study was to use a steady-state PERG with a stimulation that creates the frequency doubling illusion similar to that achieved using FDT perimetry to selectively investigate the activity of the M-Y ganglion cells in adult anisometropic amblyopes.
Material and methods
Fifteen visually normal subjects (8 females and 7 males), aged between 25 and 31 years (mean 27.8±4.1 years), and 15 adult patients with anisometropic amblyopia (10 females and 5 males), aged between 22 and 36 years (mean 28.7±5.9 years), were enrolled in the study.
All patients underwent a complete ophthalmological evaluation, including BCVA measurement, Goldmann applanation tonometry, slit-lamp examination of the anterior and posterior segments, cover test, and random dot stereopsis measurement. All normal subjects had normal binocular vision with random dot stereopsis, absence of retinal and optic nerve diseases, and transparent dioptric media. None of them had a history of strabismus or amblyopia. Amblyopic patients had anisometropic amblyopia and absence of normal binocular vision with random dot stereopsis, absence of retinal and optic nerve diseases, and transparent dioptric media. Inclusion criteria for the anisometropic amblyopes were as follows:
- Difference in spherical equivalent (SE) refractive error between the eyes ≥1.5 D but no more than 4 D.
- Visual acuity ≥0.7 decimals in the amblyopic eye.
We excluded patients affected by strabismus, ocular hypertension, glaucoma, retinal and optic nerve diseases, and myopia because PERG may be reduced in high myopia.30
BCVA was measured using “E” charts at a distance of 5 m. All patients also underwent FDT perimetry and steady-state PERG examination.
The study was approved by the S. Orsola-Malpighi Hospital Ethics Committee of the University of Bologna and adhered to tenets of the Declaration of Helsinki. Written informed consent was obtained from all participants.
Frequency doubling technology
FDT perimetry is a technique designed for the rapid and effective identification of visual field impairment in glaucoma patients,21 and its stimulus consists of a bar grid with a low-frequency spatial sinusoidal profile (0.25 cycles/degree), subjected to a sinusoidal temporal commutation at a frequency of 18 Hz. FDT is based on the principle of the frequency doubling illusion, in which the subject perceives twice the number of bars that are actually present.31 Cells that present a nonlinear response to the contrast in the test image, which are therefore responsible for this illusion, are a subgroup of M cells.32
FDT tests (Welch Allyn, Skaneateles Falls, NY, USA) were performed using the N-30 full-threshold program, in which target stimuli consisted of individual sinusoidal gratings, 10 degrees square at 0.25 cycles/degree, alternately flashing at 18 Hz, and were in one of the 19 areas within the central 30 degrees of the visual field.
FDT perimetry examination was carried out at the best optical distance, and participants underwent three different sessions of visual field tests at intervals of 7±2 days to become familiar with the procedure, because none of the study subjects had previous experience with FDT.
In the healthy group, the eye to be examined was randomly chosen, whereas the sound eye was the first tested eye in the amblyopic group. For each visual field, mean defect (MD) and pattern standard deviation (PSD) were evaluated and considered for the statistical analysis.
Steady-state PERG
PERG was recorded using the RetimaxPlus system (CSO Instruments, Florence, Italy) by a blinded examiner who did not know whether the subject was from the amblyopic or the control group.
The patient sat on a chair at a distance of 57 cm from the television screen (resolution 1,024×768; size 34 inches) and fixed binocularly on a red cross at the center of the screen, which subtended a visual angle of 48.89 degrees. The generated potential was measured with HK-LOOP ocular electrodes; the reference electrode was located near the outer canthus and the ground electrode was placed on the ear lobe. The interelectrode resistance was less than 5 kΩ. All subjects had undilated pupils, measuring between 3 and 4 mm, with an appropriate correction for the working distance, and they were allowed to blink freely.
The PERG stimulus was first presented as a full-screen black-and-white vertical bar pattern (contrast: 20%; spatial frequency: 0.3 cycles/degree/cpd; temporal frequency: 15 Hz). The number of samples acquired, mediated, and processed with discrete Fourier transform was 300 and the acquisition time was 133 millisecond (ms).
The pattern presentation (approximately 4 minutes) was preceded by an unmodulated uniform field (approximately 1 minute) of the same mean luminance (blank), which was used to evaluate the background noise level.33 The noise level was 0.08±0.03 μV in both normal subjects and patients.
All participants underwent several recordings during one session, each approximately 5 minutes long, and the minimum interval between successive presentations was 15 minutes, during which time subjects were free to roam indoors while keeping the surface electrodes in place. None of the patients reported visual strain or problems in maintaining fixation, and sweeps contaminated by eye blinks or gross eye movements were automatically rejected over a threshold voltage of 25 μV. Because PERG was recorded in response to relatively fast alternating gratings, the response waveforms were sinusoidal-like with a frequency corresponding to the reversal rate. Packets were automatically evaluated in the frequency domain by discrete Fourier transform to isolate the component at the reversal rate (30 Hz), and the amplitude in microvolts was displayed as a function of time.
Statistical analysis
Data were analyzed using the MedCalc 10.9.1 statistical program (MedCalc Software, Ostend, Belgium). MD and PSD of FDT and the amplitude of steady-state PERG were statistically analyzed using the Mann-Whitney U-test to assess group differences, Wilcoxon’s signed rank test to evaluate within-subject comparisons, and Spearman’s correlation test, considering P<0.05 as significant.
Results
The mean BCVA and the SE in the control group, amblyopic eyes, and sound eyes of the amblyopic group are reported in Table 1.
 | Table 1 BCVA and diopter spherical equivalent values |
BCVA was significantly lower in the amblyopic eyes than in the eyes of the healthy group and in the sound eyes of amblyopic patients (P=0.002 for both groups), whereas no significant difference in BCVA was found between the eyes of the healthy group and sound eyes of amblyopes (P=0.980).
SE was statistically significantly farther from emmetropia in the amblyopic eyes than in the eyes of the healthy group (P=0.007) and in the sound eyes of amblyopic patients (P=0.0005). No significant difference in SE was found between the eyes of the healthy group and sound eyes of amblyopes (P=0.723).
As regards FDT parameters, MD was very similar in amblyopic eyes and sound eyes of amblyopic patients, and no significant difference was observed (P=0.276) between these groups. On the other hand, a significant difference was found between the control group and both amblyopic eyes (P=0.0002) and sound eyes (P=0.0009).
Notably, PSD was significantly increased in both amblyopic and sound eyes compared to the healthy control group (P=0.0001), whereas no difference was reported between amblyopic and sound eyes (P=0.121) (Table 2 and Figure 1).
 | Table 2 FDT perimetry values |
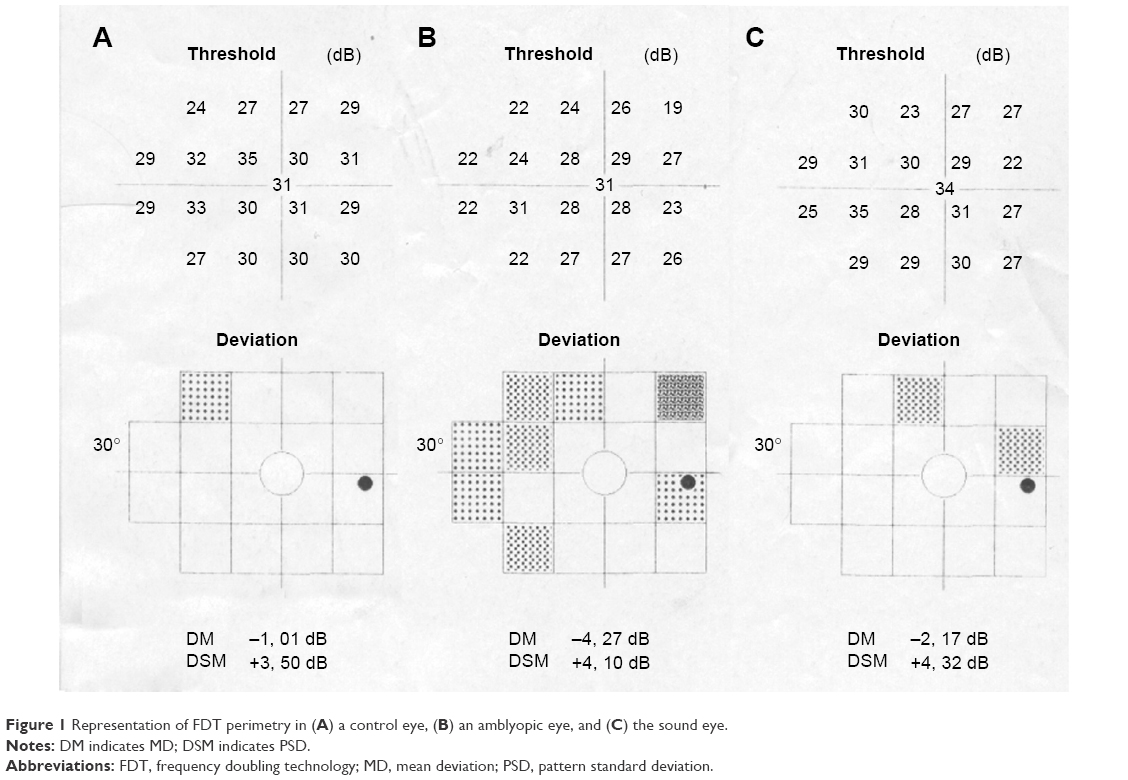 | Figure 1 Representation of FDT perimetry in (A) a control eye, (B) an amblyopic eye, and (C) the sound eye. |
Concerning the amplitude of the wave of the second harmonic of steady-state PERG, there was a significant difference not only between the control group and both the amblyopic eye (P=0.0001) and sound eye groups (P=0.0001) but also between the latter two groups (P=0.006) (Table 3 and Figure 2).
 | Table 3 Steady-state PERG amplitude values |
 | Figure 2 Representation of PERG steady-state response in (A) a control eye, (B) an amblyopic eye, and (C) the sound eye. |
Finally, Spearman’s correlation test showed a significant correlation between the reduction in PERG’s wave amplitude and the simultaneous increase in PSD values, which explains the negative correlation between these entities. This correlation was found not only in amblyopic (P=0.0025) and sound (P=0.0023) eyes but also in the healthy control group (P=0.0001) (Figures 3–5).
 | Figure 3 Scatterplot of Spearman’s correlation test between FDT-PSD and PERG steady-state amplitude in amblyopic eyes. |
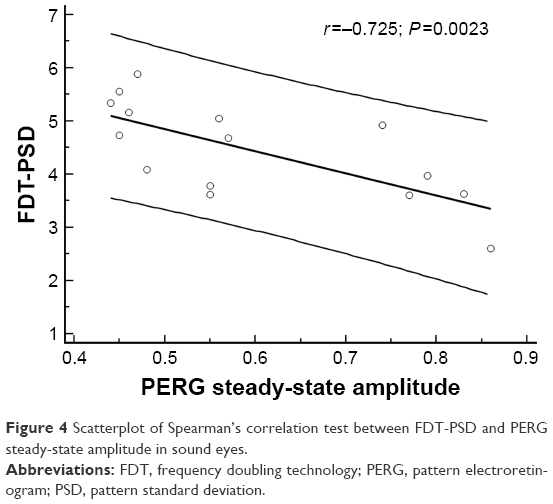 | Figure 4 Scatterplot of Spearman’s correlation test between FDT-PSD and PERG steady-state amplitude in sound eyes. |
 | Figure 5 Scatterplot of Spearman’s correlation test between FDT-PSD and PERG steady-state amplitude in healthy control eyes. |
Discussion
Anisometropia of 1.0 D appears to be the threshold for developing amblyopia, by causing a loss of foveal resolution in the less focused eye, by favoring the onset of localized mechanisms of foveal inhibition, ie, a suppression scotoma, or by inducing loss of stereoacuity and normal binocular function.
There is evidence for each of these mechanisms in the literature.34
The primary psychophysical defect observed in patients with anisometropic amblyopia is in the high spatial frequency contrast sensitivity. The resolution necessary for BCVA represents high contrast between the letters and their surroundings at high spatial frequencies (closeness of letters). Bradley and Freeman35 tested 10 patients with anisometropic amblyopia and found that their greatest defect was at high spatial frequencies, whereas at low spatial frequencies there were only small differences between the eyes, which could be accounted for by optical magnification differences caused by the anisometropic defect. The intereye difference in spatial frequency contrast sensitivity correlated with the magnitude of anisometropia.35
The observation that anisometropic amblyopia is associated primarily with loss of high spatial frequency contrast sensitivity, with resultant defects in stereoacuity and summation, has also been demonstrated by other investigators.36–38
Functional magnetic resonance imaging studies have demonstrated that in amblyopic eyes, high spatial frequency chromatic and achromatic stimuli are able to show the main abnormalities of both the P and M pathways at the level of either LGN4,39 or the visual cortex,40,41 but, unfortunately, although it is known that the M pathway plays an important role in decoding the information sent along the P pathway in the brain, the investigation of the M pathway in amblyopia has not received the same attention as has occurred for other eye diseases, particularly in glaucoma.42 Indeed, although the exact role of the M pathway is not fully elucidated, it is known that it carries information on motion perception, stereopsis, spatial localization, depth perception, hyperacuity, figural grouping, illusory border perception, and figure/ground segregation.43 Furthermore, the M pathway plays a key role in abolishing saccadic movements.44,45
Although there are controversial debates in literature,26–28 most agree that there is a disruption or imbalance of the M-P systems in many patients with visual functional problems.
The adoption of psychophysical exams,18 especially the FDT,19,42,46 that selectively stimulate a cluster of M ganglion cells which have a nonlinear response and are called M-Y cells,17,20 allowed better investigation of the behavior of M cells.
Interestingly, few data on FDT in amblyopia exist in the literature and they basically show impaired FDT fields with reduced foveal sensitivity and increased MD values in strabismic amblyopia.23
The results of our study highlight that in both the amblyopic and sound eye there is not only a significant decrease in FDT-MD but also a significant increase in FDT-PSD values, compared to the healthy control group, whereas there were no statistically significant differences between amblyopic and sound eyes. This is consistent with the results of a previous study.9
On the other hand, to explain the results obtained using steady-state PERG, several points should be mentioned. Both transient and steady-state PERG are commonly used to investigate RGC activity, but these two exams differ mainly in the temporal frequency of the pattern stimulus. In detail, by using a temporal frequency of 4 Hz, a transient response will be obtained, whereas by increasing the frequency to 8 Hz, a steady-state response will be recorded.47 A second difference between the two exams is that transient PERG originates from the activity of both ON and OFF pathways of the RGCs, whereas steady-state PERG originates mainly from the ON pathway of the RGCs.48
In our study we used a vertical bar pattern stimulus with a marked increase in the temporal frequency (15 Hz) to obtain the frequency doubling illusion17,19 and reduced both spatial frequency17 and contrast49 to stimulate the nonlinear response of M-Y RGCs.
The question is whether the Y-cells, first identified in cats, even exist in the primate’s retina; indeed this is a controversial topic in literature, but recent studies have identified Y-like RGCs in primates.20,50–52 Furthermore, experimental studies have demonstrated that when reversing contrast gratings were presented at high spatial frequencies, every recorded (M pathway) RGC displayed the frequency-doubled response, which is the main characteristic of Y-cells.50
To further sensitize the examination and to selectively stimulate M-Y RGCs, we greatly reduced the contrast, as suggested by Porciatti et al.49 The bioelectric impulse coming from the M pathway to the cortex will be finally decoded and processed in the visual cortex itself, in order to obtain the illusion of the “frequency doubling” effect.53,54
Moreover, we found a significant reduction in the amplitude of PERG in both the amblyopic and sound eye compared to the healthy control group, and a significant difference between the amblyopic and sound eye, which was not observed using FDT perimetry.
Finally, a significant correlation between the amplitude of the second harmonic of PERG examination and the PSD index in amblyopic, sound, and control eyes was shown.
Electrofunctional studies on RGCs in amblyopic patients have shown contrasting results, mostly because different methods of examination have been used on very heterogeneous study groups with regard to the type of amblyopia.4,5,8,9
In detail, most of the previous studies that were conducted using transient PERG found a reduction in the amplitude with an increase in the latency of the response in the amblyopic eye compared to the control eye,26,55 whereas other investigators showed no difference between the healthy control group and amblyopic eyes as regards both amplitude and latency.10,27
Unfortunately, the use of steady-state PERG has not yet produced clear and definitive data. Some authors observed a decrease in the amplitude in the amblyopic eye compared to healthy eyes,56 whereas others did not detect any significant difference between amblyopic eyes and healthy the control group.57
The correlation we reported between the amplitude of steady-state PERG and the PSD index confirms the marked selectivity of our electrophysiological examination to test the M pathway. Indeed, in previous studies, FDT-PSD proved to be very sensitive in highlighting early damage of M-Y ganglion cells in diseases that alter the visual pathway (eg, ocular hypertension and early glaucoma).58,59
Our study shows that, in anisometropic amblyopia, there is an alteration in the activity of M-Y ganglion cells and, although this abnormality may be detected with either FDT perimetry or steady-state PERG, we believe that steady-state PERG stimulation using our parameters is more sensitive than FDT, as it was also able to detect different responses among amblyopic and sound eyes of anisometropic adult amblyopes. Furthermore, FDT records the amblyopic deficit as a result of anomalous processing of M pathway signals at a cortical level, as it is a psychophysical subjective test, whereas steady-state PERG records objectively abnormal ganglion cell activities.
Conclusion
Our study demonstrates an abnormal activity of M-Y ganglion cells in anisometropic amblyopic adult patients, thus confirming that the involvement of both P and M pathways may play some role in the clinical expression of the disease, not only in the retina of the amblyopic eye, but also in that of the sound eye.
Acknowledgment
We thank Maria Mottes for technical and moral support.
Disclosure
The authors report no conflicts of interest in this work.
References
Husk JS, Farivar R, Hess RF. Amblyopic deficits in processing structure-from-motion. J Vis. 2012;12(4):1–12. | ||
Donahue SP. The relationship between anisometropia, patient age, and the development of amblyopia. Trans Am Ophthalmol Soc. 2005;103:313–336. | ||
Simons K. Amblyopia characterization, treatment, and prophylaxis. Surv Ophthalmol. 2005;50(2):123–166. | ||
Hess RF, Thompson B, Gole GA, Mullen KT. The amblyopic deficit and its relationship to geniculo-cortical processing streams. J Neurophysiol. 2010;104(1):475–483. | ||
Muckli L, Kiess S, Tonhausen N, Singer W, Goebel R, Sireteanu R. Cerebral correlates of impaired grating perception in individual, psychophysically assessed human amblyopes. Vision Res. 2006;46(4):506–526. | ||
Lee BB, Pokorny J, Smith VC, Martin PR, Valberg A. Luminance and chromatic modulation sensitivity of macaque ganglion cells and human observers. J Opt Soc Am A. 1990;7:2223–2236. | ||
Merigan WH, Katz LM, Maunsell JH. The effects of parvocellular lateral geniculate lesions on the acuity and contrast sensitivity of macaque monkeys. J Neurosci. 1991;11:994–1001. | ||
Zele AJ, Pokorny J, Lee DY, Ireland D. Anisometropic amblyopia: spatial contrast sensitivity deficits in inferred magnocellular and parvocellular vision. Invest Ophthalmol Vis Sci. 2007;48(8):3622–3631. | ||
Schiavi C, Tassi F, Finzi A, Cellini M. Alterations induced by Bangerter filters on the visual field: a frequency doubling technology and standard automated perimetry study. J Ophthalmol. 2015;2015:1–8. | ||
Parisi V, Scarale ME, Balducci N, Fresina M, Campos EC. Electrophysiological detection of delayed postretinal neural conduction in human amblyopia. Invest Ophthalmol Vis Sci. 2010;51(10):5041–5048. | ||
Derrington A, Lennie P. Spatial and temporal contrast sensitivities of neurons in lateral geniculate nucleus of macaque. J Physiol. 1984;357:219–240. | ||
Chatterjee S, Callaway EM. Parallel colour-opponent pathways to primary visual cortex. Nature. 2003;426:668–671. | ||
Dacey DM, Packer OS. Colour coding in the primate retina: diverse cell types and cone-specific circuitry. Curr Opin Neurobiol. 2003;13:421–427. | ||
Martin PR, White AJ, Goodchild AK, Wilder HD, Sefton AE. Evidence that blue-on cells are part of the third geniculocortical pathway in primates. Eur J Neurosci. 1997;9:1536–1541. | ||
Kaplan E, Shapley RM. X and Y cells in the lateral geniculate nucleus of macaque monkeys. J Physiol. 1982;330:125–143. | ||
Solomon SG, White AJ, Martin PR. Temporal contrast sensitivity in the lateral geniculate nucleus of a New World monkey, the marmoset Callithrix jacchus. J Physiol. 1999:517:907–917. | ||
Maddess T, Goldberg I, Dobinson J, Wine S, Welsh AH, James AC. Testing for glaucoma with the spatial frequency doubling illusion. Vision Res. 1999;39:4258–4273. | ||
Grounds AR, Holliday IE, Ruddock KH. Two spatio-temporal filters in human vision. II. Selective modification in amblyopia, albinism, and hemianopia. Biol Cybern. 1983;47:191–201. | ||
Kelly DH. Frequency doubling in visual responses. J Opt Soc Am. 1966;56:1628–1633. | ||
Petrusca D, Grivich MI, Sher A, et al. Identification and characterization of a Y-like primate retinal ganglion cell type. J Neurosci. 2007;27(41):11019–11027. | ||
Johnson CA, Samuels SJ. Screening for glaucomatous visual field loss with frequency-doubling perimetry. Invest Ophthalmol Vis Sci. 1997;38:413–425. | ||
Medeiros FA, Sample PA, Weinreb RN. Frequency doubling technology perimetry abnormalities as predictors of glaucomatous visual field loss. Am J Ophthalmol. 2004;137:863–871. | ||
Patel N. The use of frequency doubling technology to determine magnocellular pathway deficiencies. J Behav Optom. 2004;15(2):31–36. | ||
Morrone MC, Fiorentini A, Bisti S, Porciatti V, Burr DC. Pattern reversal electroretinogram in response to chromatic stimuli: II. Monkey. Vis Neurosci. 1994;11:873–884. | ||
Maffei L, Fiorentini A. Electroretinographic responses to alternating gratings before and after section of the optic nerve. Science. 1981;211:953–955. | ||
Sokol S, Nadler D. Simultaneous electroretinograms and visually evoked potentials from adult amblyopes in response to a pattern stimulus. Invest Ophthalmol Vis Sci. 1979;18:848–855. | ||
Teping C, Kamps I, Reim M. Retinal and retinocortical times to pattern stimulation in amblyopic children. Doc Ophthalmol. 1989;73:111–117. | ||
Sokol S. Abnormal evoked potential latencies in amblyopia. Br J Ophthalmol. 1983;67:310–314. | ||
Johansson B, Jakobsson P. Fourier-analysed steady-state VEPs in pre-school children with and without normal binocularity. Doc Ophthalmol. 2006;112:13–22. | ||
Hidajat R, Mclay J, Burley C, Elder M, Morton J, Goode D. Influence of axial length of normal eyes on PERG. Doc Ophthalmol. 2003;107:195–200. | ||
Nomoto H, Matsumoto C, Takada S, et al. Detectability of glaucomatous changes using SAP, FDT, flicker perimetry, and OCT. J Glaucoma. 2009;18(2):165–171. | ||
Ingram RM, Walker C. Refraction as a means of predicting squint or amblyopia in preschool siblings of children known to have these defects. Br J Ophthalmol. 1979;63:238–242. | ||
Porciatti V, Sorokac N, Buchser W. Habituation of retinal ganglion cell activity in response to steady state pattern visual stimuli in normal subjects. Invest Ophthalmol Vis Sci. 2005;46(4):1296–1302. | ||
Legras R, Hornain V, Monot A, Chateau N. Effect of induced anisometropia on binocular through-focus contrast sensitivity. Optom Vis Sci. 2001;78:503–509. | ||
Bradley A, Freeman RD. Contrast sensitivity in anisometropic amblyopia. Invest Ophthalmol Vis Sci. 1981;21:467–476. | ||
Holopigian K, Blake R, Greenwald MJ. Selective losses in binocular vision in anisometropic amblyopes. Vision Res. 1986;26:621–630. | ||
Hess RF, Holliday IE. The spatial localization deficit in amblyopia. Vision Res. 1992;32:1319–1339. | ||
McKee SP, Levi DM, Movshon JA. The pattern of visual deficits in amblyopia. J Vis. 2003;3:380–405. | ||
Hess RF, Thompson B, Gole G, Mullen KT. Deficient responses from the lateral geniculate nucleus in humans with amblyopia. Eur J Neurosci. 2009;29(5):1064–1070. | ||
Barnes GR, Hess RF, Demoulin SO, Achtman RL, Pike GB. The cortical deficit in humans with strabismic amblyopia. J Physiol (Lond). 2001;533:281–297. | ||
Thompson B, Villeneuve MY, Casanova C, Hess RF. Abnormal cortical processing of pattern motion in amblyopia: evidence from fMRI. NeuroImage. 2012;60:1307–1315. | ||
Shapley R. Visual sensitivity and parallel retinocortical channels. Annu Rev Psychol. 1990;41:635–658. | ||
Livingstone MS, Hubel DH. Psychophysical evidence for separate channels for the perception of form, color, movement, and depth. J Neurosci. 1987;7(11):3416–3468. | ||
Uchikawa K, Sato M. Saccadic suppression of achromatic and chromatic responses measured by increment-threshold spectral sensitivity. J Opt Soc Am A Opt Image Sci Vis. 1995;12(4):661–666. | ||
Fischer B, Breitmeyer B. Mechanisms of visual attention revealed by saccadic eye movements. Neuropsychologia. 1987;25:73–83. | ||
Kelly DH. Nonlinear visual responses to flickering sinusoidal gratings. J Opt Soc Am. 1981;71:1051–1055. | ||
Bach M, Brigell MG, Hawlina M, et al. ISCEV standard for clinical pattern electroretinography (PERG): 2012 update. Doc Ophthalmol. 2013;126(1):1–7. | ||
Luo X, Frishman LJ. Retinal pathway origins of the pattern electroretinogram (PERG). Invest Ophthalmol Vis Sci. 2011;52(12):8571–8584. | ||
Porciatti V, Ventura LM. Physiological significance of steady-state PERG losses in glaucoma: clues from simulation of abnormalities in normal subjects. J Glaucoma. 2009;18(7):535–542. | ||
Crook JD, Peterson BB, Packer OS, Robinson FR, Troy JB, Dacey DM. Y-cell receptive field and collicular projection of parasol ganglion cells in macaque monkey retina. J Neurosci. 2008a;28:11277–11291. | ||
Crook JD, Peterson BB, Packer OS, et al. The smooth monostratified ganglion cell: evidence for spatial diversity in the Y-cell pathway to the lateral geniculate nucleus and superior colliculus in the macaque monkey. J Neurosci. 2008b;28:12654–12671. | ||
Rosemberg A, Talebi V. The primate retina contains distinct types of Y-like ganglion cells. J Neurosci. 2009;29(16):5048–5050. | ||
White AJ, Sun H, Swanson WH, Lee BB. An examination of physiological mechanisms underlying the frequency-doubling illusion. Invest Ophthalmol Vis Sci. 2002;43:3590–3599. | ||
Zeppieri M, Demirel S, Kent K, Johnson CA. Perceived spatial frequency of sinusoidal gratings. Optom Vis Sci. 2008;85:318–329. | ||
Dahlke C, Dodt E. Amblyopic eyes produce an abnormal electroretinogram in pattern presentation with the on-off technique. Ophthalmologe. 1994;91:176–180. | ||
Arden GB, Wooding SL. Pattern ERG in amblyopia. Invest Ophthalmol Vis Sci. 1985;26:88–96. | ||
Hess RF, Baker CL Jr. Assessment of retinal function in severely amblyopic individuals. Vision Res. 1984;24(10):1367–1376. | ||
Cellini M, Toschi PG, Strobbe E, Balducci N, Campos EC. Frequency doubling technology, optical coherence technology and pattern electroretinogram in ocular hypertension. BMC Ophthalmol. 2012;12:33. | ||
Tafreshi A, Racette L, Weinreb RN, et al. Pattern electroretinogram and psycophysical tests of visual function for discriminating between healthy and glaucoma eyes. Am J Ophthalmol. 2009;149(3):488–495. |
 © 2016 The Author(s). This work is published and licensed by Dove Medical Press Limited. The
full terms of this license are available at https://www.dovepress.com/terms
and incorporate the Creative Commons Attribution
- Non Commercial (unported, 3.0) License.
By accessing the work you hereby accept the Terms. Non-commercial uses of the work are permitted
without any further permission from Dove Medical Press Limited, provided the work is properly
attributed. For permission for commercial use of this work, please see paragraphs 4.2 and 5 of our Terms.
© 2016 The Author(s). This work is published and licensed by Dove Medical Press Limited. The
full terms of this license are available at https://www.dovepress.com/terms
and incorporate the Creative Commons Attribution
- Non Commercial (unported, 3.0) License.
By accessing the work you hereby accept the Terms. Non-commercial uses of the work are permitted
without any further permission from Dove Medical Press Limited, provided the work is properly
attributed. For permission for commercial use of this work, please see paragraphs 4.2 and 5 of our Terms.