Back to Journals » Clinical Ophthalmology » Volume 11
Spectropathology-corroborated multimodal quantitative imaging biomarkers for neuroretinal degeneration in diabetic retinopathy
Authors Guha Mazumder A ![]() , Chatterjee S, Chatterjee S, Gonzalez JJ, Bag S, Ghosh S, Mukherjee A, Chatterjee J
, Chatterjee S, Chatterjee S, Gonzalez JJ, Bag S, Ghosh S, Mukherjee A, Chatterjee J
Received 22 April 2017
Accepted for publication 17 August 2017
Published 22 November 2017 Volume 2017:11 Pages 2073—2089
DOI https://doi.org/10.2147/OPTH.S140110
Checked for plagiarism Yes
Review by Single anonymous peer review
Peer reviewer comments 2
Editor who approved publication: Dr Scott Fraser
Arpan Guha Mazumder,1,2 Swarnadip Chatterjee,3 Saunak Chatterjee,1 Juan Jose Gonzalez,4 Swarnendu Bag,5 Sambuddha Ghosh,6 Anirban Mukherjee,7 Jyotirmoy Chatterjee1
1Multimodal Imaging and Computing for Theranostics Laboratory, School of Medical Science and Technology, Indian Institute of Technology-Kharagpur, Kharagpur, West Bengal, India; 2Johns Hopkins University School of Medicine, Baltimore, MD, USA; 3Advanced Technology Development Centre, Indian Institute of Technology-Kharagpur, Kharagpur, West Bengal, India; 4Department of Computer and Electrical Engineering, Rice University, Houston, TX, USA; 5Department of Biotechnology, National Institute of Technology Sikkim, Ravangla Sub-Division, South Sikkim, 6Department of Ophthalmology, Calcutta National Medical College and Hospital, Kolkata, West Bengal, 7Department of Electrical Engineering, Indian Institute of Technology-Kharagpur, Kharagpur, West Bengal, India
Introduction: Image-based early detection for diabetic retinopathy (DR) needs value addition due to lack of well-defined disease-specific quantitative imaging biomarkers (QIBs) for neuroretinal degeneration and spectropathological information at the systemic level. Retinal neurodegeneration is an early event in the pathogenesis of DR. Therefore, development of an integrated assessment method for detecting neuroretinal degeneration using spectropathology and QIBs is necessary for the early diagnosis of DR.
Methods: The present work explored the efficacy of intensity and textural features extracted from optical coherence tomography (OCT) images after selecting a specific subset of features for the precise classification of retinal layers using variants of support vector machine (SVM). Fourier transform infrared (FTIR) spectroscopy and nuclear magnetic resonance (NMR) spectroscopy were also performed to confirm the spectropathological attributes of serum for further value addition to the OCT, fundoscopy, and fluorescein angiography (FA) findings. The serum metabolomic findings were also incorporated for characterizing retinal layer thickness alterations and vascular asymmetries.
Results: Results suggested that OCT features could differentiate the retinal lesions indicating retinal neurodegeneration with high sensitivity and specificity. OCT, fundoscopy, and FA provided geometrical as well as optical features. NMR revealed elevated levels of ribitol, glycerophosphocholine, and uridine diphosphate N-acetyl glucosamine, while the FTIR of serum samples confirmed the higher expressions of lipids and β-sheet-containing proteins responsible for neoangiogenesis, vascular fragility, vascular asymmetry, and subsequent neuroretinal degeneration in DR.
Conclusion: Our data indicated that disease-specific spectropathological alterations could be the major phenomena behind the vascular attenuations observed through fundoscopy and FA, as well as the variations in the intensity and textural features observed in OCT images. Finally, we propose a model that uses spectropathology corroborated with specific QIBs for detecting neuroretinal degeneration in early diagnosis of DR.
Keywords: diabetic retinopathy, quantitative imaging biomarkers, QIBs, spectropathology, neuroretinal degeneration, optical coherence tomography, OCT, support vector machine, SVM
Introduction
Diabetic retinopathy (DR) is currently one of the most prevalent health diseases worldwide, with an incidence of 6.9%.1,2 Specific markers are essential for prognosis of DR, since metabolic dysfunction may persist for several years before clinical manifestation of diabetes3 and its sequel (viz, DR with neuroretinal degenerative symptoms). DR-associated retinal neurodegeneration occurs before any detectable microcirculatory abnormalities4 in ophthalmoscopic examination. In other words, retinal neurodegeneration is an early event in the pathogenesis of DR and it may contribute to the microcirculatory anomalies of such disease progression. Therefore, development of an integrated assessment method for detecting neuroretinal degeneration is necessary using spectropathological5 and quantitative imaging biomarkers (QIBs) for early diagnosis of DR. It is unlikely that a single test will offer all the answers to clinical predicaments. The multiplexing of several retinal imaging modalities such as optical coherence tomography (OCT), fundoscopy, and fluorescein angiography (FA), coupled with Fourier transform infrared (FTIR) spectroscopy and nuclear magnetic resonance (NMR), may be contributory in delineating such disease conditions and detecting DR-associated retinal neurodegeneration with greater precision. There are reports on the utility of noninvasive optical diagnostic systems, such as spectral domain-OCT (SD-OCT), Raman spectroscopy, FTIR, fluorescence spectroscopy, and microendoscopy, for pathophysiological studies, especially for the integrated assessment of structural and spectropathological differences, in understanding the pathology of complex diseases, which may therefore be considered for studies in diabetes, especially in DR-affected individuals.
SD-OCT delivers real-time, high-resolution, subsurface images up to 2 mm tissue depth.6 OCT is mainly used to monitor morphological changes in the retina over time, which has turned out to be appreciable, particularly due to the latest perception of “disease modulation” associated with new treatment modalities. “Lucidity” is one of the optical intensity descriptors used for OCT images. It tends to vary with different regions of layered body structures, such as skin wounds, cancerous lesions, and specific retinal layers of the retina (eg, ganglion cell layer [GCL] and inner plexiform layer [IPL]). Specially, lucidity of the retinal layers tends to vary simultaneously with the thinning of brain tissues and consequent atrophy. OCT-based imaging markers were found to be useful for predicting retinal neurodegeneration in early diagnosis of glaucoma,7 age-related macular degeneration (AMD),8 and Alzheimer’s disease.9
Recently, QIBs are widely accepted as well-defined “image characteristics to objectively measure and assess the indicators for normal physiological processes, pathogenic progressions, or responses to therapeutic interferences”.10 A recent study has implemented automated classification of the retina in an ocular tumor-induced mouse model using textural features extracted from OCT.11 The concepts of QIBs can be augmented further if biochemical and spectroscopic information of the serum samples are correlated with selected OCT features of retinal layers. The support vector machine (SVM) was used here for disease classification, since it can classify the diseases with high prognostic accuracy and speed, as shown in a previous study.12 Various neurodegenerative disorders involve variations in venous branching pattern asymmetry and increased arteriolar length-to-diameter ratios.13 Researchers evaluated other geometrical attributes such as vascular attenuation, complexity of branching pattern, and vessel tortuosity and hypothesized that retinal vascular morphological alterations could be correlated with β-amyloid deposition extending from the central nervous system (CNS) to the retina, which results in vessel wall destruction.14 Therefore, detailed fundoscopic evaluation and serial retinal photography may be used as screening mechanisms for retinal vascular alterations indicating a neurodegenerative condition. These may serve as indirect measures of β-amyloid protein deposition in retinal vessels in DR.
The changes in vascular blood circulation and compositional alterations in the serum have intimate associations with retinal morphological and structural aberrations in ocular complications.15 The nourishment of the intraocular tissues is accomplished by the retinal vessels, uveal vessels, and the aqueous humor.16 The retinal vessels are both morphologically and physiologically similar to those in the brain and responsible for transporting nutrients through blood for the nourishment of each of the retinal layers. Impairment of this nutrient supply system and an altered blood metabolomic status may cause catastrophic effects on the structure and geometry of the retinal layers and fundus,17 which can be evaluated with the integrated application of OCT, color fundoscopy, and FA. Metabolomics is the study of the set of metabolites, ie, all small endogenous molecules from cells, tissues, or biofluids.18 Since the metabolome is downstream from the proteome and transcriptome,19 it illustrates a more complicated level of association than the proteome or transcriptome for comprehending a complex biological system. Metabolomic measurements represent the biochemical consequences of alterations at both the transcriptomic and proteomic levels and can provide hints to pathways that show the least ability to adapt to perturbation. A strong advantage of metabolomics is the ability to reveal novel and potentially relevant metabolites, which can be the basis of therapeutic approaches or prognostic indicators.20 So, apart from using imaging techniques such as OCT, fundoscopy, and FA, we also adopted spectropathological approaches such as 1H-NMR and FTIR of serum for obtaining metabolomic cues linked to retinal neurodegeneration. The metabolomic, biomolecular, submolecular, and biochemical alterations in serum could serve as a complementary proof, further strengthening evidences obtained through retinal diagnostic imaging modalities.
Methods
Image acquisition from OCT, fundoscopy, and FA
OCT, fundoscopy, and FA images were obtained from 45 subjects. Fifteen diabetes mellitus patients without DR (DM) in either eye and 15 diabetes patients with DR (early condition or nonproliferative diabetic retinopathy [NPDR]) in any or both eyes attending the eye clinic of a tertiary care teaching institute (Regional Institute of Ophthalmology [RIO], Kolkata) were included in the study. Inclusion criteria were as follows: type 2 diabetes mellitus patients; age >30 years; and absence of any major comorbidity. Exclusion criteria were as follows: photocoagulation in the preceding 6 months; history of previous intravitreal injection/vitreoretinal surgery for glaucoma; and presence of any autoimmune or liver disease, renal failure, neoplasia, acute bacterial/viral infection, or any other endocrine disorder. Fifteen age- and sex-matched healthy volunteers (normal [NOM]) were included in the control group. All the OCT, fundus, and FA images were obtained using an SD-OCT imaging system having fundoscopy and FA imaging facilities (Heidelberg Spectralis SD-OCT; Heidelberg Engineering, Heidelberg, Germany; fundus imaging specifications: confocal scanning laser ophthalmoscope (cSLO): field of view – high-speed mode: 11 μm, high-resolution mode: 5 μm; optional 55° lens; light sources: 820 nm laser, 870 nm superluminescent diode [SLD]; imaging modes: SD-OCT, IR OCT; specifications: 40,000 A-scans/second, axial resolution: 7 μm optical, 3.5 μm/pixel digital; lateral resolution: 14 μm optical). The study was performed under the ethical guidelines of institutional ethics committee (IEC) of the Regional Institute of Ophthalmology (RIO), Kolkata, West Bengal, India (reference number RIO-2012/946; approval dated 2/6/2012); the study subjects were recruited only after obtaining their written informed consents. The study also followed the tenets of the Declaration of Helsinki.
Feature extraction from OCT images
The retinal layers were identified and initially segmented using the “Image Segmenter App” of MATLAB 2015a version (MathWorks, Natick, MA, USA), from the high-resolution SD-OCT images. After manual area initialization, edge-based active contour segmentation was carried out with 100 iterations. Eight intensity features and 14 textural features (Table 1) were extracted from these semiautomatically segmented areas of six retinal layers (GCL, outer nuclear layer [ONL], inner nuclear layer [INL], outer plexiform layer [OPL], retinal nerve fiber layer [RNFL], retinal pigment epithelium [RPE]) of the OCT images (Figure 1). The primary features were selected for image-based disease classification using the methods described by Ughi et al.21
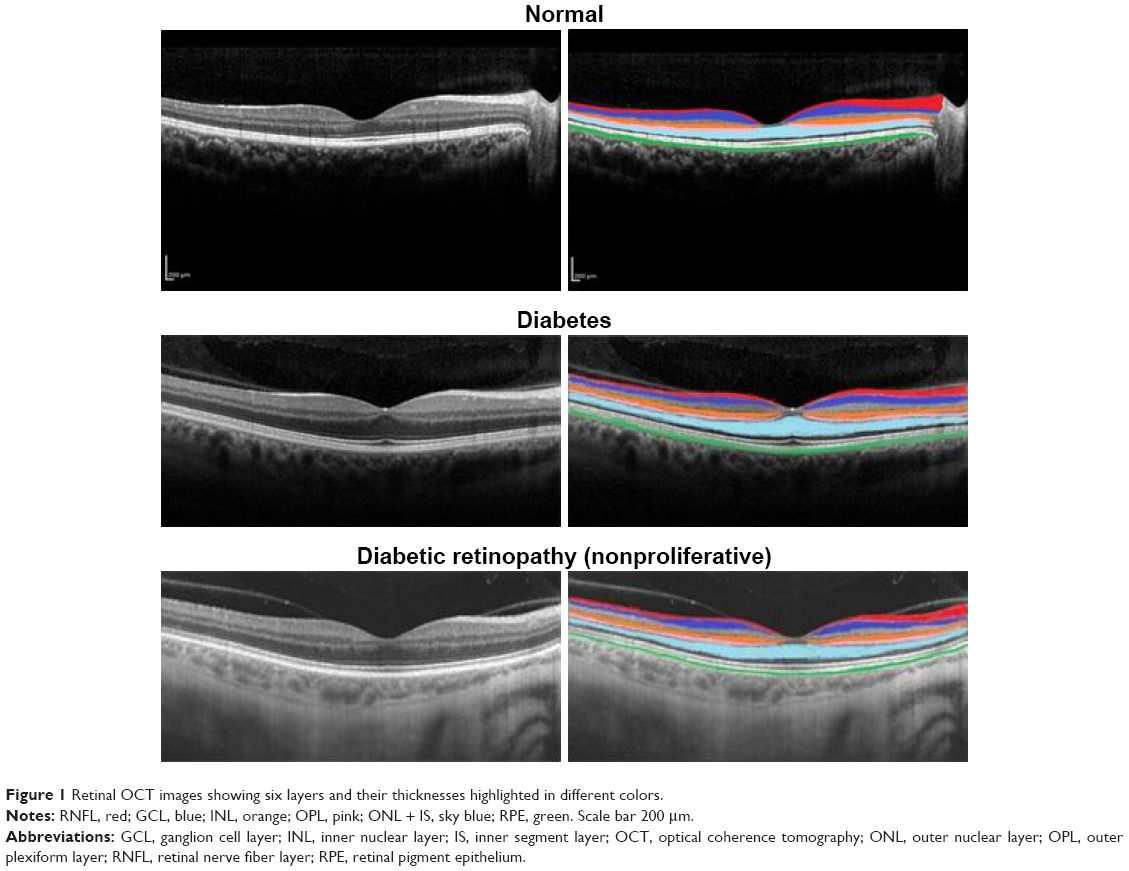 | Figure 1 Retinal OCT images showing six layers and their thicknesses highlighted in different colors. |
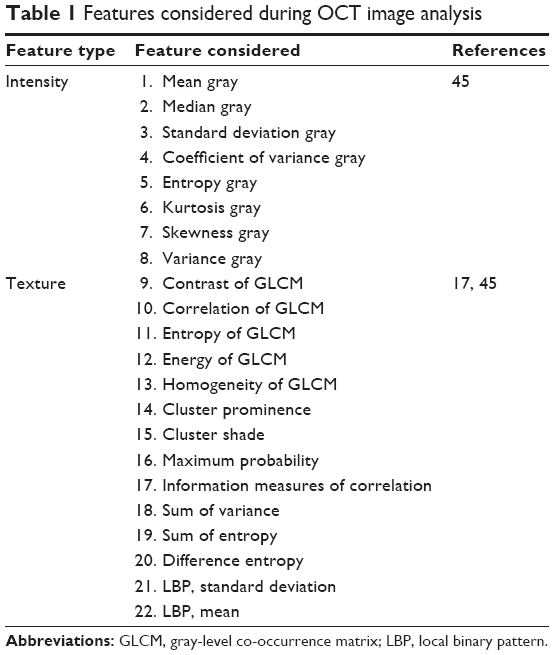 | Table 1 Features considered during OCT image analysis |
Disease classification by statistical analysis of OCT image features
The normal and disease classes based on the features were classified using the “Classification Learner App” of MATLAB R2015a version. Student’s two-tailed t-tests with 95% confidence intervals were also performed with each of the disease classes (DM and DR) and the NOM group to identify disease-specific important features separately. Principal component analysis (PCA) followed by linear discriminant analysis (LDA) using 20 principal components were performed for OCT intensity and textural features to classify NOM, DR, and DM (Figure 2). The significant textural and intensity features were proposed as QIBs. Linear, quadratic, and cubic kernel alternates of SVMs were used during classification using 10-fold cross-validations.
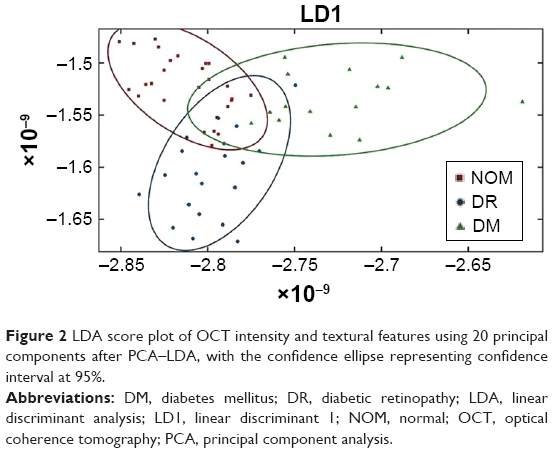 | Figure 2 LDA score plot of OCT intensity and textural features using 20 principal components after PCA–LDA, with the confidence ellipse representing confidence interval at 95%. |
Retinal thickness profile alteration and possible cues toward neuroretinal degeneration
Six retinal layers (namely, GCL, ONL, IPL, OPL, RPE, and RNFL) were targeted for retinal layer thickness measurements, since these layers exhibit clinical manifestations during retinal neurodegeneration in most of the neuropathological conditions.22 Thickness of the layers was measured by the ImageJ software (version 1.50i; National Institutes of Health [NIH], Bethesda, MD, USA) using high-resolution SD-OCT images after manual segmentation with MATLAB R2015a. Previous studies have linked the thinning of RNFL and other layers to a few neurodegenerative and brain diseases, such as Alzheimer’s disease,23 Parkinson’s disease, and multiple sclerosis.24 Moreover, according to an earlier study,49 magnetic resonance imaging (MRI) revealed that retinal neurodegeneration is associated with global or regional cerebral atrophy. In this study, using OCT, the retinal layer thickness profiles were examined, their textural and intensity features were extracted using semiautomated methods to find the QIBs for retinal neurodegeneration in DR. For proposing the QIBs, we used Weka feature selection tool (v3.8; University of Waikato, Hamilton, New Zealand) for selecting a subset of features using a specific search method and attribute evaluator followed by spectropathological characterization of serum using specified modalities.
Feature extraction from FA and fundoscopy images
Fundus and FA images were acquired from the same patients and the geometric attributes were evaluated for understanding the degenerative neuropathology of DR. The optic disk was considered as the reference, and four different quadrants were marked for the field to extract attributes such as tortuosity index, radius of curvature, curvature, and bifurcation angles of four major arterioles, one from each quadrant (Figure 3). In extracting the arteriolar features from the images, semiautomated processes were used, and the spatial coordinates of the pixels from corresponding arterioles were obtained using ImageJ (v1.48). The radius of curvature of first-order and second-order arterioles and the tortuosity index of the first-order arterioles were calculated using MATLAB R2015a. The current study presents a quantitative measurement of specific retinal vascular attenuations, including tortuosity, curvature, and radius of curvature, as an indirect assessment of β-amyloid protein deposition in retinal vessels, which induces vascular fragility and neuroretinal degenerative symptoms in DR.
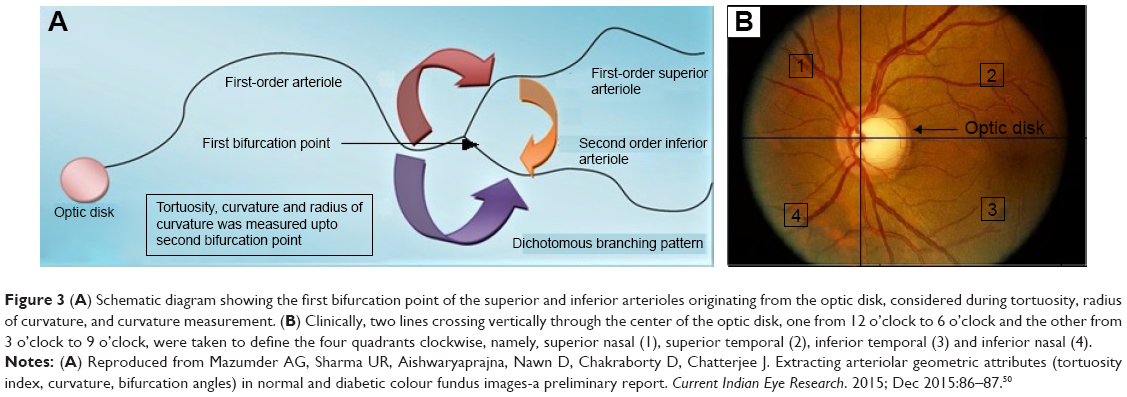 | Figure 3 (A) Schematic diagram showing the first bifurcation point of the superior and inferior arterioles originating from the optic disk, considered during tortuosity, radius of curvature, and curvature measurement. (B) Clinically, two lines crossing vertically through the center of the optic disk, one from 12 o’clock to 6 o’clock and the other from 3 o’clock to 9 o’clock, were taken to define the four quadrants clockwise, namely, superior nasal (1), superior temporal (2), inferior temporal (3) and inferior nasal (4). |
Serum sample collection for NMR and FTIR spectroscopy
Serum samples were collected from all (DR, DM, and NOM) subjects including those recruited for ocular image acquisition. Two retina specialists with >15 years of experience performed the DR diagnosis, and the DR classification was done following the guidelines of Early Treatment Diabetic Retinopathy Study (ETDRS).25 The serum samples were obtained within 7 days from the diagnosis of DR (early condition; NPDR). Glycated hemoglobin (HbA1c)26 was estimated by boronate affinity chromatography (Micromat II; Bio-Rad, Hercules, CA, USA).
NMR data acquisition and identification of serum metabolites responsible for retinal neurodegeneration
In this study, peripheral blood samples (6 mL) were collected and preserved in collection tubes (BD Vacutainer Plus plastic K2EDTA tubes) and transported to the laboratory within 5 minutes of collection. The red blood cells were removed by centrifugation at 3,000 rpm for 15 minutes to exclude erythrocytes from serum. Serum samples were then transported into cryogenic tubes and stored at −80°C. Serum samples (200 μL) were diluted in D2O (400 μL) containing 1 mM sodium salt of 3-(trimethylsilyl) propionic-2,2,3,3, d4 acid (TSP). Solvent residual peak of D2O was considered as standard in NMR experiments. Water peaks were suppressed for minimizing the noise of the NMR spectrum.1H-NMR spectra were acquired on a 600 MHz (9.4 T) magnet interfaced to a spectrometer (Avance 600; Bruker, Rheinstetten, Germany) and kept at 30°C throughout the experiment. Before assessment, each spectrum was digitized in 1,000 bins of identical widths so that all peaks were considered. Once digitized, they were fed into MestReNova (ver 9.0.0.12821; Mestrelab Research, S.L., Santiago, Spain). After checking and comparing the concentrations (in parts per million) and intensities with those in the Human Metabolome Database (HMDB),27 we could enquire which NMR peaks (ie, metabolites) were responsible for the chemical shifts.
Statistical analysis using MetaboAnalyst 3
The uploaded NMR data set was summarized in a table, in which each sample was formally denoted by a row and each feature was represented by a column. Data were normalized consecutively to reduce the systematic variance. The analysis used two chemometric statistical methods: partial least squares DA (PLS-DA) and orthogonal projection to latent structures DA (OPLS-DA) to achieve both classification and feature selection using the online MetaboAnalyst (v3) software.28
Metabolic pathway analysis
Comprehensive analysis of the most relevant metabolic pathways and networks in patients with DR-associated retinal neurodegeneration was performed with MetaboAnalyst, which corroborates the results from powerful pathway enrichment analysis used for the conditions under study. MetaboAnalyst follows high-quality Kyoto Encyclopedia of Genes and Genomes (KEGG) metabolic pathways as the back-end information base. It integrates many well-established approaches (ie, overrepresentation analysis and univariate analysis), novel algorithms, and notions (ie, global analysis of covariance [ANCOVA], global test, and network topology study) with pathway scrutiny in the quest for spectropathological biomarkers for retinal neurodegeneration in DR.
FTIR spectroscopy and identification of metabolites in serum
Frozen serum samples were initially kept in cryogenic tubes at 4°C for 60–90 minutes before FTIR data acquisition. Then, 100 μL serum samples placed on KBr pellets, which were used as substrates, were air-dried using a dehumidifier (Bry-Air FFB-170, Bry-Air, Gurugram, India) for 15 minutes to form homogeneous dried films, which were then subjected to analytical exploration with attenuated total reflection (ATR)-FTIR spectroscopy. IR spectra were documented using Nicolet 6700 FTIR spectrophotometer (Thermo Electron Corporation, Madison, WI, USA) installed with Smart Multibounce horizontal ATR (HATR) attachment and Smart SpeculATR attachments, operated by OMNIC software (v9.2.86; Thermo Fisher Scientific Inc, Waltham, MA, USA). Each IR spectrum was initially cut to 900–1,800 cm−1 regions, differentiated, and vector-normalized. Second-order differentiation was applied with OMNICS (ver 9.2.86, Thermo Fisher Scientific Inc) and IRootLab software,29 combined with Savitzky–Golay (SG) algorithm having specific parametrical settings (number of coefficients: nine; polynomial fit order: two; differentiation order: two).
Multivariate statistical analysis of FTIR data
Advanced chemometric tools such as forward feature selection (FFS) and Mann–Whitney’s U-test were used to extract the signatures of biochemical alterations. Extracted features were further validated by the difference between mean spectra (DBMS) technique in OMNICS, taking the group mean, followed by peak detection with 50% sensitivity. The spectra of serum samples of all three groups (DM, DR, and NOM) were compared with the mean spectra of the healthy serum samples to find out the discrimination efficacy among the different groups. Dependence of the differences of spectral signatures obtained for different conditions was assessed by applying PCA for different data sets, followed by LDA, to distinguish among groups of spectra based on very subtle biochemical differences in an unsupervised manner (Figure 4B and D). The 900–1,800 cm−1 spectral interval, considered as the “fingerprint region”, was chosen to reveal the difference relative to the mean spectra (Figure 4B). The mean FTIR spectra of the whole region (400–4,000 cm−1) are represented in Figure 4A. The range of 400–1,200 cm−1 is known to represent the carbohydrate content, although 1,000–1,200 cm−1 is considered as the key representative zone for polysaccharides, glycogen, and glucose (Figure 4C). The mean spectra of the 400–4,000 cm−1 region of all conditions (NOM, DM, and DR) are shown in Figure 4E–G in stacked format. The findings were statistically validated by classification of disease conditions using linear, quadratic and cubic SVMs with different combinations of spectral signatures responsible for retinal neurodegeneration. Lastly, efficiency of disease grouping was measured by means of the “Classification Learner App” of MATLAB R2015b (MathWorks).
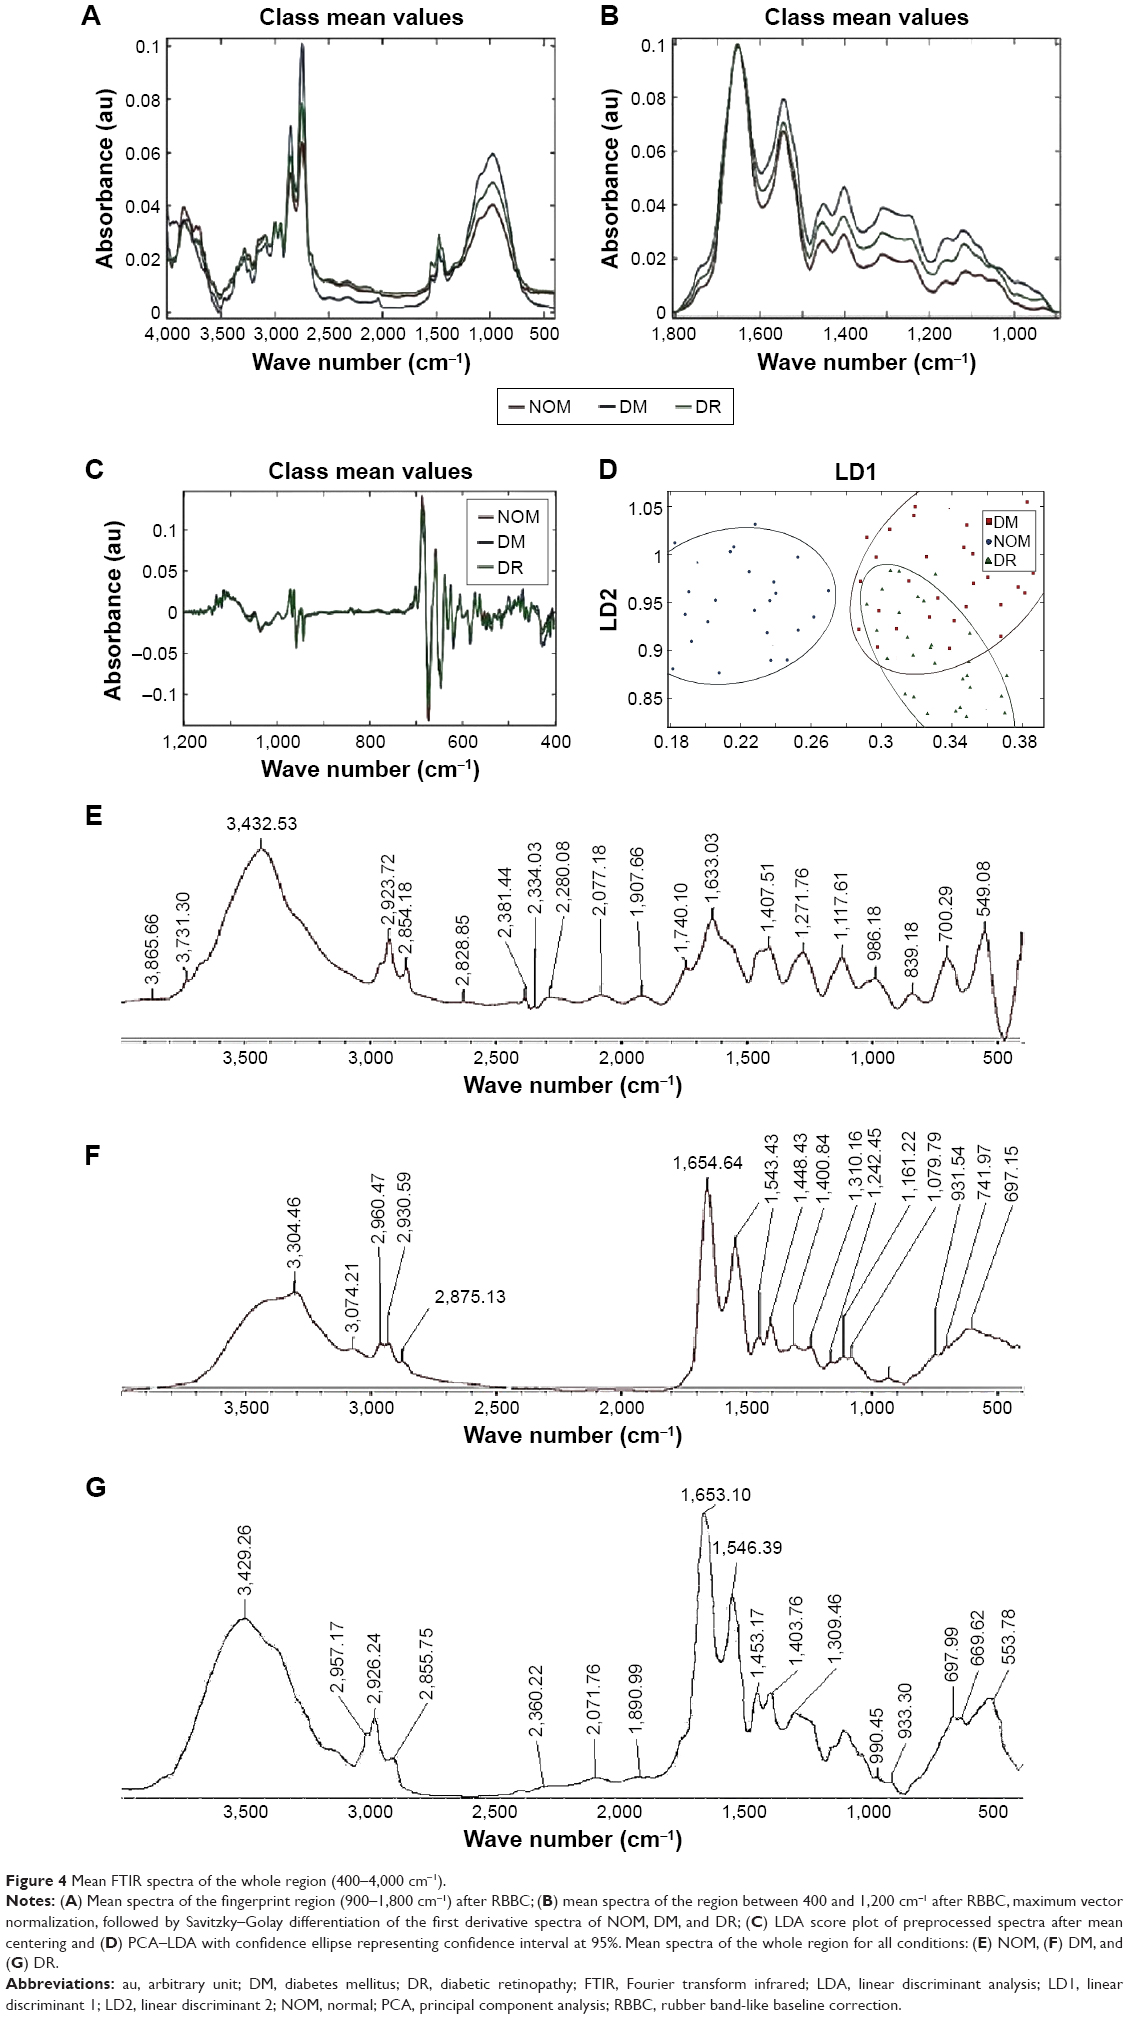 | Figure 4 Mean FTIR spectra of the whole region (400–4,000 cm−1). |
Results
Mean duration of in DM and DR were 10.1±3.2 years and 16.1±7.3 years respectively (p=1.40169E-06). Mean HbA1C in DM and DR were 6.4%±1.2% and 8.5%±2.6%, respectively (p=2.58638E-05). Mean HbA1C in NOM was 4.9%±0.7%. Proportion of male subjects in the DM, DR, and NOM groups was 51.5%, 54.5%, and 50%, respectively. Image-based DR prognosis needs value addition due to lack of widely accepted well-defined QIBs coupled with metabolic information at the systemic level. In this regard, multimodal information generation and their logical substantiation may be effective, as performed in this study by using OCT, fundoscopy, and FA, along with relevant FTIR and NMR techniques. The textural and intensity feature-based classification of OCT images, using PCA–LDA score plots (Figure 2), was found to have overlaps among NOM, DR, and DM conditions. When three-class classification was performed using cubic SVM, different disease conditions could be classified efficiently using cubic SVMs with 91.7% accuracy, 93.1% specificity, and 92.9% sensitivity. The confusion matrix showing classification accuracies using all three kernels is presented in Figure 5. The significant QIBs selected through Weka feature selection tool (v3.8) were the values of contrast gray-level co-occurrence matrix (GLCM), correlation of GLCM, homogeneity of GLCM, maximum probability, and entropy of GLCM, which were found to be important in NOM and DR discrimination (Table 1). Other statistically significant parameters (p<0.05) to delineate DM and DR were mean and median of the gray values, gray variance, homogeneity of GLCM, energy of GLCM, entropy GLCM, cluster shade, cluster prominence, and sum of variance. Correlation and homogeneity of GLCM, difference entropy, as well as the mean and SD of the local binary pattern (LBP) were found to be important features for distinguishing between DM and DR. Entropy GLCM, homogeneity GLCM, cluster shade, and information measures were found to be the four significant features in discriminating DR from the NOM and DM groups. The insignificant features that were not used further are shown in Table 2, while the significant ones were proposed as QIBs.
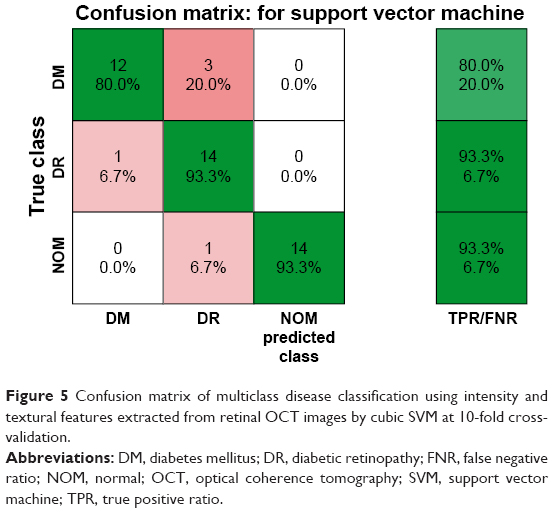 | Figure 5 Confusion matrix of multiclass disease classification using intensity and textural features extracted from retinal OCT images by cubic SVM at 10-fold cross-validation. |
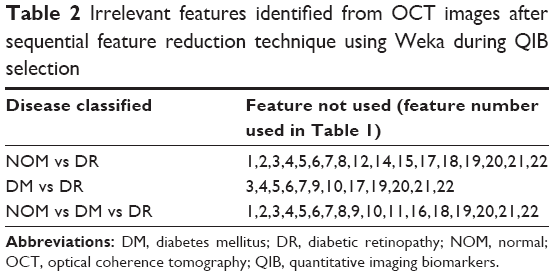 | Table 2 Irrelevant features identified from OCT images after sequential feature reduction technique using Weka during QIB selection |
Measurement of six retinal layers also showed significant insights related to DR-associated retinal neurodegeneration. RNFL thickness was significantly decreased in the DR group in comparison to that in the DM and NOM groups in the superior outer, inferior outer, temporal outer, and nasal outer quadrants of the pericentral area of the macula (Table 3). The thickness differences of GCL, IPL, ONL, and RPE layer between diabetics and NOM were not statistically significant, although a decreasing trend was observed in the layer thickness mentioned in the DR group compared to the DM and NOM groups, in the inner and outer ring quadrants (Figure 6; Table 3).
 | Figure 6 Interconnected box plots showing intraretinal layer thickness measurements (in micrometers) in the pericentral area of the macula in patients with type 2 diabetes with no DR (DM) or DR compared to normal healthy individuals (NOM). |
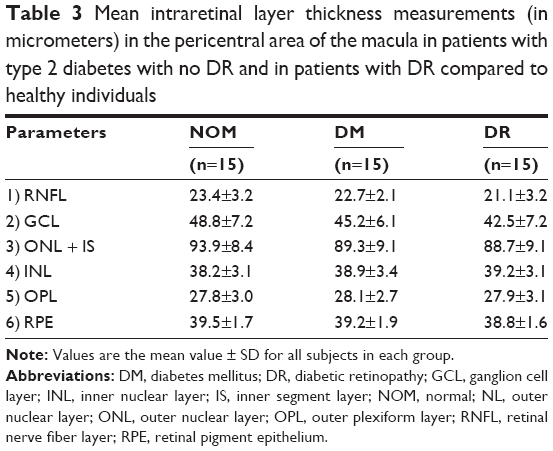 | Table 3 Mean intraretinal layer thickness measurements (in micrometers) in the pericentral area of the macula in patients with type 2 diabetes with no DR and in patients with DR compared to healthy individuals |
Arteriolar features from color fundus and FA images were analyzed through semiautomated processes using MATLAB R2015a to understand retinal neurodegeneration and consequent DR pathology. DR was observed to have higher tortuosity indexes than those of DM (Figure 7A). Further, the radius of curvature was significantly increased in DR (Figure 7B). The ROC is inversely proportional to curvature. The tortuosity indexes showed negligible alterations between DM and DR, whereas significant differences were observed in the radius of curvature and curvature among all conditions (Figure 7B and C).
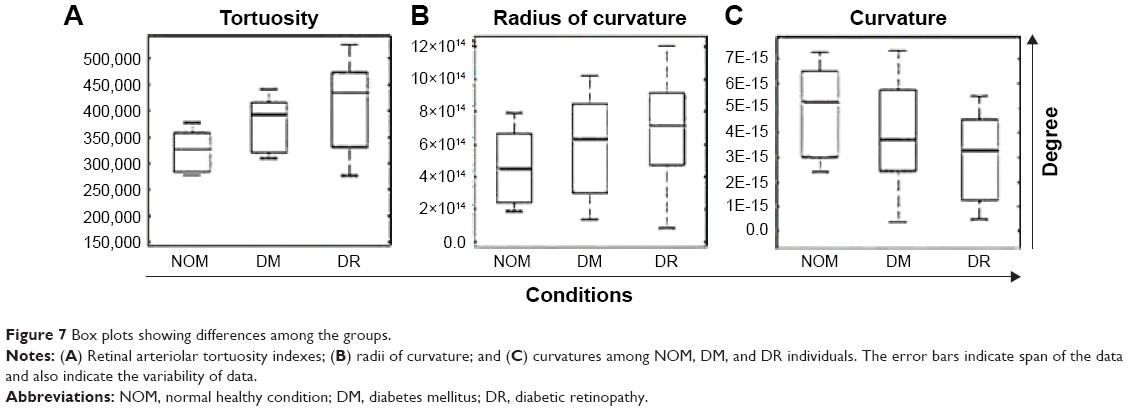 | Figure 7 Box plots showing differences among the groups. |
As OCT, fundoscopy, and FA could provide features only related to structural changes in the retinal layers and fundus, 1H-NMR and FTIR analyses on serum samples provide discriminatory spectropathological signatures could be obtained, correlating with evidences obtained through ocular imaging modalities. The NMR spectra of DM, DR, and NOM samples indicated that ribitol (a kind of polyol) was found to be expressed in DR. Four peaks confirmed the presence of ribitol in the blood of DR-affected individuals (peaks at 3.981 ppm, 3.682 ppm, 3.895 ppm, and 3.707 ppm). Polyol induces neuroretinal apoptosis and degeneration of ganglion cells, resulting in a decrease of GCL thickness. The morphological features obtained from OCT were directly correlated with the elevated level of polyols (namely, ribitol and other sugar alcohols) in the blood serum. Presence of uridine 5′-diphosphate-N-acetyl glucosamine (UDP-Glc-NAc) was evident from the appearance of three peaks at 3.552 ppm, 3.893 ppm, and 3.922 ppm. UDP-Glc-NAc is an acetylated amino sugar nucleotide. Three peaks (3.642 ppm, 3.591 ppm, and 3.58 ppm) in NMR showed the presence of glycerophosphocholine in the serum samples, which is a key intermediate in retinol metabolism. Levels of D-glucose and fructose-6-phospate were also found to be upregulated, indicating higher level of glycolysis and utilization of excess amounts of glucose in DM and DR as compared to NOM.
Development of DR-associated retinal neurodegeneration was also found to be associated with hyperlipidemia, which was identified by the presence of FTIR peaks in the region between 1,100 and 1,700 cm−1. It indicated elevated levels of cholesterol, triglycerides, low-density lipoproteins, high-density lipoproteins, and phospholipids in the serum. This excess amount of triglyceride undergoes lipolysis to generate glycerol and releases free fatty acids into the bloodstream, promoting excessive angiogenesis. The presence of free fatty acids was detected at 1,418 cm−1. The strong pulse at 1,697 cm−1 and the region between 1,610 and 1,635 cm−1, extracted with Mann–Whitney’s U-test, revealed the noteworthy increase in β-sheet-containing proteins in serum in the DR condition compared to DM and NOM.
Discussion
It was observed that selected OCT features could very well differentiate DR from DM and NOM, in addition to identifying the retinal layers indicating neuroretinal degeneration with high sensitivity, specificity, and accuracy. The classification performances of SVMs with different kernels following 10-fold cross-validations are represented in Table 4. SVMs were thus useful for better classification. Cubic and quadratic SVMs were found to be more efficient than linear SVM in DR discrimination. Sasongko et al30 reported that people with mild and moderate stages of DR showed increased arteriolar tortuosity. Enrico Grisan et al31 presented a novel method for the automatic grading of DR using retinal vessel tortuosity as an indicator. In this study, both DM and DR showed higher arteriolar tortuosity indexes than NOM (Figure 7), which corroborates earlier experimental results obtained by Sasongko et al30 and Iorga and Geoff32 (Figure 7A). The vascular attenuation, complexity of branching patterns, vessel tortuosity, and changes in the retinal vasculature morphology are associated with amyloid depositions extending from the CNS to the retina in most of the neurodegenerative conditions, resulting in vessel wall destruction. Researchers have evaluated retinal fundus and FA images of patients with neurodegenerative conditions (eg, Alzheimer’s disease and other diseases) and found that retinal blood vessel alterations are associated with plaque depositions in the brain.33 These alterations consist of venous branching pattern asymmetries, as well as increased arteriolar length-to-diameter ratios. Researchers also computed vascular attenuation, complexity of branching pattern, and vessel tortuosity and hypothesized that retinal vasculature morphological changes consist of amyloid depositions extending from the CNS to the retina, resulting in vessel wall destruction.34 Using a mouse model, investigators proved that microvascular impairment observed in neurodegenerative diseases such as Alzheimer’s disease is due to amyloid accumulation in small blood vessels, which leads to increased tortuosity and reduced vessel caliber.35
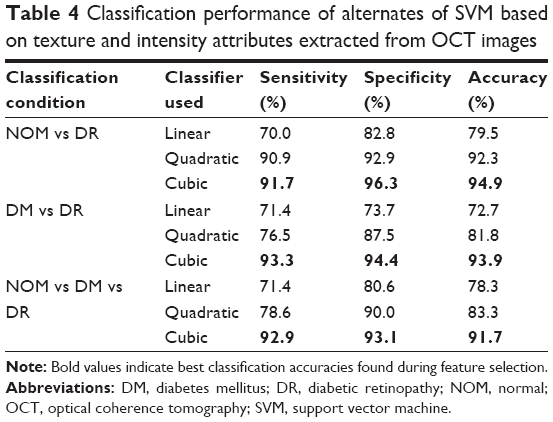 | Table 4 Classification performance of alternates of SVM based on texture and intensity attributes extracted from OCT images |
Emerging evidences suggest that neurodegeneration manifests as microvascular alterations that occur early in DR, such as the breakdown of the blood–retinal barrier (BRB),36,37 vasoregression,38 and the impairment of neurovascular coupling.39 The amyloid protein aggregates usually consist of fibers containing misfolded proteins with β-sheet conformations.40 The results from the fundus and FA images clearly indicate asymmetries in vasculature and other geometric attributes were significantly altered in DR, which may be due to high β-amyloid protein depositions, responsible for inducing neoangiogenesis, vascular fragility, and neurodegeneration extending from the CNS to the retina in DR.
1H-NMR revealed higher concentration of ribitol in the serum in DR compared to that in DM and NOM. Ribitol being a polyol may have a crucial role in retinal cell apoptosis. Ribitol is a metabolic end product produced by the reduction of ribose in human fibroblasts and erythrocytes. Transfer of ribitol across the cell membranes shows that it can be expelled from the body without any metabolic transformation. Several inborn defects of metabolism due to abnormal polyol concentrations in body fluids are known to date.41 Most of these defects can be diagnosed by assessing the urinary concentration of polyols. Microvascular complications such as DR are associated with accumulation of sugar alcohols in cells, since excessive amounts of glucose trigger polyol or sugar alcohol metabolism and consequent building up of polyols in cells.42 Ribitol and D-arabitol elevation in all body fluids were found concomitant with abnormal polyol metabolism in peripheral neuropathy and leukoencephalopathy.43 In this study, we reported increased level of ribitol in blood, which is associated with abnormal polyol metabolism and may be contributory to the development of DR and progressive retinal neurodegeneration. Thinning of GCL (Table 3) in retina can be corroborated with the high concentration of polyols in serum (viz, ribitol) and its role in cell apoptosis, causing retinal neurodegeneration in early DR. DR specimens showed substantially lower concentration of glycerophosphocholine since reduced level of β-carotene or vitamin A results in retinal impairment. Impaired retinol metabolism leads to abnormal activation of retinol, which in turn forms 11-cis-retinal (chromophore of rhodopsin) and accumulates retinol-binding protein (RBP) within the cell.44 This may prompt retinal neurodegeneration through unusual pigment synthesis in rod and cone cells (Figure 8B). The NMR findings further supported evidences from OCT, which clearly showed reduction in RPE thickness and cell population. This can be correlated with the downregulation of glycerophosphocholine in serum, inducing aberrant retinol metabolism and reduction of RPE thickness in DR-associated retinal neurodegeneration.
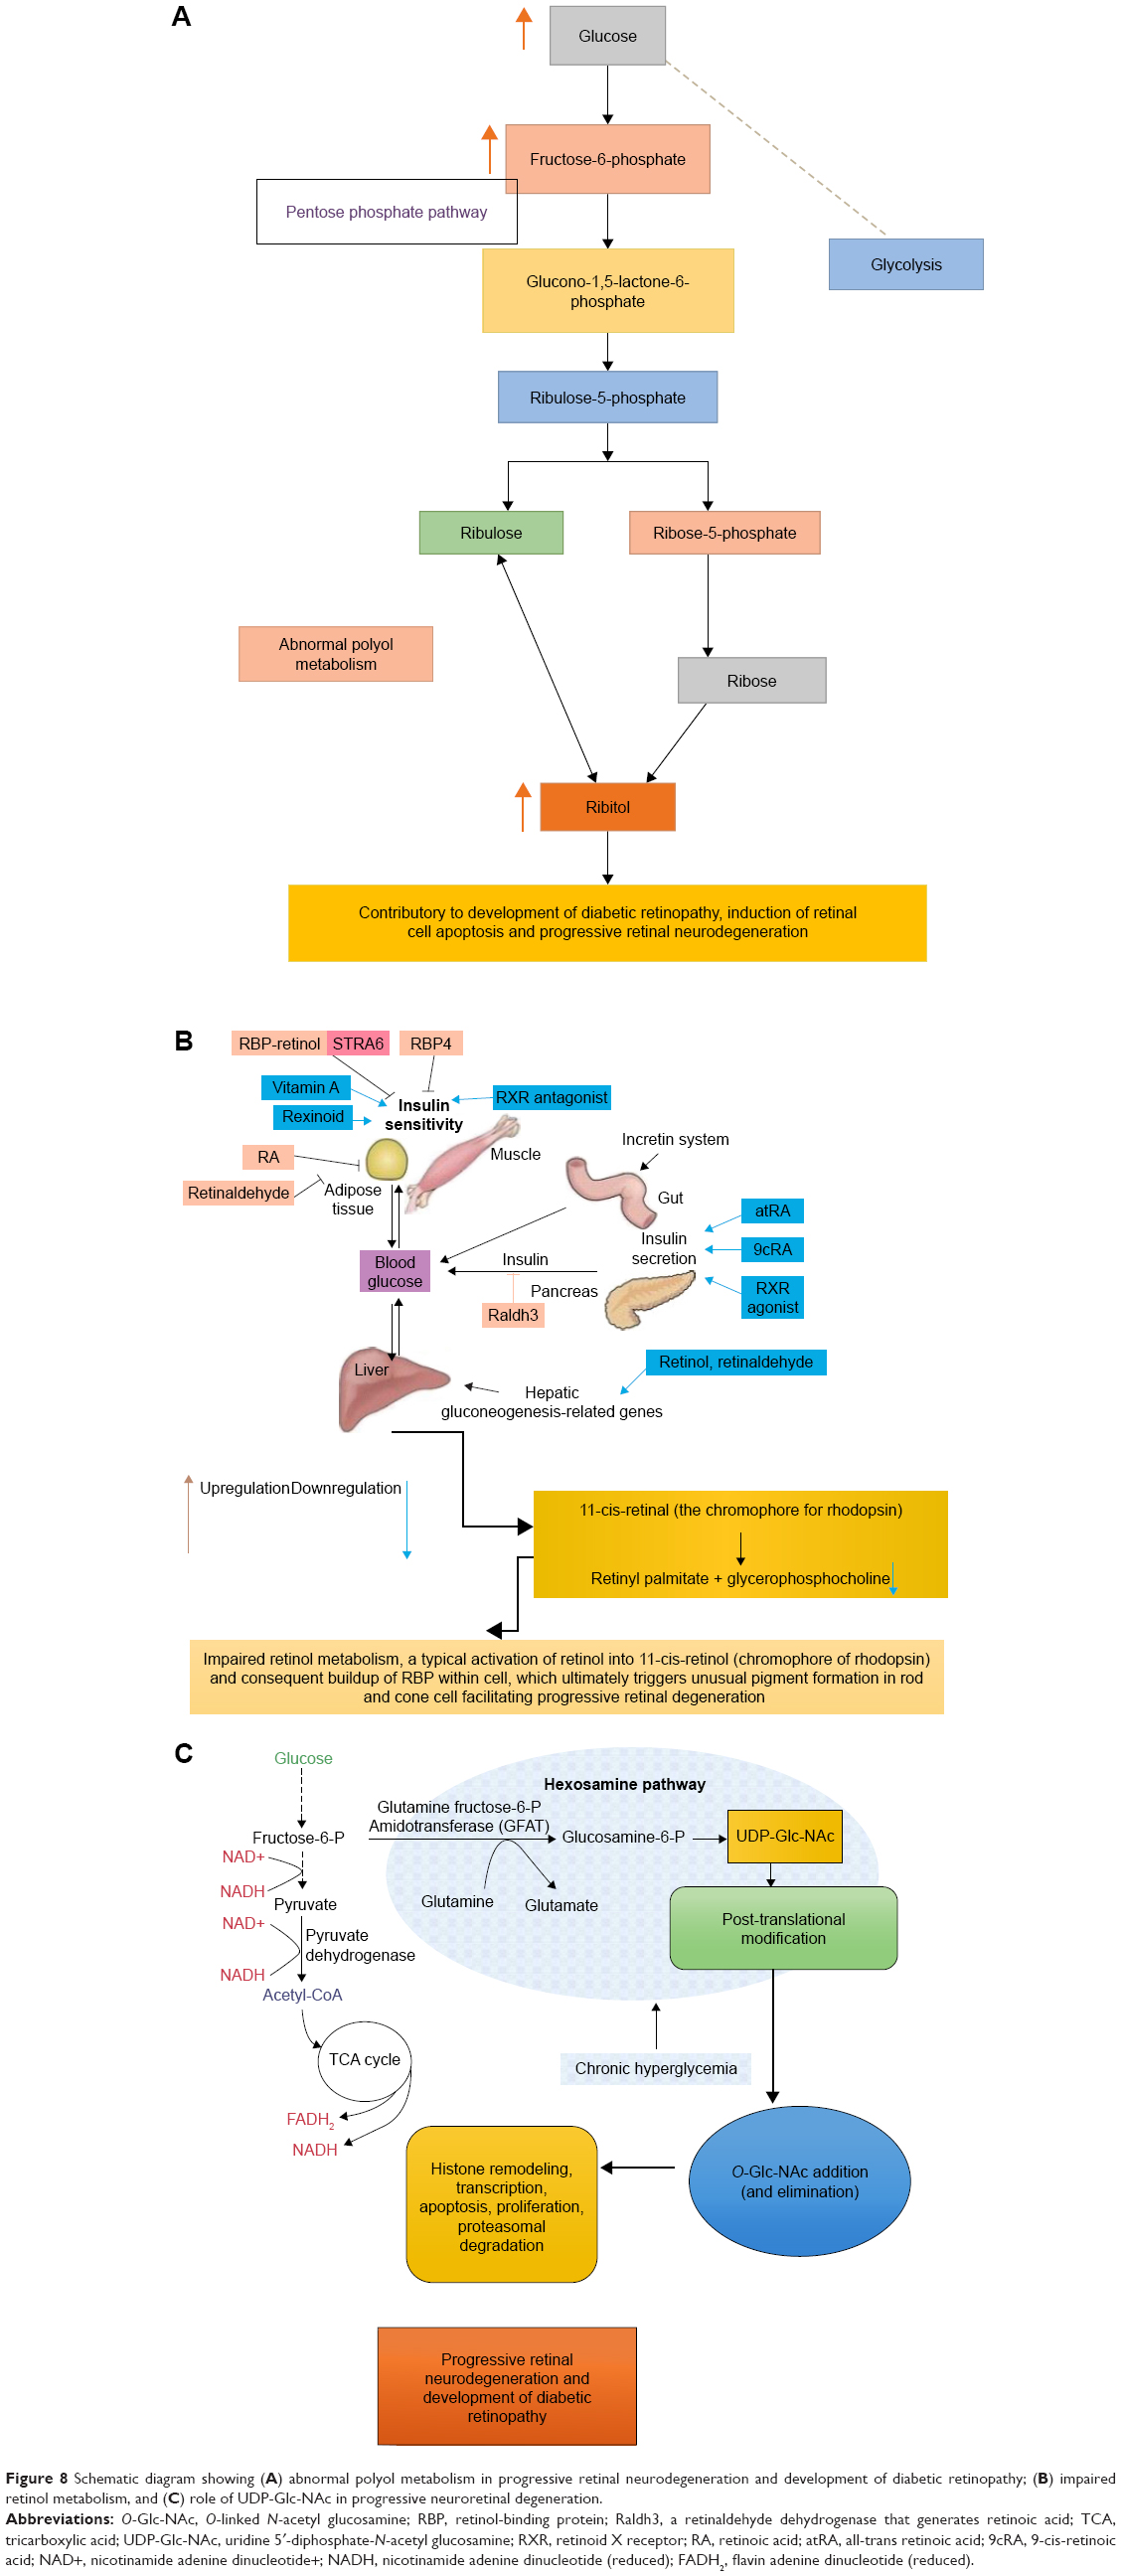 | Figure 8 Schematic diagram showing (A) abnormal polyol metabolism in progressive retinal neurodegeneration and development of diabetic retinopathy; (B) impaired retinol metabolism, and (C) role of UDP-Glc-NAc in progressive neuroretinal degeneration. |
UDP-Glc-NAc was also found to be upregulated in DR patients. It is the substrate for the modification of nucleocytoplasmic proteins at serine and threonine moieties with N-acetyl glucosamine (O-Glc-NAc).45 Mammals respond to excess of nutrients by activating O-GlcNAcylation (addition of O-linked N-acetyl glucosamine). O-Glc-NAc addition (and elimination) is central to transcription, histone remodeling, apoptosis, and proteasomal degradation, cell proliferation and it is mediated by UDP-Glc-NAc.46 This nutrient-responsive signaling pathway also controls the insulin signaling pathway. Alterations in O-Glc-NAc metabolism are correlated with various health complications, including DM and neurodegeneration (Figure 8C).47 Increased levels of O-Glc-NAc have influence on insulin-stimulated glucose uptake. These suggest that UDP-Glc-NAc may have a pivotal role in progressive retinal neurodegeneration and development of DR. The effect of UDP-Glc-NAc can also be directly corroborated with retinal layer thinning, vascular asymmetry, and changes in other geometric features observed in fundoscopy and FA images, showing symptoms of neuroretinal degeneration. Glucose and fructose-6-phosphate concentrations were also found to be upregulated in DR. Alterations in glucose consumption and redox status in diabetic eyes contribute to the development of retinopathy by affecting osmolarity, inducing oxidative damage, and altering neurotransmission (Figure 8A).48
The assigned metabolites in Figure 9 show a typical 600 MHz 1H-NMR Carr–Purcell–Meiboom–Gill (CPMG) spectrum of serum from DR, DM, and NOM individuals. UDP-Glc-NAc, ribitol, glycerophosphocholine, and fructose-6-phosphate were identified. Identified metabolites and their expressional changes are represented in Table 5. The intensity peaks of each metabolite are shown in stacked format in Figure 9A–C and highlighted with different colors. The receiver operating characteristic (ROC) curve generated from cross-validated predicted Y-values, fold change of metabolites, the sensitivity, and the specificity of predictive models are represented in Figure 10. Area under the curve (AUC) of ROC analysis was found to be 1.0 in case of ribitol and fructose-6-phosphate, denoting high predictive accuracy of the model. The ROC analysis AUCs for glycerophosphocholine and UDP-Glc-NAc were found to be 0.96 and 0.97, respectively, showing a high accuracy of the model (Figure 10A–D). The expressional fold changes of UDP-Glc-NAc, ribitol, glycerophosphocholine, and fructose-6-phosphate were found to be 2.6, 1.67, 2.0, and 4.5, respectively, in DR compared to the level in DM.
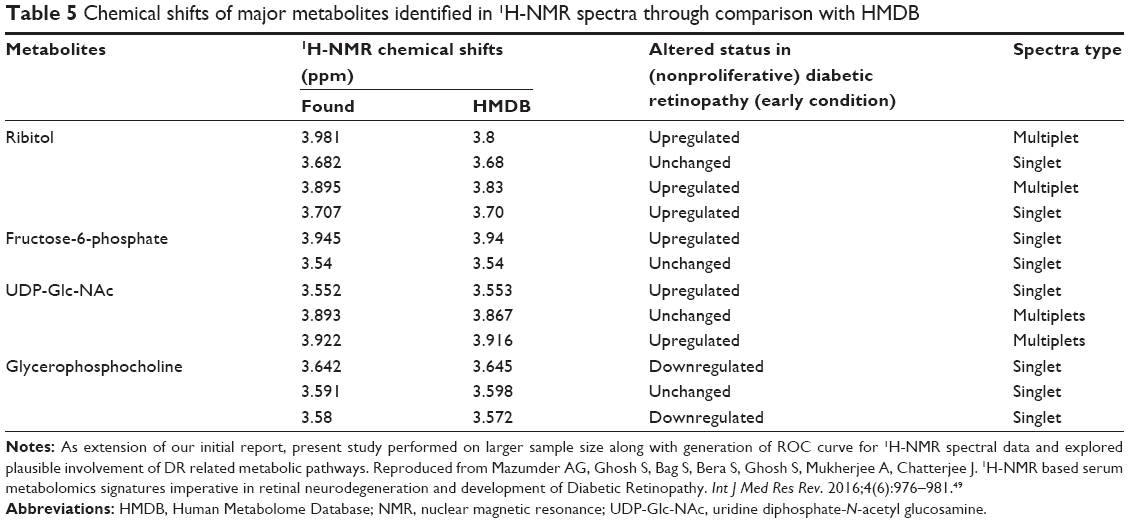 | Table 5 Chemical shifts of major metabolites identified in 1H-NMR spectra through comparison with HMDB |
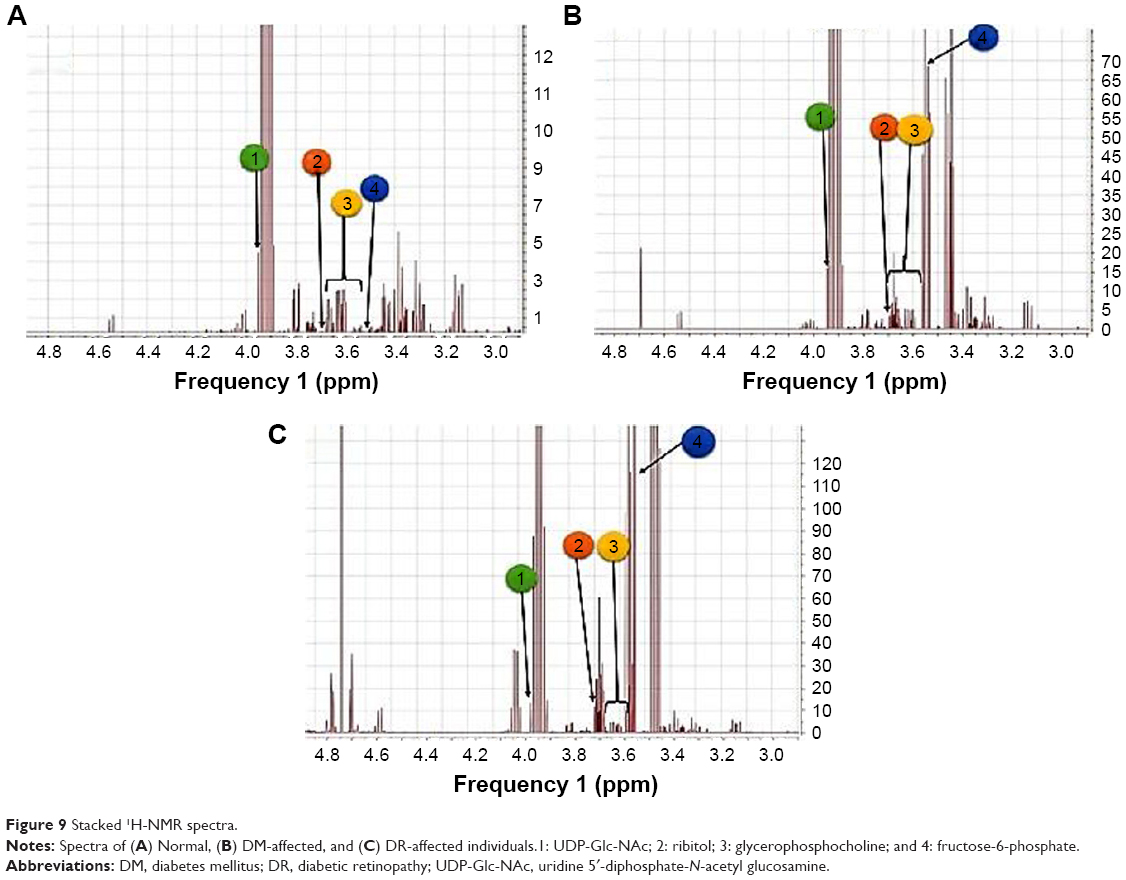 | Figure 9 Stacked 1H-NMR spectra. |
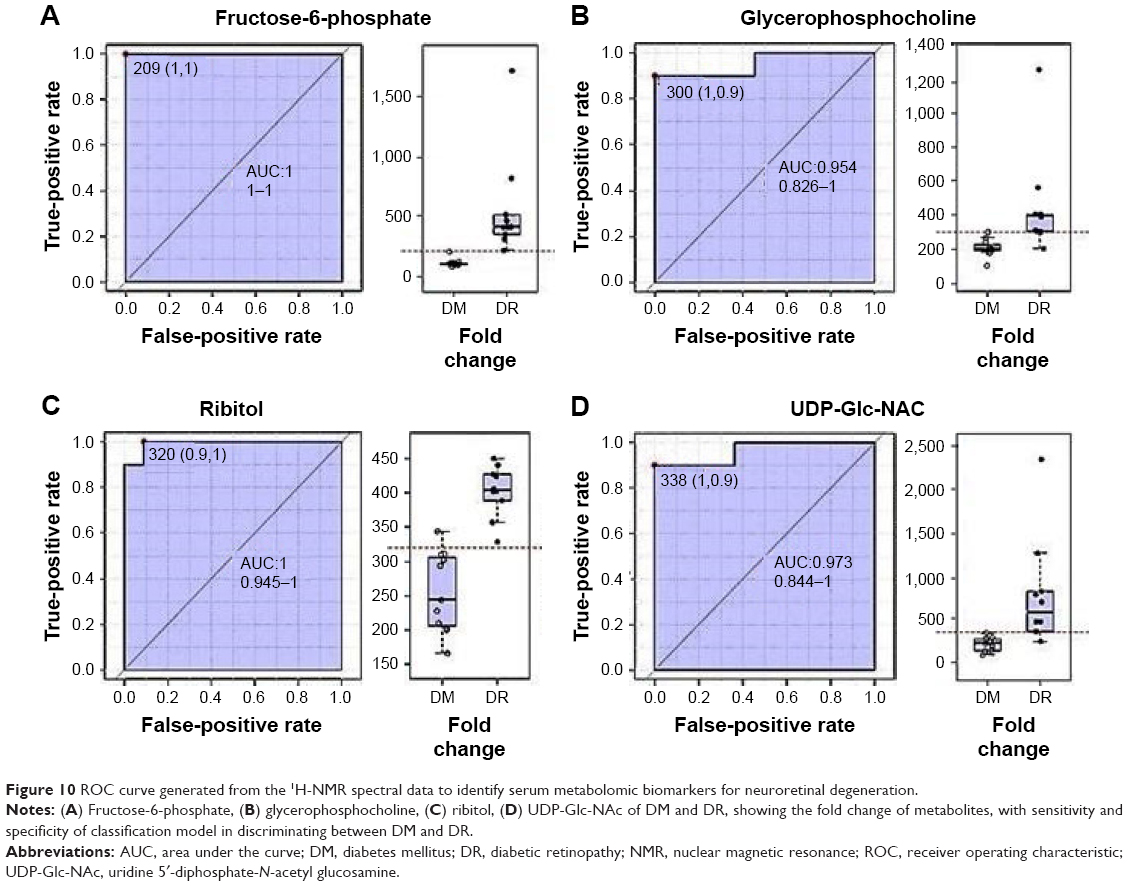 | Figure 10 ROC curve generated from the 1H-NMR spectral data to identify serum metabolomic biomarkers for neuroretinal degeneration. |
These results illustrate 1H-NMR-based spectropathological attributes as sufficient evidences to be used in candidate prognosticators for future therapeutic approaches but also they can be correlated with QIBs extracted from OCT, fundoscopy, and FA. These QIBs can be used for the detection of retinal neurodegeneration in DR. FTIR studies demonstrated alterations in the levels of plasma lipid/cholesterol (Figure 4). These alterations play a pivotal role in inducing neurodegenerative complications. It has also been reported that, in cellular and animal models, elevated cholesterol levels cause β-amyloid protein levels to increase. This further increases the risk of neurodegenerative disorders. The crucial role of lipids in tissue physiology and cell signaling has been observed in many neurological disorders that are associated with deregulated lipid metabolism. FTIR data indicated higher expression of β-sheet-containing proteins (ie, β-amyloid protein, which is a hallmark protein found in neurodegenerative conditions) in the serum in DR condition, it may have a crucial role in inducing neoangiogenesis, vascular tortuosity, and vascular fragility, as well as promoting retinal neurodegeneration during DR progression. This is corroborated with QIBs extracted from retinal color fundoscopy and FA. β-amyloid proteins facilitate generation of oxygen free radicals, which attack neural and retinal cells, thus contributing toward retinal neurodegeneration. The effect of free radicals and the consequent neurotoxicity was noted through the thinning of retinal layers in OCT. A schematic diagram proposing a model for detecting retinal neurodegeneration in early DR using QIBs, with plausible spectropathological information backdrop, is depicted in Figure 11.
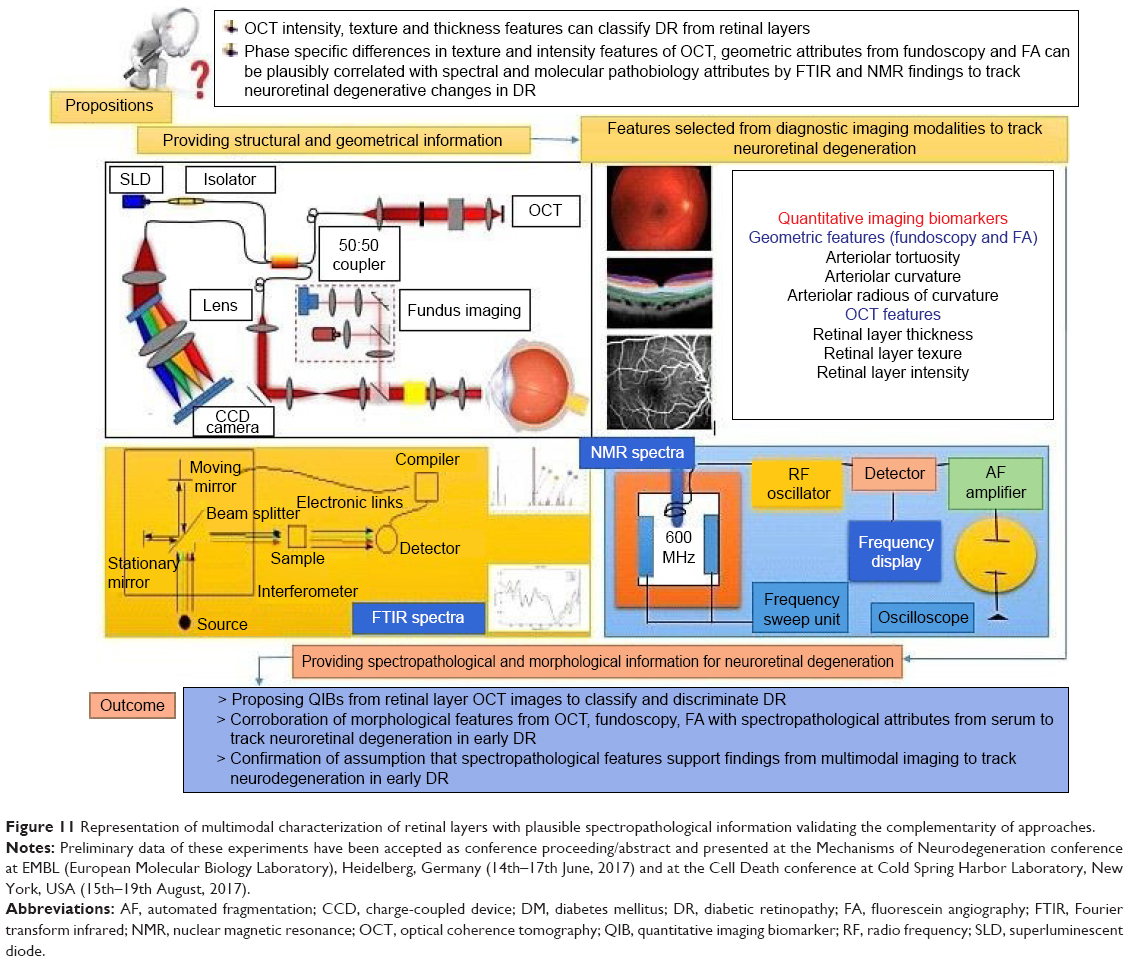 | Figure 11 Representation of multimodal characterization of retinal layers with plausible spectropathological information validating the complementarity of approaches. |
Conclusion
In this study, the scope of multimodal prognosis of DR was explored. Neurodegenerative cues of the disease progression were obtained through integration of complementary evidences acquired from retinal imaging techniques, such as (Viz OCT, fundoscopy, and FA), and spectroscopy of (Viz FTIR and NMR) of serum samples. OCT provided intensity and textural features of the retinal layers, whereas geometric features of the retinal vasculature were extracted from fundoscopy and FA. In the serum samples, NMR recognized three key metabolites (ribitol, glycerophosphocholine, and UDP-Glc-NAc), while FTIR confirmed higher expressions of lipids and β-sheet-containing proteins (eg, β-amyloid), responsible for neoangiogenesis, vascular fragility, and subsequent neuroretinal degeneration. It was found that β-amyloid oligomers are responsible for human muscle degenerative diseases and neuronal damages in the brain. The current findings also suggested that these proteins are likely to contribute to DR. This proof-of-concept study also examined the efficacy of intensity- and texture-based features extracted from the retinal layers through OCT and the geometric features obtained from fundoscopy and FA, toward optimal and painless diagnostic segregation of ocular complications with high sensitivity and specificity. This may alleviate challenges allied with fallacious diagnosis of retinal neurodegenerative complications of DR. Retinal layer-specific thickness changes emphasized alterations in retinal layer compositional characteristics. Based on these thickness alterations, intensity and textural features of OCT features can be considered as QIBs for retinal layer differentiation and detection of DR-specific neuroretinal degeneration. Elevated expressions of lipids and β-sheet-containing proteins (obtained from spectropathological methods) and geometrical changes of the retinal vasculature (seen under color fundoscopy and FA) were found to be characteristic of neurodegeneration related to early DR. This work can therefore be considered as an attempt to develop a diagnostic model for the integrated assessment of DR-associated retinal neurodegeneration using QIBs, coupled with spectropathological information from serum, incorporating a systems pathology approach.
Acknowledgments
The authors acknowledge the Council of Scientific and Industrial Research (CSIR), New Delhi, India (award number: 315988) for providing financial support. The authors also acknowledge the Fulbright Foreign Scholarship Board (FFSB), Washington, DC, USA, as well as the United States–India Educational Foundation (USIEF) (grantee ID 15141659), India, for providing financial support for doing research at the Johns Hopkins School of Medicine, MD, USA. The research experience was helpful in synthesizing ideas for this work. There are no relationships between the authors or members of their families mentioned in the research article.
Disclosure
The authors report no conflicts of interest in this work.
References
Yau JW, Rogers SL, Kawasaki R, et al; Meta-Analysis for Eye Disease (META-EYE) Study Group. Global prevalence and major risk factors of diabetic retinopathy. Diabetes Care. 2012;35(3):556–564. | ||
Herbert HM, Jordan K, Flanagan DW. Is screening with digital imaging using one retinal view adequate? Eye (Lond). 2003;17(4):497–500. | ||
Filla LA, Edwards JL. Metabolomics in diabetic complications. Mol Biosyst. 2016;12(4):1090–1105. | ||
Sohn EH, van Dijk HW, Jiao C, et al. Retinal neurodegeneration may precede microvascular changes characteristic of diabetic retinopathy in diabetes mellitus. Proc Natl Acad Sci U S A. 2016;113(19):E2655–E2664. | ||
Byrne HJ, Baranska M, Puppels GJ, et al. Spectropathology for the next generation: quo vadis? Analyst. 2015;140(7):2066–2073. | ||
Fujimoto JG, Pitris C, Boppart SA, Brezinski ME. Optical coherence tomography: an emerging technology for biomedical imaging and optical biopsy. Neoplasia. 2000;2(1–2):9–25. | ||
Lisboa R, Kaweh M, Zangwill LM, Robert NW, Felipe AM. Likelihood ratios for glaucoma diagnosis using spectral-domain optical coherence tomography. Am J Ophthalmol. 2013;156(5):918–926. | ||
de Sisternes L, Simon N, Tibshirani R, Leng T, Rubin DL. Quantitative SD-OCT imaging biomarkers as indicators of age-related macular degeneration progression predicting AMD progression using SD-OCT features. Invest Ophthalmol Vis Sci. 2014;55(11):7093–7103. | ||
Lim JK, Li QX, He Z, et al. The eye as a biomarker for Alzheimer’s disease. Front Neurosci. 2016;10:536. | ||
Prescott JW. Quantitative imaging biomarkers: the application of advanced image processing and analysis to clinical and preclinical decision making. J Digit Imaging. 2013;26(1):97–108. | ||
Ruggeri M, Tsechpenakis G, Jiao S, et al. Retinal tumor imaging and volume quantification in mouse model using spectral-domain optical coherence tomography. Opt Express. 2009;17(5):4074. | ||
Koturwar P, Girase S, Mukhopadhyay D. A survey of classification techniques in the area of big data. 2015. arXiv:1503.07477. | ||
Mark HE, Clive BB, Charbel H. The role of venous abnormalities in neurological disease. Rev Recent Clin Trials. 2012;7(2):100–116. | ||
Schuetz E, Solon T. Microglia-targeted pharmacotherapy in retinal neurodegenerative diseases. Curr Drug Targets. 2004;5(7):619–627. | ||
Bill A. Blood circulation and fluid dynamics in the eye. Physiol Rev. 1975;55(3):383–417. | ||
Gelatt KN, Esson DW. Physiology of the eye. In: Gelatt KN, editor. Veterinary Ophthalmology. 4th ed. Iowa: Blackwell Publishing Ltd; 2007:149–182. | ||
Kur J, Newman EA, Chan-Ling T. Cellular and physiological mechanisms underlying blood flow regulation in the retina choroid in health disease. Prog Retin Eye Res. 2012;31(5):377–406. | ||
Alonso A, Marsal S, Julià A. Analytical methods in untargeted metabolomics: state of the art in 2015. Front Bioeng Biotechnol. 2015;3:23. | ||
Griffin JL, Des Rosiers C. Applications of metabolomics and proteomics to the mdx mouse model of Duchenne muscular dystrophy: lessons from downstream of the transcriptome. Genome Med. 2009;1(3):32. | ||
Shah SH, Kraus WE, Newgard CB. Metabolomic profiling for identification of novel biomarkers and mechanisms related to common cardiovascular diseases: form and function. Circulation. 2012;126(9):1110–1120. | ||
Veenstra TD. Metabolomics: the final frontier? Genome Med. 2012;4(4):40. | ||
Ughi GJ, Adriaenssens T, Sinnaeve P, Desmet W, D’hooge J. Automated tissue characterization of in vivo atherosclerotic plaques by intravascular optical coherence tomography images. Biomed Opt Express. 2013;4(7):1014–1030. | ||
Shi Z, Wu Y, Wang M, et al. Greater attenuation of retinal nerve fiber layer thickness in Alzheimer’s disease patients. J Alzheimer Dis. 2014;40(2):277–283. | ||
Kersten HM, Roxburgh RH, Danesh-Meyer HV. Ophthalmic manifestations of inherited neurodegenerative disorders. Nat Rev Neurol. 2014;10(6):349–362. | ||
Royle P, Mistry H, Auguste P, et al. The landmark trials: diabetic retinopathy study and early treatment diabetic retinopathy study. 2015. | ||
Little RR, Sacks DB. HbA1c: how do we measure it and what does it mean? Curr Opin Endocrinol Diabets Obes. 2009;16(2):113–118. | ||
Wishart DS, Tzur D, Knox C, et al. HMDB: the human metabolome database. Nucl Acids Res. 2007;35:D521–D526. | ||
Xia J, Sinelnikov IV, Han B, Wishart DS. MetaboAnalyst 3.0 – making metabolomics more meaningful. Nucl Acids Res. 2015;43(W1):W251–W257. | ||
Trevisan J, Angelov PP, Scott AD, Carmichael PL, Martin FL. IRootLab: a free and open-source MATLAB toolbox for vibrational biospectroscopy data analysis. Bioinformatics. 2013;29(8):1095–1097. | ||
Sasongko MB, Wong TY, Nguyen TT, et al. Retinal vessel tortuosity and its relation to traditional and novel vascular risk markers in persons with diabetes. Curr Eye Res. 2016;41(4):551–557. | ||
Grisan E, Foracchia M, Ruggeri A. A novel method for the automatic evaluation of retinal vessel tortuosity. Engineering in Medicine and Biology Society, Proceedings of the 25th Annual International Conference of the IEEE. Vol. 1. 2003:866–869. Cancún, Mexico. | ||
Iorga M, Geoff D. Medical Image Processing. New York: Springer; 2011:269–290. | ||
Frost S, Kanagasingam Y, Sohrabi H, et al; AIBL Research Group. Retinal vascular biomarkers for early detection and monitoring of Alzheimer’s disease. Transl Psychiatry. 2013;3(2):e233. | ||
Ratnayaka JA, Serpell LC, Lotery AJ. Dementia of the eye: the role of amyloid beta in retinal degeneration. Eye. 2015;29(8):1013–1026. | ||
Kusari J, Zhou SX, Padillo E, Clarke KG, Gil DW. Inhibition of vitreoretinal VEGF elevation and blood–retinal barrier breakdown in streptozotocin-induced diabetic rats by brimonidine. Invest Ophthalmol Vis Sci. 2010;51(2):1044–1051. | ||
Silva KC, Rosales MA, Biswas SK, de Faria JBL, de Faria JML. Diabetic retinal neurodegeneration is associated with mitochondrial oxidative stress and is improved by an angiotensin receptor blocker in a model combining hypertension and diabetes. Diabetes. 2009;58(6):1382–1390. | ||
Feng Y, Wang Y, Li L, et al. Gene expression profiling of vasoregression in the retina – involvement of microglial cells. PLoS One. 2011;6(2):e16865. | ||
Noonan JE, Luu CD, Man RE, Lamoureux EL. Retinal neurovascular and neuronal dysfunction in type 1 diabetes letters. Invest Ophthalmol Vis Sci. 2013;54(3):1838. | ||
Ross CA, Poirier MA. Opinion: what is the role of protein aggregation in neurodegeneration? Nat Rev Mol Cell Biol. 2005;6(11):891. | ||
Lorenzi M. The polyol pathway as a mechanism for diabetic retinopathy: attractive, elusive, and resilient. Exp Diabetes Res. 2007;2007:61038. | ||
Cohen MP. The Polyol Paradigm and Complications of Diabetes. New York: Springer Science & Business Media; 2012:36. | ||
Huck JH, Verhoeven NM, Struys EA, Salomons GS, Jakobs C, van der Knaap MS. Ribose-5-phosphate isomerase deficiency: new inborn error in the pentose phosphate pathway associated with a slowly progressive leukoencephalopathy. Am J Hum Genet. 2004;74(4):745–751. | ||
McBee JK, Palczewski K, Baehr W, Pepperberg DR. Confronting complexity: the interlink of phototransduction and retinoid metabolism in the vertebrate retina. Prog Retin Eye Res. 2001;20(4):469–529. | ||
Shen DL, Liu TW, Zandberg W, et al. Catalytic promiscuity of O-GlcNAc transferase enables unexpected metabolic engineering of cytoplasmic proteins with 2-azido-2-deoxy-glucose. ACS Chem Biol. 2016;12(1):206–213. | ||
Ruan H-B, Nie Y, Yang X. Regulation of protein degradation by O-GlcNAcylation: crosstalk with ubiquitination. Mol Cell Proteomics. 2013;12(12):3489–3497. | ||
Lazarus BD, Love DC, Hanover JA. O-GlcNAc cycling: implications for neurodegenerative disorders. Int J Biochem Cell Biol. 2009;41(11):2134–2146. | ||
Duarte JMN. Metabolic alterations associated to brain dysfunction in diabetes. Aging Dis. 2015;6(5):304–321. | ||
Sonka M, Hlavac V, Boyle R. Image Processing, Analysis, and Machine Vision. Cengage Learning. Boston: Springer; 2014. | ||
Mazumder AG, Ghosh S, Bag S, Bera S, Ghosh S, Mukherjee A, Chatterjee J. 1H-NMR based serum metabolomics signatures imperative in retinal neurodegeneration and development of Diabetic Retinopathy. Int J Med Res Rev. 2016;4(6):976–981. | ||
Mazumder AG, Sharma UR, Aishwaryaprajna, Nawn D, Chakraborty D, Chatterjee J. Extracting arteriolar geometric attributes (tortuosity index, curvature, bifurcation angles) in normal and diabetic colour fundus images-a preliminary report. Current Indian Eye Research. 2015;Dec 2015:86–87. |
 © 2017 The Author(s). This work is published and licensed by Dove Medical Press Limited. The
full terms of this license are available at https://www.dovepress.com/terms
and incorporate the Creative Commons Attribution
- Non Commercial (unported, 3.0) License.
By accessing the work you hereby accept the Terms. Non-commercial uses of the work are permitted
without any further permission from Dove Medical Press Limited, provided the work is properly
attributed. For permission for commercial use of this work, please see paragraphs 4.2 and 5 of our Terms.
© 2017 The Author(s). This work is published and licensed by Dove Medical Press Limited. The
full terms of this license are available at https://www.dovepress.com/terms
and incorporate the Creative Commons Attribution
- Non Commercial (unported, 3.0) License.
By accessing the work you hereby accept the Terms. Non-commercial uses of the work are permitted
without any further permission from Dove Medical Press Limited, provided the work is properly
attributed. For permission for commercial use of this work, please see paragraphs 4.2 and 5 of our Terms.